17 Spatial Data
 This page is a work in progress. We appreciate any input you may have. If you would like to help improve this page, consider contributing to our repo.
17.1 Choropleth maps
Cloropleth maps use color to indicate the value of a variable within a defined region, generally political boundaries. The choroplethr package makes it simple to draw choropleth maps of U.S. states, countries, and census tracts, as well as countries of the world; choroplethrZip provides data for zip code level choropleths; choroplethrAdmin1 draws choropleths for administrative regions of world countries.
Note: You must install also install choroplethrMaps for choroplethr to work. In addition, choroplethr requires a number of other dependencies which should be installed automatically, but if they aren’t, you can manually install the missing packages that you are notified about when you call library(choroplethr): maptools, and rgdal, sp.
We’ll use the state.x77 dataset for this example:
library(tidyverse)
library(choroplethr)

# data frame must contain "region" and "value" columns

df_illiteracy <- state.x77 %>% as.data.frame() %>%
  rownames_to_column("state") %>%
  transmute(region = tolower(`state`), value = Illiteracy)

state_choropleth(df_illiteracy,
                 title = "State Illiteracy Rates, 1977",
                 legend = "Percent Illiterate")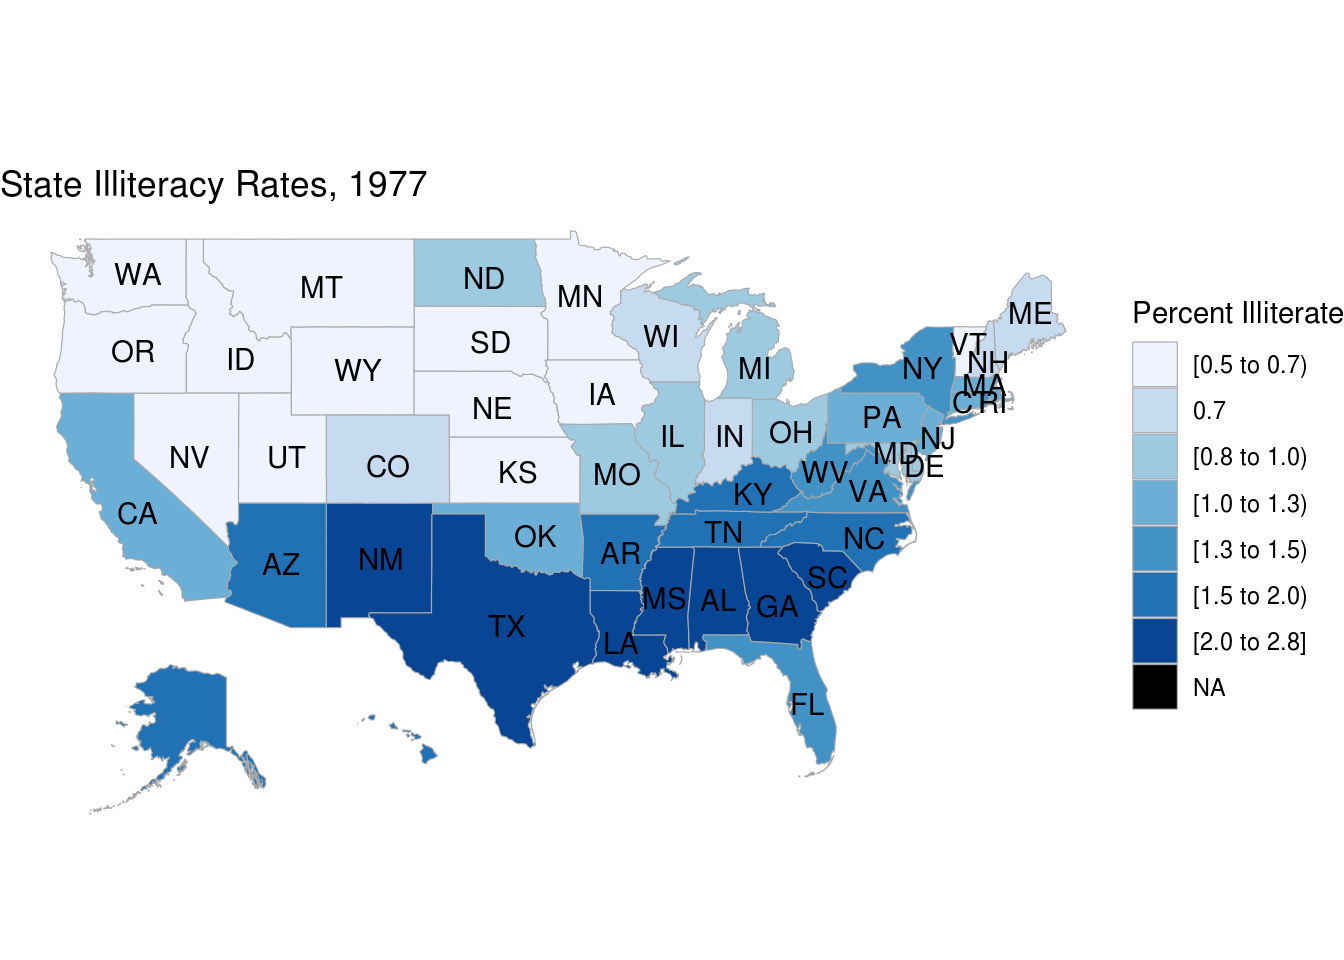
Note: the choroplethr “free course” that you may come across arrives one lesson at a time by email over an extended period so not the best option unless you have a few weeks to spare.
17.2 Square bins
Packages such as statebins create choropleth style maps with equal size regions that roughly represent the location of the region, but not the size or shape.
Important: Don’t install statebins from CRAN; use the dev version – it contains many improvements, which are detailed in “Statebins Reimagined”.
# devtools::install_github("hrbrmstr/statebins")
library(statebins)
df_illit <- state.x77 %>% as.data.frame() %>%
  rownames_to_column("state") %>%
  select(state, Illiteracy)

# Note: direction = 1 switches the order of the fill scale
# so darker shades represent higher illiteracy rates
# (The default is -1).

statebins(df_illit, value_col="Illiteracy",
          name = "%", direction = 1) +
  ggtitle("State Illiteracy Rates, 1977") +
  theme_statebins()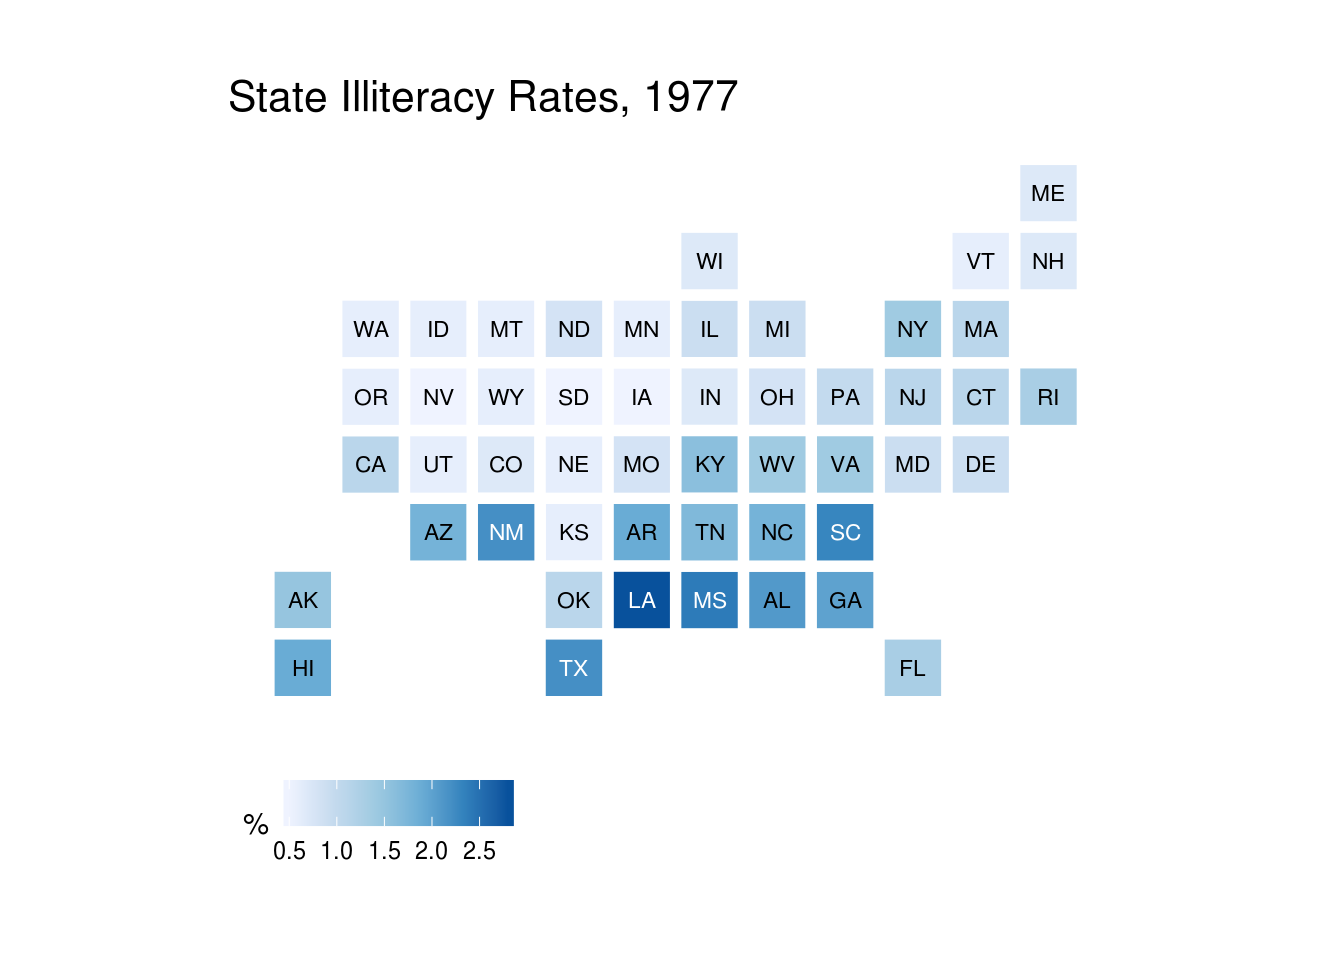
17.3 Longitude / Latitude data
Note that the options above work with political boundaries, based on the names of the regions that you provide. If you have longitude / latitude data, ggmap is a good choice. It is straight-forward to plot lon/lat data on a Cartestian coordinate system, with the x-axis representation longitude and the y-axis latitude – just be careful not to mix them up. The ggmap package provides a variety of maps that can serve as the backdrop for the long/lat points.
ggmap offers a number of different map sources. Google Maps API was the go-to, but they now require you to enable billing through Google Cloud Platorm. You get $300 in free credit, but if providing a credit card isn’t your thing, you may consider using Stamen Maps instead, with the get_stamenmap() function. Use the development version of the package; instructions and extensive examples are available on the package’s GitHub page.
17.4 Resources
“Getting started Stamen maps with ggmap” – A short tutorial on using ggmap with Stamen maps using the Sacramento dataset in the caret package.
with