21 Stock data with tidyquant
 This chapter originated as a community contribution created by naotominakawa
This page is a work in progress. We appreciate any input you may have. If you would like to help improve this page, consider contributing to our repo.
21.1 Overview
This section covers how to use the tidyquant package to conduct timeseries analysis.
21.2 What is tidyquant?
tidyquant is an one-stop shop for financial analysis. It is suitable for analyzing timeseries data, such as financial and economic data. tidyquant connects to various data sources such as Yahoo! Finance, Morning Star, Bloomberg market data, etc. It also behaves well with other Tidyverse packages.
21.3 Installing tidyquant
To install tidyquant, you can run the following code:
# install.packages("tidyquant")
library(tidyquant)
If you want to see which functions are available, you can run the following:
# to see which functions are available (not run)
tq_transmute_fun_options()
21.4 Single timeseries
Obtain historical data for single stock (for example, Google):
# get historical data for single stock. e.g. google
tq_get("GOOGL", get="stock.prices")
## # A tibble: 2,565 x 7
## date open high low close volume adjusted
## <date> <dbl> <dbl> <dbl> <dbl> <dbl> <dbl>
## 1 2009-01-02 154. 161. 153. 161. 7213700 161.
## 2 2009-01-05 161. 166. 158. 164. 9768200 164.
## 3 2009-01-06 167. 171. 163. 167. 12837500 167.
## 4 2009-01-07 164. 166. 160. 161. 8980000 161.
## 5 2009-01-08 159. 163. 159. 163. 7194100 163.
## 6 2009-01-09 164. 164. 157. 158. 8672300 158.
## 7 2009-01-12 158. 160. 155. 157. 6601900 157.
## 8 2009-01-13 156. 160. 155. 157. 8856100 157.
## 9 2009-01-14 155. 157. 149. 151. 10924800 151.
## 10 2009-01-15 149. 152. 144. 150. 11857100 150.
## # … with 2,555 more rowsCalculate monthly return of single stock:
# calculate monthly return of single stock
tq_get(c("GOOGL"), get="stock.prices") %>%
  tq_transmute(select=adjusted,
               mutate_fun=periodReturn,
               period="monthly",
               col_rename = "monthly_return")
## # A tibble: 123 x 2
## date monthly_return
## <date> <dbl>
## 1 2009-01-30 0.0536
## 2 2009-02-27 -0.00160
## 3 2009-03-31 0.0298
## 4 2009-04-30 0.138
## 5 2009-05-29 0.0537
## 6 2009-06-30 0.0104
## 7 2009-07-31 0.0509
## 8 2009-08-31 0.0420
## 9 2009-09-30 0.0740
## 10 2009-10-30 0.0812
## # … with 113 more rowsCreate a line chart of the closing price for single stock:
# showing closing price for single stock
tq_get(c("GOOGL"), get="stock.prices") %>%
  ggplot(aes(date, close)) +
  geom_line()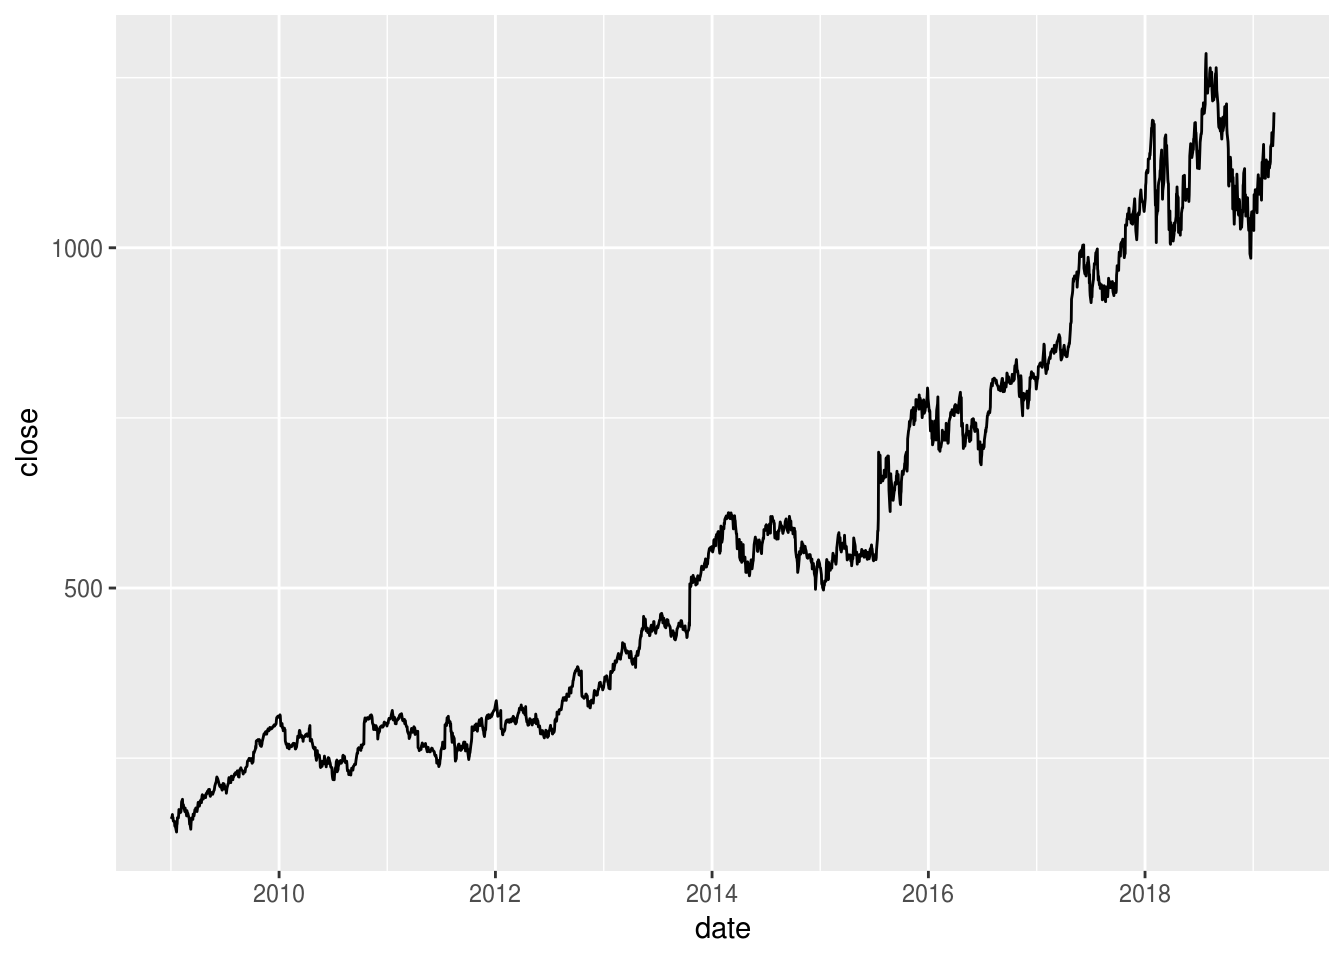
Create a line chart of the monthly return for single stock:
# showing monthly return for single stock
tq_get(c("GOOGL"), get="stock.prices") %>%
  tq_transmute(select=adjusted,
               mutate_fun=periodReturn,
               period="monthly",
               col_rename = "monthly_return") %>%
  ggplot(aes(date, monthly_return)) +
  geom_line()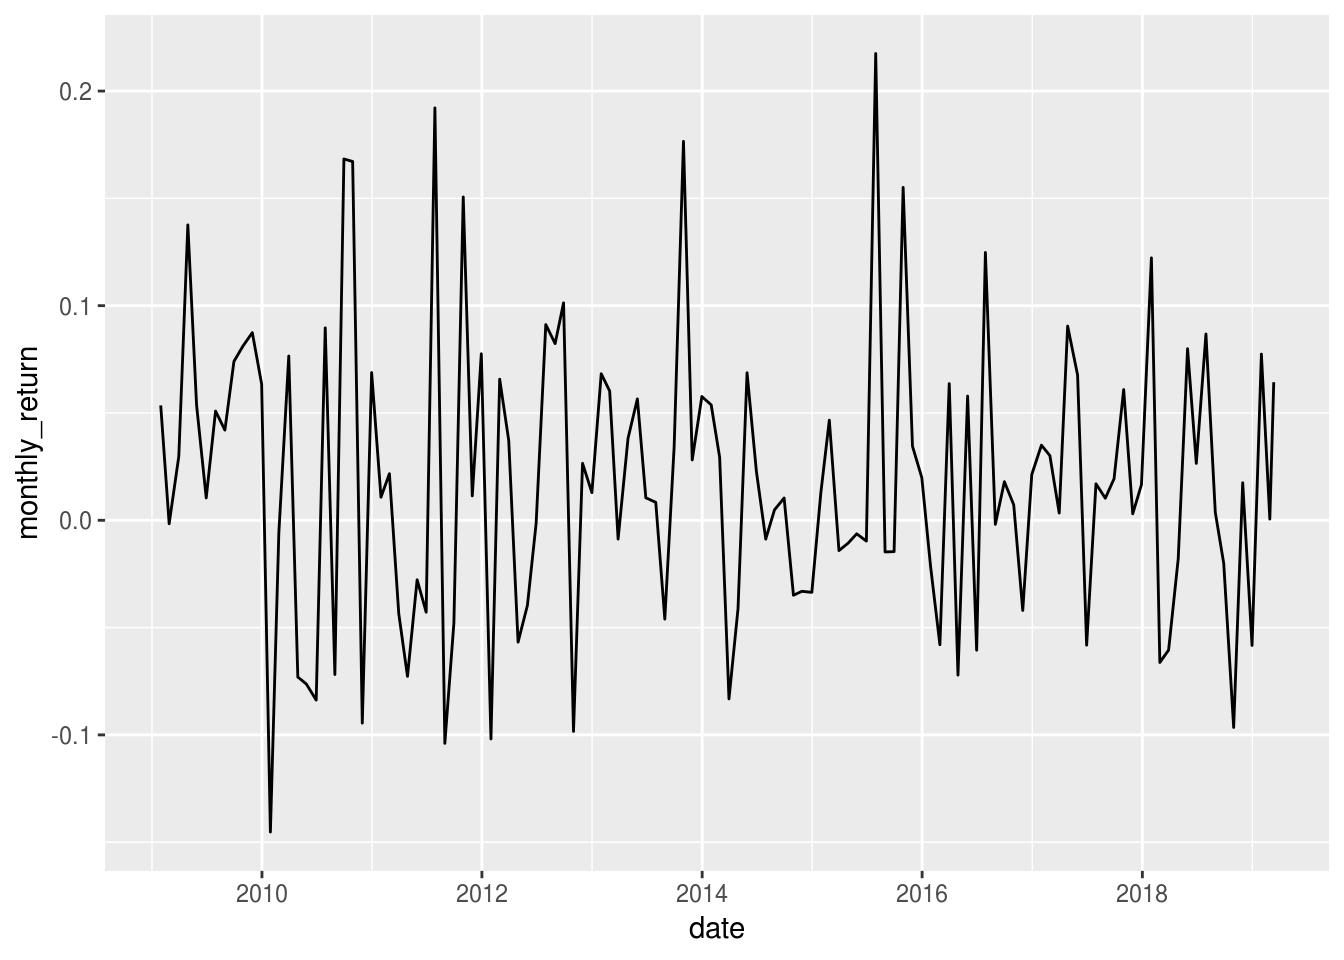
21.5 Multiple timeseries
Obtain historical data for multiple stocks (for example, GAFA):
# get historical data for multiple stocks. e.g. GAFA
tq_get(c("GOOGL","AMZN","FB","AAPL"), get="stock.prices")
## # A tibble: 9,409 x 8
## symbol date open high low close volume adjusted
## <chr> <date> <dbl> <dbl> <dbl> <dbl> <dbl> <dbl>
## 1 GOOGL 2009-01-02 154. 161. 153. 161. 7213700 161.
## 2 GOOGL 2009-01-05 161. 166. 158. 164. 9768200 164.
## 3 GOOGL 2009-01-06 167. 171. 163. 167. 12837500 167.
## 4 GOOGL 2009-01-07 164. 166. 160. 161. 8980000 161.
## 5 GOOGL 2009-01-08 159. 163. 159. 163. 7194100 163.
## 6 GOOGL 2009-01-09 164. 164. 157. 158. 8672300 158.
## 7 GOOGL 2009-01-12 158. 160. 155. 157. 6601900 157.
## 8 GOOGL 2009-01-13 156. 160. 155. 157. 8856100 157.
## 9 GOOGL 2009-01-14 155. 157. 149. 151. 10924800 151.
## 10 GOOGL 2009-01-15 149. 152. 144. 150. 11857100 150.
## # … with 9,399 more rowsCreate a multiple line chart of the closing prices of multiple stocks (again, GAFA). We can show each stock in a different color on the same graph:
# Create a multiple line chart of the closing prices of the four stocks,
# showing each stock in a different color on the same graph.
tq_get(c("GOOGL","AMZN","FB","AAPL"), get="stock.prices") %>%
  ggplot(aes(date, close, color=symbol)) +
  geom_line()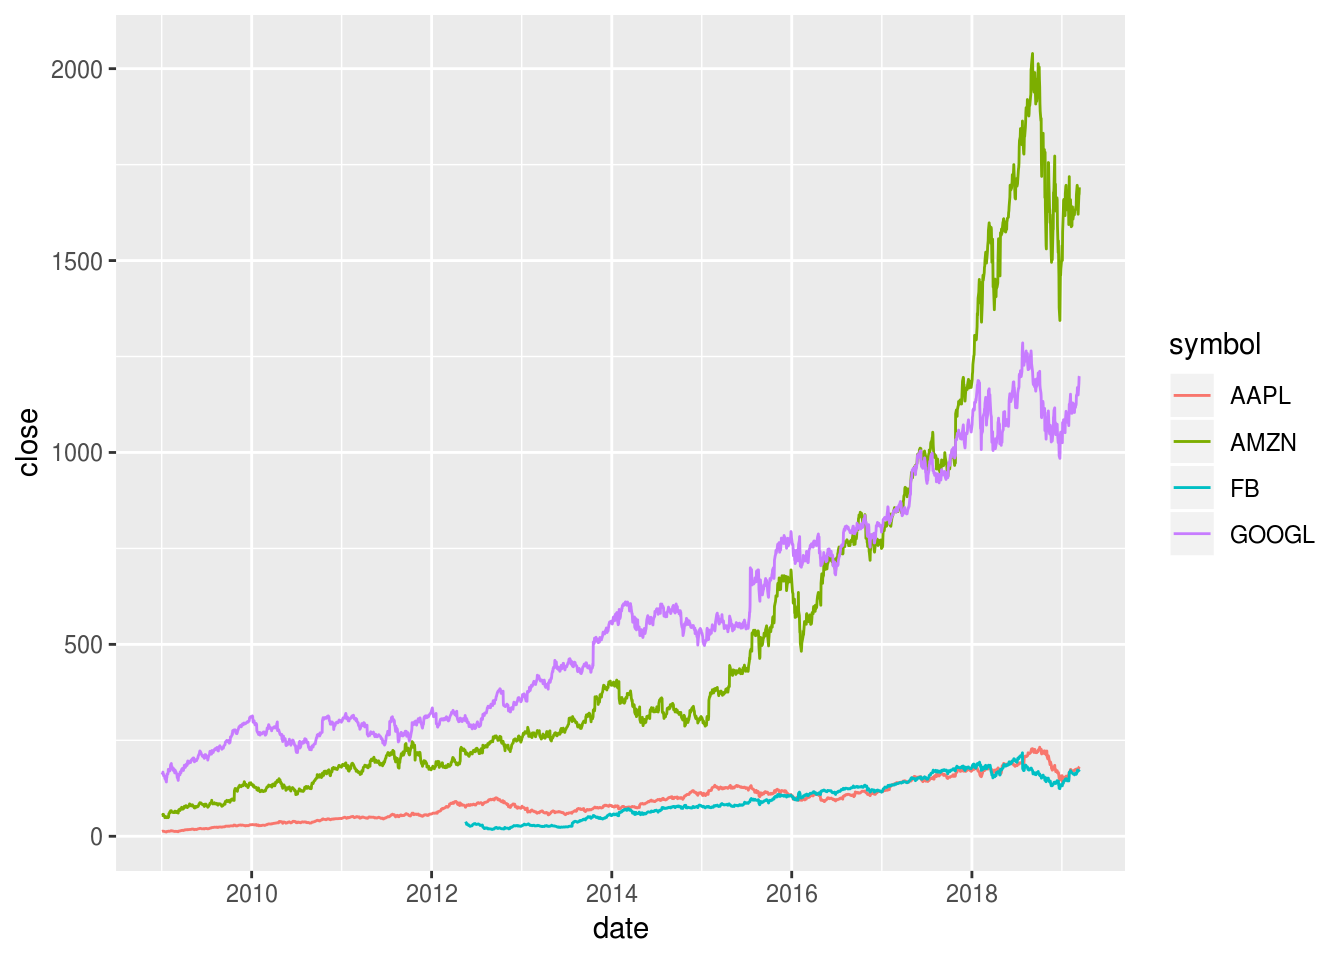
Transform the data so each stock begins at 100 and replot (Standardize the data so that we can compare timeseries):
# Create a multiple line chart of the closing prices of the four stocks,
# showing each stock in a different color on the same graph.
# Transform the data so each stock begins at 100 and replot.
tq_get(c("GOOGL","AMZN","FB","AAPL"), get="stock.prices") %>%
  group_by(symbol) %>%
  mutate(close = 100*close/first(close)) %>%
  ggplot(aes(date, close, color=symbol)) +
  geom_line()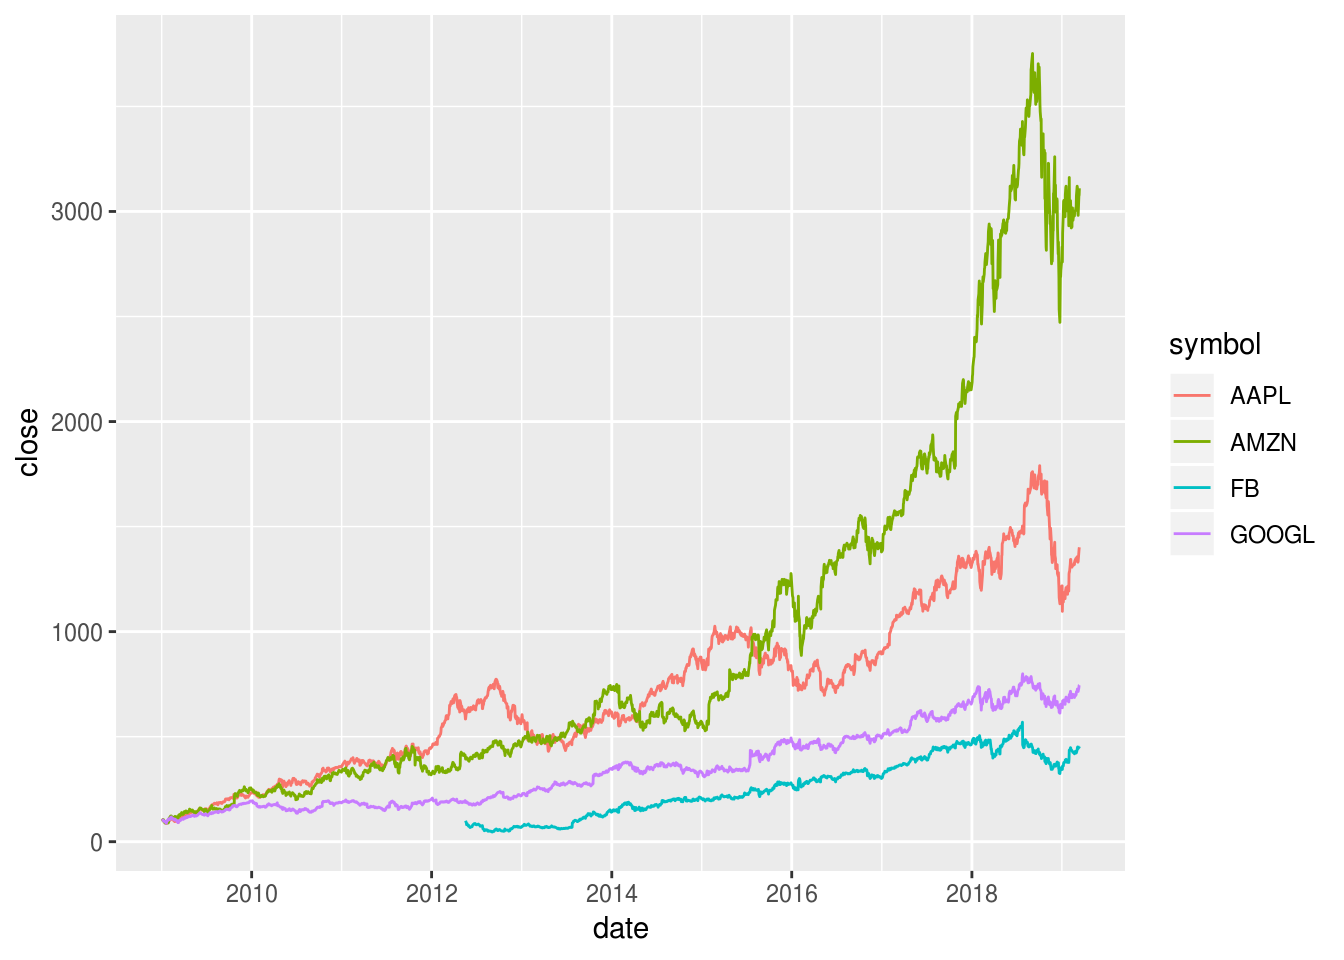
Calculate monthly return of multiple stocks (again, GAFA):
# calculate monthly return of multiple stocks
tq_get(c("GOOGL","AMZN","FB","AAPL"), get="stock.prices") %>%
  group_by(symbol) %>%
  tq_transmute(select=adjusted,
               mutate_fun=periodReturn,
               period="monthly",
               col_rename = "monthly_return")
## # A tibble: 452 x 3
## # Groups: symbol [4]
## symbol date monthly_return
## <chr> <date> <dbl>
## 1 GOOGL 2009-01-30 0.0536
## 2 GOOGL 2009-02-27 -0.00160
## 3 GOOGL 2009-03-31 0.0298
## 4 GOOGL 2009-04-30 0.138
## 5 GOOGL 2009-05-29 0.0537
## 6 GOOGL 2009-06-30 0.0104
## 7 GOOGL 2009-07-31 0.0509
## 8 GOOGL 2009-08-31 0.0420
## 9 GOOGL 2009-09-30 0.0740
## 10 GOOGL 2009-10-30 0.0812
## # … with 442 more rowsCreate a multiple line chart of monthly return of the four stocks. Again, we can show each stock in a different color on the same graph:
# Create a multiple line chart of monthly return of the four stocks,
# showing each stock in a different color on the same graph
tq_get(c("GOOGL","AMZN","FB","AAPL"), get="stock.prices") %>%
  group_by(symbol) %>%
  tq_transmute(select=adjusted,
               mutate_fun=periodReturn,
               period="monthly",
               col_rename = "monthly_return") %>%
  ggplot(aes(date, monthly_return, color=symbol)) +
  geom_line()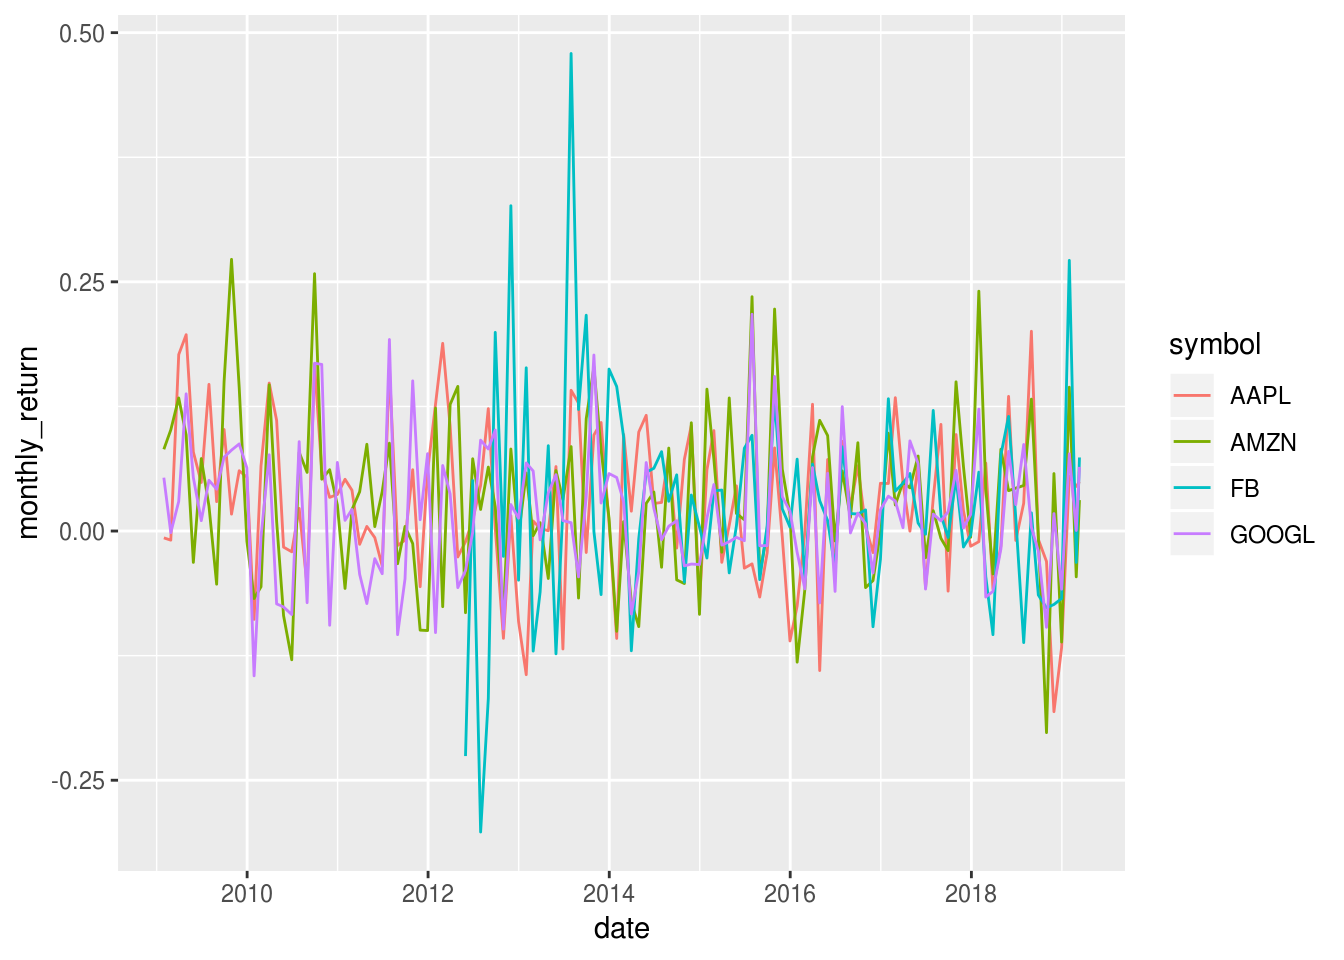
21.6 External Resources
- tidyquant CRAN doc: formal documentation on the package
- tidyquant Github repo: Github repository for the
tidyquantpackage with a great README
with