a_grade <- df |>
filter(GRADE == "A") |>
count(`CUISINE DESCRIPTION`, sort = TRUE) |>
slice(1:10)
b_grade <- df |>
filter(GRADE == "B") |>
count(`CUISINE DESCRIPTION`, sort = TRUE) |>
slice(1:10)
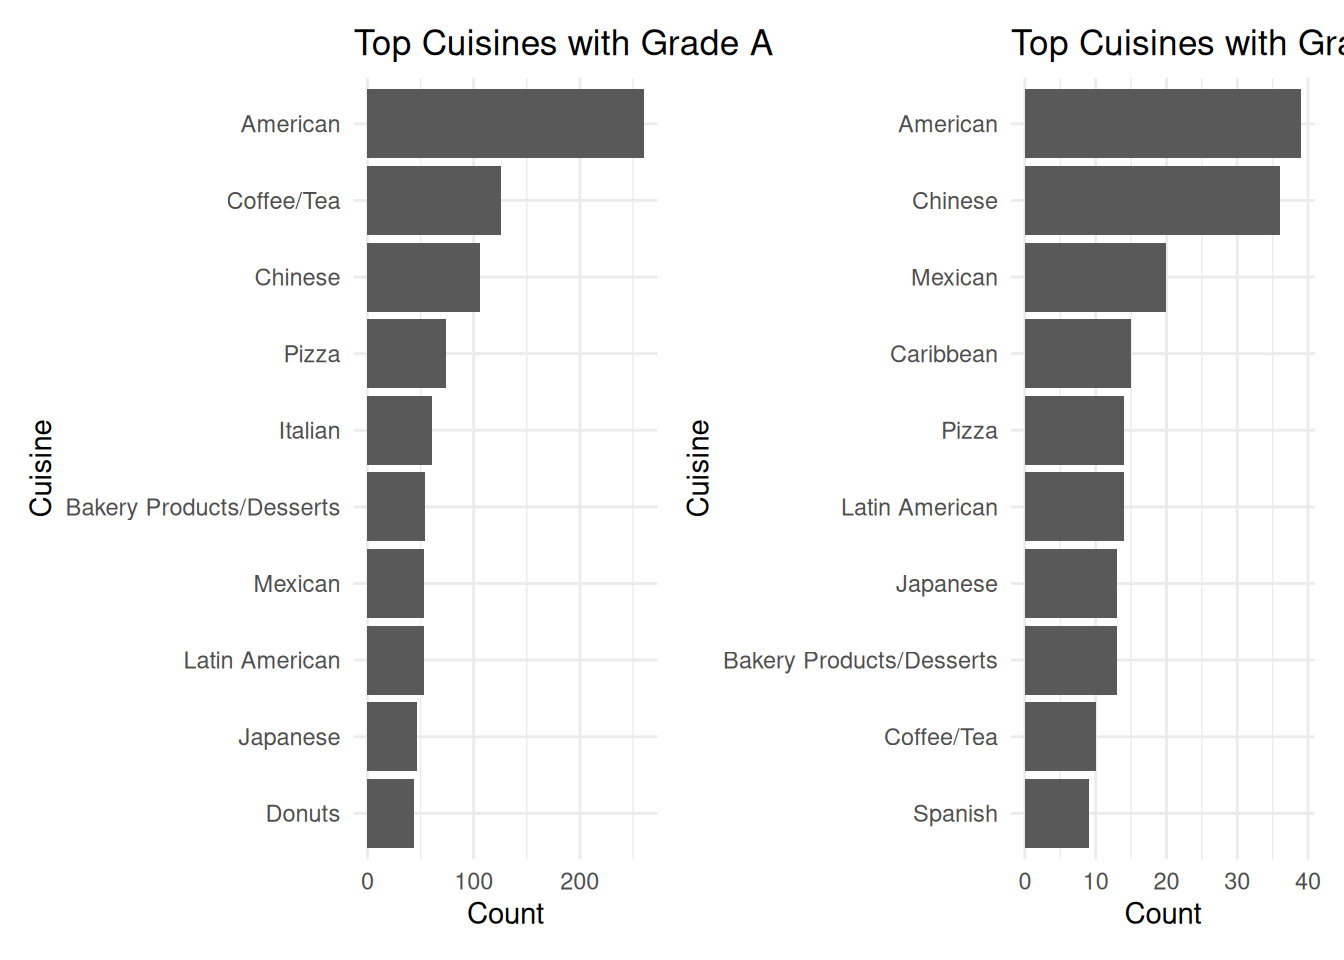
g1 <- ggplot(a_grade, aes(x = n, y = reorder(`CUISINE DESCRIPTION`, n))) +
geom_col() +
labs(
title = "Top Cuisines with Grade A",
x = "Count",
y = "Cuisine"
) +
theme_minimal()
g2 <- ggplot(b_grade, aes(x = n, y = reorder(`CUISINE DESCRIPTION`, n))) +
geom_col() +
labs(
title = "Top Cuisines with Grade B",
x = "Count",
y = "Cuisine"
) +
theme_minimal()
g1 + g2