library(tidyverse)
library(sf)
library(redav)7 2015 Tree Census
Alexander Liu
7.1 Introduction
7.2 Data
7.2.1 Description
7.2.2 Missing Value Analysis
df <- read_csv("data/2015_Tree.rds", show_col_types = FALSE)
# head(df)

# filter only missing values to avoid cluttering
df_missing <- df %>%
  select(where(~ any(is.na(.))))

plot_missing(df_missing, percent = FALSE)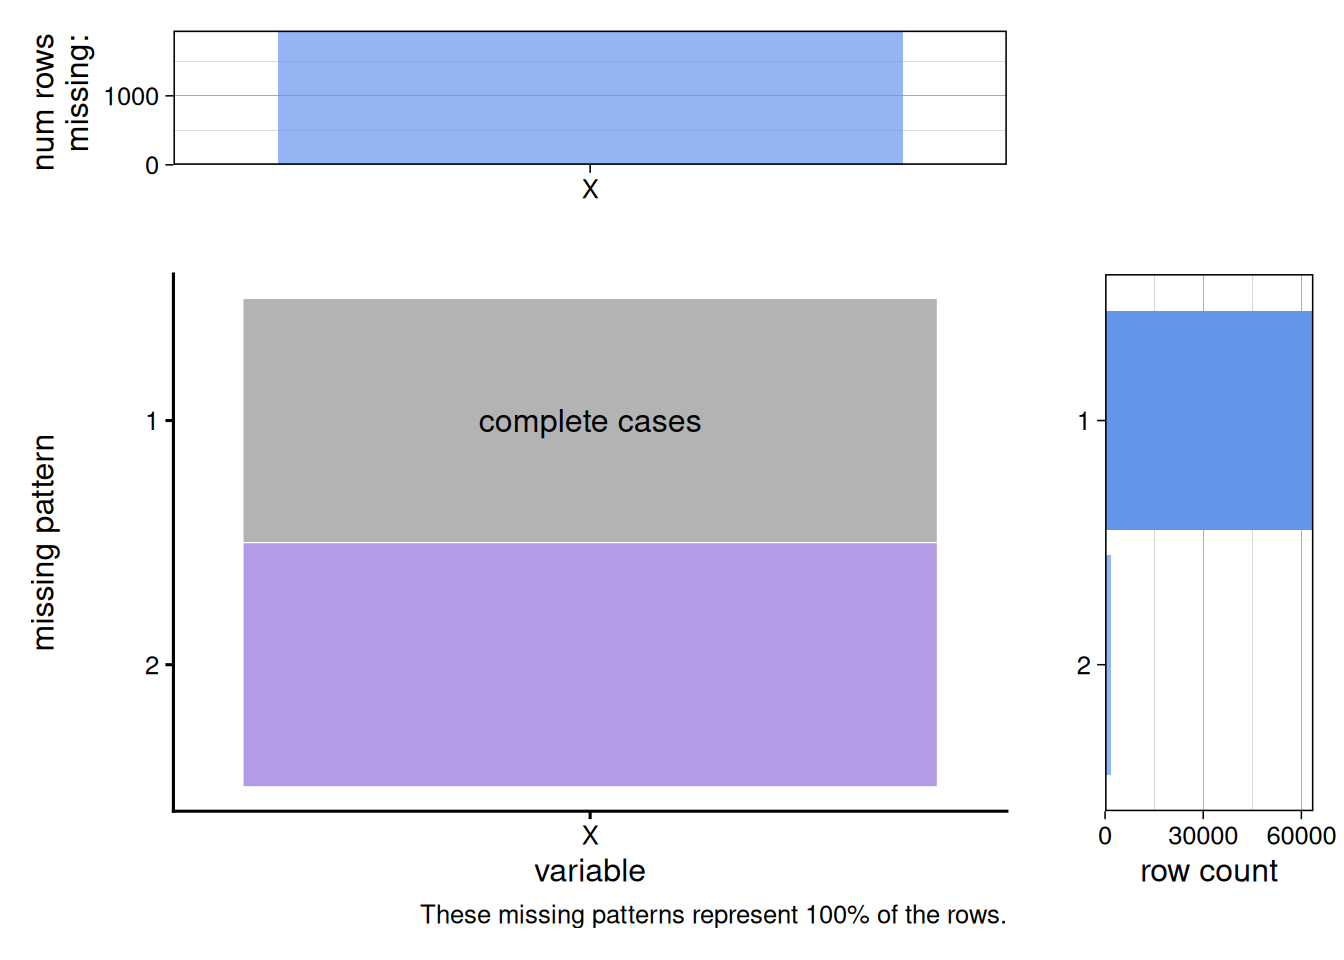
7.3 Results
df %>%
  count(spc_common, sort = TRUE) %>%
  head(15) %>%
  ggplot(aes(x = reorder(spc_common, n), y = n)) +
  geom_col() +
  coord_flip()
Error in `count()`:
! Must group by variables found in `.data`.
✖ Column `spc_common` is not found.boroughs <- read_sf("data/nyc_boroughs/nybb.shp")
top9_species <- df %>%
count(spc_common, sort = TRUE) %>%
slice_head(n = 9) %>%
pull(spc_common)Error in `count()`:
! Must group by variables found in `.data`.
✖ Column `spc_common` is not found.points_sf <- df %>%
filter(spc_common %in% top9_species) %>%
select(longitude, latitude, spc_common) %>%
na.omit() %>%
st_as_sf(coords = c("longitude", "latitude"), crs = 4326)Error in `filter()`:
ℹ In argument: `spc_common %in% top9_species`.
Caused by error:
! object 'spc_common' not foundggplot() +
geom_sf(data = boroughs) +
geom_sf(data = points_sf, size = 0.1) +
facet_wrap(~ spc_common) +
theme_minimal() +
labs(title = "Top 9 Tree Species by Location")Error:
! object 'points_sf' not foundboroughs <- read_sf("data/nyc_boroughs/nybb.shp")
top3_species <- df %>%
count(spc_common, sort = TRUE) %>%
slice_head(n = 3) %>%
pull(spc_common)Error in `count()`:
! Must group by variables found in `.data`.
✖ Column `spc_common` is not found.points_sf <- df %>%
filter(spc_common %in% top3_species) %>%
select(longitude, latitude, spc_common) %>%
na.omit() %>%
st_as_sf(coords = c("longitude", "latitude"), crs = 4326)Error in `filter()`:
ℹ In argument: `spc_common %in% top3_species`.
Caused by error:
! object 'spc_common' not foundggplot() +
geom_sf(data = boroughs) +
geom_sf(data = points_sf, aes(color = spc_common),
size = 0.1) +
theme_minimal() +
labs(title = "Top 3 Tree Species by Location")Error:
! object 'points_sf' not foundpoints_sf <- df %>%
filter(spc_common == "red maple") %>%
select(longitude, latitude) %>%
drop_na() %>%
st_as_sf(coords = c("longitude", "latitude"), crs = 4326)Error in `filter()`:
ℹ In argument: `spc_common == "red maple"`.
Caused by error:
! object 'spc_common' not foundggplot() +
geom_sf(data = boroughs) +
geom_sf(data = points_sf, size = 0.1) +
theme_minimal() +
labs(title = "Red Maple Trees in NYC")Error:
! object 'points_sf' not foundtop15_species <- df %>%
group_by(spc_common) %>%
summarise(avg_dbh = mean(tree_dbh, na.rm = TRUE),
n = n()) %>%
filter(n >= 50) %>%
slice_head(n = 15)Error in `group_by()`:
! Must group by variables found in `.data`.
✖ Column `spc_common` is not found.ggplot(top15_species, aes(x = fct_reorder(spc_common, avg_dbh),
y = avg_dbh)) +
geom_col(fill = "brown") +
coord_flip() +
theme_minimal() +
labs(title = "Top 15 Tree Species by Average Diameter",
x = "Species",
y = "Average Diameter (DBH)")Error:
! object 'top15_species' not found