Chapter 57 Absentee ballot voting in 2020 presidental election
Shengyuan Cao
57.1 Background and Research Idea
The right to vote is one of the most important rights in today’s world. Elections provide individuals the ability to influence the politics that govern their lives, and everyone should have an equal opportunity to participate in the voting system. Without a standardized voting process, voting is unequal among individuals and people will start to lose trust in the political system.
To help promote voting equality across the country, especially in Georgia, I want to investigate if there were any potential patterns related to unequal voting. Absentee ballot serve as an important way for voters who cannot physically vote at voting centers on election days. And it is more prevalent during coronavirus times. Therefore, it is evident that absentee ballots play a considerable role in America’s election process. Our main goal is to try and assess absentee ballot equality based on recent election data, which would have many useful applications, such as to provide useful guide on how absentee ballots will be utilized in future elections.
The following research will provide insights into which Georgia counties reject absentee ballots, and why they were rejected in 2020 Presidential election. Data comes from open data source at https://elections.sos.ga.gov/Elections/voterabsenteefile.do
In this research, I explore reasons why some absentee ballots were rejected during 2020 Presidential election in Georgia. This topic is to my interest since voting through absentee ballot becomes the trend during pandemic times. And it is very important to protect voting rights and promote voting equlity through absentee ballot. First, I find top reasons for ballot rejection in each county to gain a general idea of rejection reasons, then I group all rejection reasons into 16 main categories using keyword pattern matching method to identify top rejection reasons across Georgia. Besides, I calculate non-accepted ballot rates and absentee ballot participation rate in each county and show these values on a Georgia map.
57.2 Analyze ballot rejection data
Below are 2020 Presidential Absentee ballot data. First, we load the data and unzip it.
downloader::download("https://github.com/Isabellatop/5702CCdata/raw/main/statewide_small.csv.zip",
                     "statewide_small.csv.zip")
statewide_small <- read.csv(unz("statewide_small.csv.zip", "statewide_small.csv"), header = TRUE, sep = ",")
Application_Status is “A” means that the absentee ballot application is “Accepted”. Since we are interested in why some absentee ballots were rejected, we want the ballot status where it is “R”,“C” or “S”, which means “Rejected”, “Cancelled” or “Spoiled” respectively. The “Status_Reason” column shows why the ballot is not accepted.
CRS2020<-statewide_small %>% filter(Ballot_Status =="R"|Ballot_Status =="C"|Ballot_Status =="S")
head(CRS2020,15) # Show first 15 rows
## X County Application_Status Ballot_Status
## 1 2 APPLING A C
## 2 3 APPLING A C
## 3 10 APPLING A C
## 4 13 APPLING A C
## 5 14 APPLING A C
## 6 23 APPLING A C
## 7 94 APPLING A C
## 8 96 APPLING A C
## 9 171 APPLING A C
## 10 174 APPLING A C
## 11 180 APPLING A C
## 12 216 APPLING A C
## 13 228 APPLING A C
## 14 242 APPLING A C
## 15 244 APPLING A C
## Status_Reason
## 1 mailed ballot surrendered to vote in-person
## 2 voter turned in ballot at the polls
## 3 mailed ballot surrendered to vote in-person
## 4 voter requested
## 5 mailed ballot surrendered to vote in-person
## 6 mailed ballot surrendered to vote in-person
## 7 voter turned in ballot at the polls
## 8 ballot was undelivered
## 9 voter requested
## 10 mailed ballot surrendered to vote in-person
## 11 voter requested
## 12 voter requested
## 13 mailed ballot surrendered to vote in-person
## 14 ballot was undelivered
## 15 ballot was undeliveredWe can get a sense of why ballots were rejected by finding the top one non-accepting reason for each county in Georgia.
Top_reason_for_each_county <- CRS2020 %>% group_by(County,Status_Reason) %>% summarise(Total_Number=n()) %>% top_n(1,Total_Number)
Top_reason_for_each_county
## # A tibble: 159 × 3
## # Groups: County [159]
## County Status_Reason Total_Number
## <chr> <chr> <int>
## 1 APPLING voter requested 258
## 2 ATKINSON mailed ballot surrendered to vote in-person 126
## 3 BACON mailed ballot surrendered to vote in-person 184
## 4 BAKER ballot was undelivered 30
## 5 BALDWIN voter requested 1062
## 6 BANKS voter requested 199
## 7 BARROW vip 1788
## 8 BARTOW mailed ballot surrendered to vote in-person 1049
## 9 BEN HILL voter requested 272
## 10 BERRIEN mailed ballot surrendered to vote in-person 430
## # … with 149 more rowsThere are 159 counties in Georgia State. I want to know whar are the most common rejection reason among all counties. We observed that vast majority counties have top rejecting reasons as “mailed ballot surrendered to vote in-person”, “voter requested”, “ballot was undelivered” and “ballot was undelivered”, which is an interesting and critical observation.
Top_reason_for_each_county_new <- Top_reason_for_each_county %>% group_by(Status_Reason) %>% summarise(Total_Number=n()) %>% arrange(desc(Total_Number))
Top_reason_for_each_county_new
## # A tibble: 20 × 2
## Status_Reason Total_Number
## <chr> <int>
## 1 "mailed ballot surrendered to vote in-person" 67
## 2 "voter requested" 33
## 3 "voter turned in ballot at the polls" 16
## 4 "ballot was undelivered" 13
## 5 "voted in person" 9
## 6 "vio" 4
## 7 "vip" 3
## 8 "affidavit" 2
## 9 "administrative cancellation" 1
## 10 "aff" 1
## 11 "cancelled voted aip" 1
## 12 "early voted" 1
## 13 "lost it" 1
## 14 "signed affidavit" 1
## 15 "vip aff signed" 1
## 16 "voted aip" 1
## 17 "voted early" 1
## 18 "voted in office" 1
## 19 "voted in person/signed " 1
## 20 "voted on bmd" 1This plot gives us a general idea about ballot rejection reasons, which helps further detailed investigation.
ggplot(Top_reason_for_each_county_new,aes(fct_reorder(Status_Reason,Total_Number),Total_Number))+
  geom_col() +
 coord_flip() +
  xlab("Ballot rejection reason") +
  ylab("Total count") +
  ggtitle("Distribution of top 1 ballot rejection reason in each of 159 \ncounties in Georgia")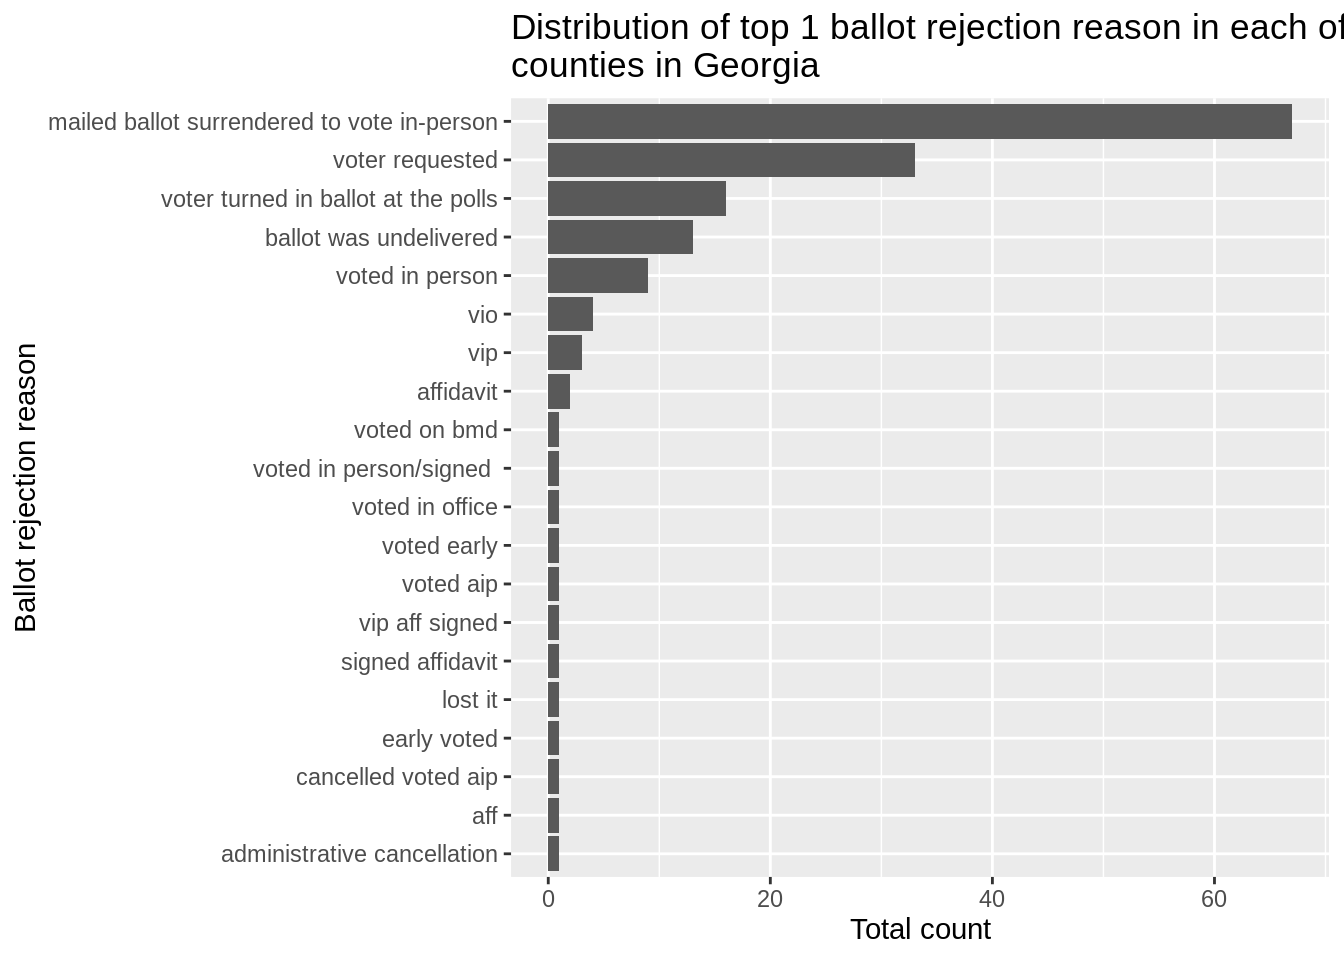
57.3 Categorize 16 main ballot rejection reasons
There are 5735 unqiue reasons out of all 343,887 observations as to why the ballot is not accepted. Since there are too many unique reasons and the reasons are messy, I will categorize the reasons for rejection by grouping them using key words to find out what are those non-accepting reasons and their distribution.
## [1] 343887## [1] 5735We want to find ballot rejection reason related to the category “vote early”, which includes keywords early, pol(poll), person(in person), aip (means absentee in person), and vip (means voted in person). We use grep function for pattern matching and find there are 183,981 cases for errors about early voting.
When looking at all the unique ballot rejection reason in this category as showed below, we observe many reasons actally meant the same thing even though they were worded differently. And many reasons had typos in them. It is very likely that reasons for rejecting ballots were not strictly standardized in Georgia, which is an area that could be improved in future absentee ballot voting.
early_related <- c('early','pol','person','aip','vip')
(Total_early<- length(grep(paste(early_related,collapse="|"),status_reason)))
## [1] 183981Similarly, we find how many ballots were rejected due to “Address related issues”, which includes keywords add (address), county and location. We see that there were 2603 ballots rejected because of address related problems and unique address related reasons were listed below.
address_related <- c('add','county','location')

Total_address <- length(grep(paste(address_related,collapse="|"),status_reason))
Total_address
## [1] 2603The third category is “Date related issues”, which includes keywords dob, birth and date. In total there are 188 counts.
date_related <- c('birth','dob','date')

Total_date <- length(grep(paste(date_related,collapse="|"),status_reason,value=TRUE))
Total_date
## [1] 188The fourth category is “Signature issue”, which contains keyword “sign” (include signed and signature). There are 3612 many of them.
## [1] 3612The fifth category is “Dead issue”, which contains keyword died, deceased and passed. There are 223 counts.
dead_related <- c('die','deceased','passed')

Total_dead <- length(grep(paste(dead_related,collapse="|"),status_reason,value=TRUE))
Total_dead
## [1] 227The sixth group is about “Delivery issue”, which has keywords undeliver. We observe that there are 49,448 counts, which is a large component of rejected ballots. Most reasons are related to ballots were not delivered.
deliver_related <- c('undeliver')

unique(grep(paste(deliver_related,collapse="|"),status_reason,value=TRUE))
## [1] "ballot was undelivered"
## [2] "undelivered. voted in person."
## [3] "ballot returned - undeliverable"
## [4] "returned as undeliverable"
## [5] "returned undeliverable"
## [6] "voter signed affidavit missing/undelivered "
## [7] "undeliverable"
## [8] "undeliverable - mailing to temp "
## [9] "undelivered"
## [10] "canc undeliverable - will fill out another "
## [11] "undeliverable - moc"
## [12] "ret'd undeliverable"
## [13] "ballot undelivered"
## [14] "undelivered- voting in person"
## [15] "undelivered- vip"
## [16] "voted in person; ballot undelivered"
## [17] "ballot undelivered/voted in "
## [18] "ballot was undeliveredd"
## [19] "ret. undeliverable temp away"
## [20] "ballot undelivered sent to wrong state "
## [21] "ballot was undelivered. voted in "
## [22] "ballot undelivered. voted in person"
## [23] "ballot was undelivered.voted in "
## [24] "ballot was undelivered from the "
## [25] "original ballot was undelivered from "
## [26] "ballot was undelivered and voter "
## [27] "ballot was undelivered from "
## [28] "ballot undelivered.voted in person"
## [29] "ballot undelivered via email"
## [30] "opt to vote in person ballot undelivered"
## [31] "ballot was undelivered. voted at "
## [32] "ballot undelivered voted in person"
## [33] "application was undelivered"
## [34] "returned usps undeliverable"
## [35] "returned undeliverable, phone "
## [36] "ballot returned undeliverable"
## [37] "returned undelivered"
## [38] "return undeliverable"
## [39] "undelivered;re-issue per state"
## [40] "9/18/20 ballot undelivered"
## [41] "ballot undelivered and vote in person"Total_deliver <- length(grep(paste(deliver_related,collapse="|"),status_reason,value=TRUE))
Total_deliver## [1] 49448The seventh group is about “Person lost ballot issue”, which contain keyword lost,destroy (include destroyed). Most reasons are that ballots were lost or destroyed. There are 5722 many of those.
lost_related <- c('lost','destroy')
(Total_lost <- length(grep(paste(lost_related,collapse="|"),status_reason)))
## [1] 5722The eighth category is related to “Admin error”, which has keywords admin(include administrative), office, vio (voted in office). We find there are as many as 16,562 counts, which is also a relatively large chunk of all rejected ballots.
admin_related <- c('admin','office','vio')
(Total_admin <- length(grep(paste(admin_related,collapse="|"),status_reason)))
## [1] 16562The ninth category is about “Name error”, which has keyword name. There are 16 in total.
## [1] 16The 10th category is about “Reissued error”. Keywords include reissue and re-issued. When looking at specific reasons, many of those are “spoiled - reissue” and “rejected ballot that has been re-issued”. There are 2024 counts.
reissue_related <- c('reissue','re-issue')

(Total_reissue <- length(grep(paste(reissue_related,collapse="|"),status_reason)))
## [1] 2024The 11th category is about “Receiving error”. Keywords are received/rcvd/late/deadline/after/arrived and there are 3863 of them.
receive_related <- c('received','rcvd','late','deadline','after','arrived','returned','envelope')

(Total_receive <- length(grep(paste(receive_related,collapse="|"),status_reason)))
## [1] 3863The 12th category is about “Voter request”, which includes keyword request and cancel. There are 62,816 of them. Majority reason includes that voter requested to cancel ballot or requested to vote at the poll instead.
request_related <- c('request','cancel')

(Total_request <- length(grep(paste(request_related,collapse="|"),status_reason)))
## [1] 62816The 13th category is about “Affidavit issue”, which includes keyword aff (includes affidavit). There are 6898 of them.
## [1] 6898The 14th category is about “Multiple ballots/applications”, which includes keyword multiple. There are 93 of them.
## [1] 93The 15th category is about “Insufficient/missing information”, which has keywords insufficient, missing and there are 14 counts.
insufficient_information_related <- c('insufficient',' missing')

(Total_insufficient_information <- length(grep(paste(insufficient_information_related,collapse="|"),status_reason)))
## [1] 14The 16th category is “Ineligible voter”, which has keyword ineligible and has 16 counts.
## [1] "ineligible elector"## [1] 16Now we create a dataset with all the identified ballot rejection reasons with their counts to see what are the most promininet reasons that cause ballot to be rejected.
Reasons <- c('Early voting error','Address error','Date error','Signature error','Voter dead','Ballot undelivered error','Lost ballot','Administration error','Name error','Reissued error','Receiving error','Voter request to cancel ballot','Affidavit error','Multiple ballots error','Missing information','Ineligible voter')

value_counts <- c(Total_early,Total_address,Total_date,Total_sign,Total_dead,Total_deliver,Total_lost,Total_admin,Total_name,Total_reissue,Total_receive,Total_request,Total_aff,Total_multiple, Total_insufficient_information,Total_ineligible)

df <- data.frame(Reasons, value_counts)
df
## Reasons value_counts
## 1 Early voting error 183981
## 2 Address error 2603
## 3 Date error 188
## 4 Signature error 3612
## 5 Voter dead 227
## 6 Ballot undelivered error 49448
## 7 Lost ballot 5722
## 8 Administration error 16562
## 9 Name error 16
## 10 Reissued error 2024
## 11 Receiving error 3863
## 12 Voter request to cancel ballot 62816
## 13 Affidavit error 6898
## 14 Multiple ballots error 93
## 15 Missing information 14
## 16 Ineligible voter 16We observe that the top three reasons for a ballot to be rejected are related to errors about early voting, voter request to cancel ballot and ballot undelivered error. These three reasons count for the vast majority of all the identified reasons.
ggplot(df,aes(fct_reorder(Reasons,value_counts),value_counts))+
  geom_col() +
 coord_flip() +
  xlab("Ballot rejection reason") +
  ylab("Total count") +
  ggtitle("Absentee ballot rejection reason in Georgia")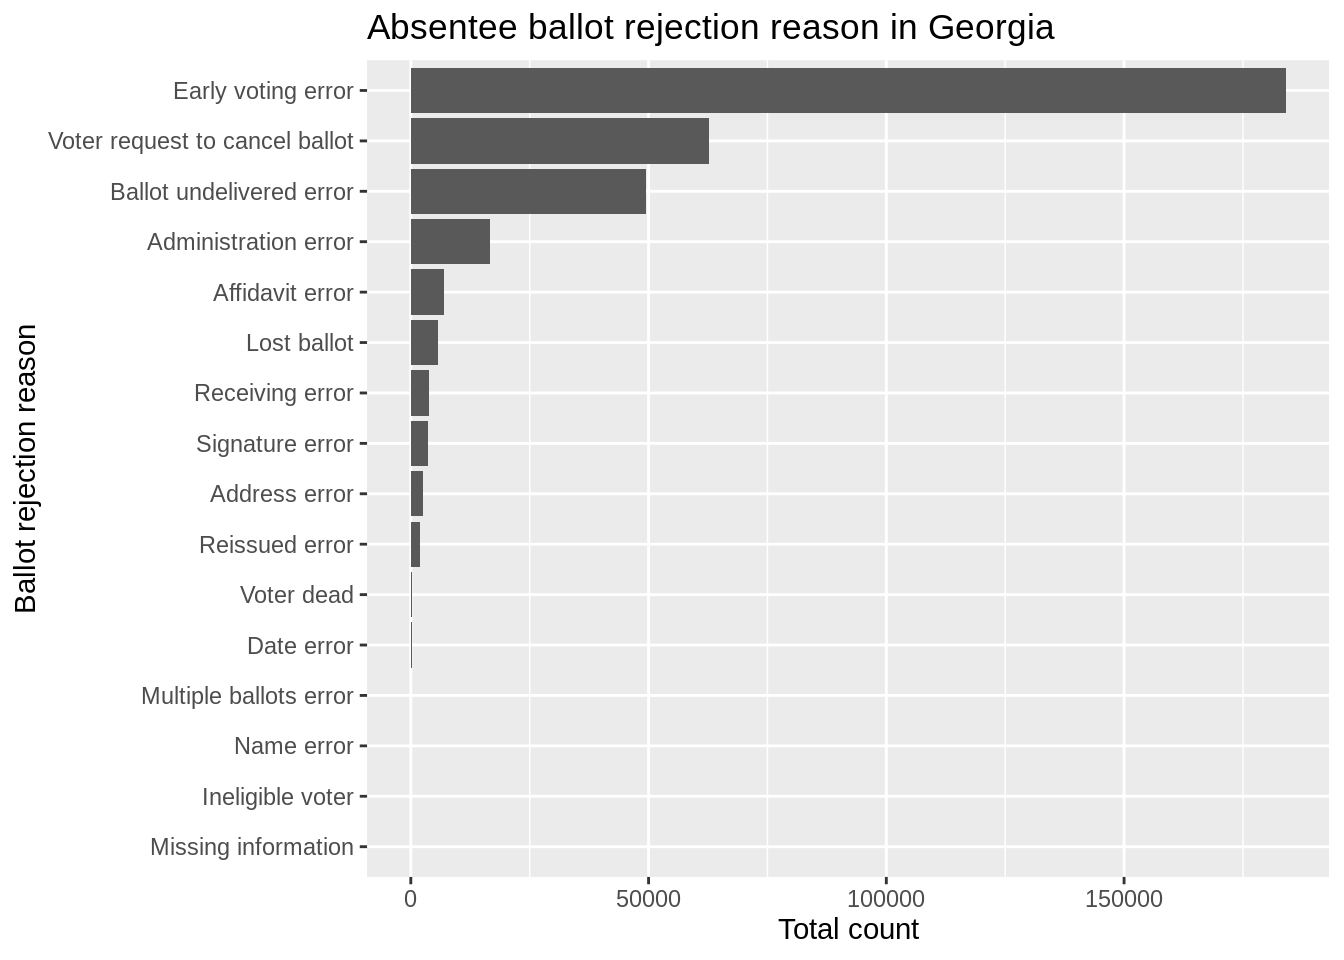
Then, we want to find ballot non-accepted rate for each county in Georgia and make observations about which counties have the highest non-accepted rates. We calculate non-accepted rate by dividing the number of R,C,S (which ballot status is rejected, cancelled and spoiled ballots) by the total number of ballots with status R,C,S,A (A means accepted) for each county. We find that counties with the highest ballot non-accepting are Baldwin, Greene and Dougherty, which are all above 10%!
We also compute the total absentee ballot number by adding all non-accepted ballot_status ballots (R,C,S,A) for each county.
(Not_accepted_percent_state <- statewide_small %>% group_by(County) %>% summarise(Not_accepted_percent_state=100*sum(Ballot_Status =="R"|Ballot_Status =="C"|Ballot_Status =="S")/sum(Ballot_Status =="R"|Ballot_Status =="C"|Ballot_Status =="S"|Ballot_Status =="A" ), Total_absentee_number=sum(Ballot_Status =="R"|Ballot_Status =="C"|Ballot_Status =="S"|Ballot_Status =="A" ))) %>% arrange(desc(Not_accepted_percent_state))## # A tibble: 159 × 3
## County Not_accepted_percent_state Total_absentee_number
## <chr> <dbl> <int>
## 1 BALDWIN 11.1 16692
## 2 GREENE 11.0 11068
## 3 DOUGHERTY 10.9 26300
## 4 SUMTER 10.4 10603
## 5 DEKALB 10.1 359975
## 6 FULTON 9.93 507773
## 7 TALBOT 9.76 2756
## 8 GRADY 9.74 8902
## 9 HANCOCK 9.73 3597
## 10 JENKINS 9.64 2843
## # … with 149 more rows57.4 Show participation rate and ballot non-accepted rate on a Georgia map
Now import GA population data for each county and join it with our ballot data. We can compute the absentee ballot participation rate by dividing total absentee ballot number in each county by population in each county as a way to standardize data since we don’t want to favor our analysis towards counties with high population.
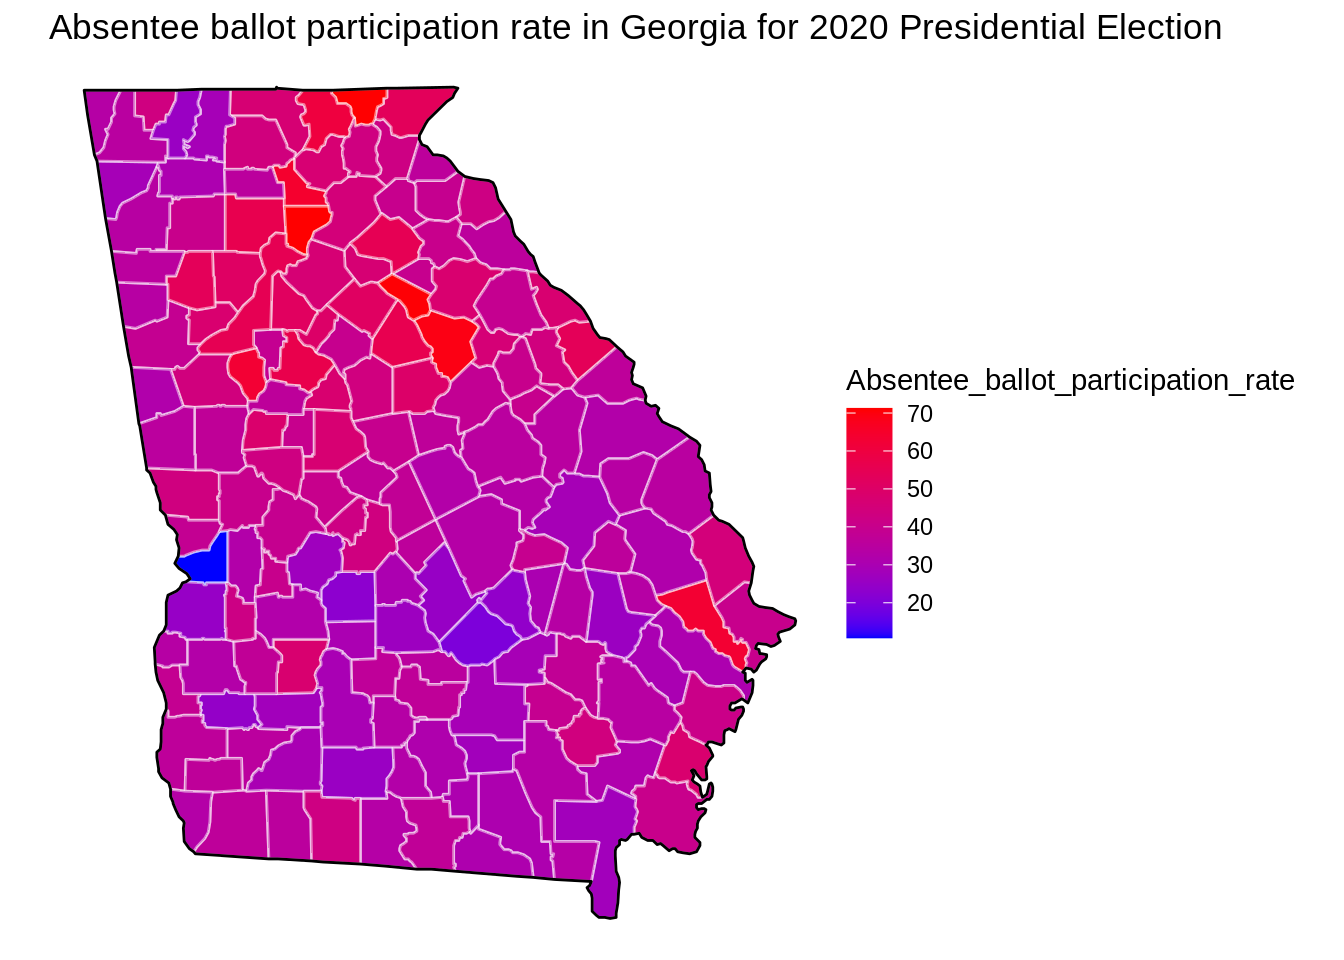
We find out overall, absentee ballot participation rate is high in 2020 presidental election in vast majority of counties in Georgia. This is not surprising given the pandemic was going on then and people preferred to vote through absentee ballot. The top three parcipation counties are Forsyth, Towns and Oconee, which were all above 70%. This again stress the importance of all kinds of ballot related issues and ways to solve them in order to improve the voting quality.
Import population data in Georgia.
GA_population <- read.csv("https://raw.githubusercontent.com/Isabellatop/5702CCdata/main/GAdat.csv")
GA_population$County <- tolower(GA_population$County)
Then, join GA county population data with county ballot data by the keyword “County” and compute absentee ballot participation rate.
population_and_satewide <- inner_join(GA_population, Not_accepted_percent_state, by="County")

population_and_satewide <- population_and_satewide %>% mutate(Absentee_ballot_participation_rate=100*Total_absentee_number/Population) %>%
  arrange(desc(Absentee_ballot_participation_rate))

head(population_and_satewide,15)
## County Population Not_accepted_percent_state Total_absentee_number
## 1 forsyth 175511 7.047288 125041
## 2 towns 10471 7.731544 7450
## 3 oconee 32808 5.917593 23202
## 4 greene 15994 10.995663 11068
## 5 dawson 22330 6.214335 14370
## 6 bryan 30233 7.339305 19089
## 7 fayette 106567 7.891644 67223
## 8 union 21356 7.948817 12895
## 9 henry 203922 8.279256 116037
## 10 cherokee 214346 5.738003 120826
## 11 morgan 17868 6.933360 10024
## 12 fulton 920581 9.929043 507773
## 13 jackson 60485 5.043254 33292
## 14 columbia 124053 7.354239 66873
## 15 paulding 142324 6.174068 76384
## Absentee_ballot_participation_rate
## 1 71.24397
## 2 71.14889
## 3 70.72056
## 4 69.20095
## 5 64.35289
## 6 63.13962
## 7 63.08050
## 8 60.38116
## 9 56.90264
## 10 56.36961
## 11 56.10029
## 12 55.15788
## 13 55.04175
## 14 53.90680
## 15 53.66909We create a Georgia map with map_data function in maps package, which provides all the geographical information used to create a map.
ga_df <- map_data("state") %>% filter(region == "georgia")

# ga_df is the base (only the STATE) of Georgia
ga_base <- ggplot(data = ga_df, mapping = aes(x = long, y = lat, group = group)) +
  coord_quickmap() + #coord_quickmap() automatic adjustment
  geom_polygon(color = "black", fill = "gray")

ga_base + theme_void() +
  geom_polygon(data = ga_df, fill = NA, color = "white") + # inside, boarder color is white
geom_polygon(color = "black", fill = NA) # outside boarder color 
#  map_data("county") has state (column "region") and county (column "subregion")
county_df <- map_data("county") %>% filter(region == "georgia")

ga_base + theme_void() + # theme_void makes backgroud empty
  geom_polygon(data = county_df, fill = NA, color = "white") + # inside: boarder color is white
  geom_polygon(color = "black", fill = NA) # outside boarder color is black
county_df$subregion <- replace(county_df$subregion, county_df$subregion=="de kalb", "dekalb")

state_df <- map_data("state") %>% filter(region == "georgia")


mapdat <- left_join(population_and_satewide,county_df, by = c("County"="subregion"))

head(mapdat,15)
## County Population Not_accepted_percent_state Total_absentee_number
## 1 forsyth 175511 7.047288 125041
## 2 forsyth 175511 7.047288 125041
## 3 forsyth 175511 7.047288 125041
## 4 forsyth 175511 7.047288 125041
## 5 forsyth 175511 7.047288 125041
## 6 forsyth 175511 7.047288 125041
## 7 forsyth 175511 7.047288 125041
## 8 forsyth 175511 7.047288 125041
## 9 forsyth 175511 7.047288 125041
## 10 forsyth 175511 7.047288 125041
## 11 forsyth 175511 7.047288 125041
## 12 forsyth 175511 7.047288 125041
## 13 forsyth 175511 7.047288 125041
## 14 forsyth 175511 7.047288 125041
## 15 forsyth 175511 7.047288 125041
## Absentee_ballot_participation_rate long lat group order region
## 1 71.24397 -84.25917 34.17693 415 16596 georgia
## 2 71.24397 -84.27064 34.33163 415 16597 georgia
## 3 71.24397 -83.97269 34.33163 415 16598 georgia
## 4 71.24397 -83.96696 34.30298 415 16599 georgia
## 5 71.24397 -83.96124 34.29725 415 16600 georgia
## 6 71.24397 -83.94978 34.29725 415 16601 georgia
## 7 71.24397 -83.94978 34.28579 415 16602 georgia
## 8 71.24397 -83.95551 34.26860 415 16603 georgia
## 9 71.24397 -83.96124 34.24569 415 16604 georgia
## 10 71.24397 -83.98415 34.22850 415 16605 georgia
## 11 71.24397 -84.07010 34.18839 415 16606 georgia
## 12 71.24397 -84.08729 34.14828 415 16607 georgia
## 13 71.24397 -84.10448 34.13110 415 16608 georgia
## 14 71.24397 -84.11593 34.09672 415 16609 georgia
## 15 71.24397 -84.11593 34.07380 415 16610 georgiaNow visualize ballots non_accepted_percent for each county on map.
p <-    ggplot(mapdat, aes(long, lat, group = group)) +
        geom_polygon(aes(fill = Not_accepted_percent_state, color="yellow"), # inside county
                     colour = alpha("white", 1/2))  +
        scale_fill_gradient(low="blue", high="red")+
        geom_polygon(data = state_df, colour = "black", fill = NA) + #outside is Georgia state data, not specific
        theme_void() +
        coord_fixed(1.2)

print(p+ggtitle("Percentage of non-accepted ballots in Georgia for 2020 Presidential Election"))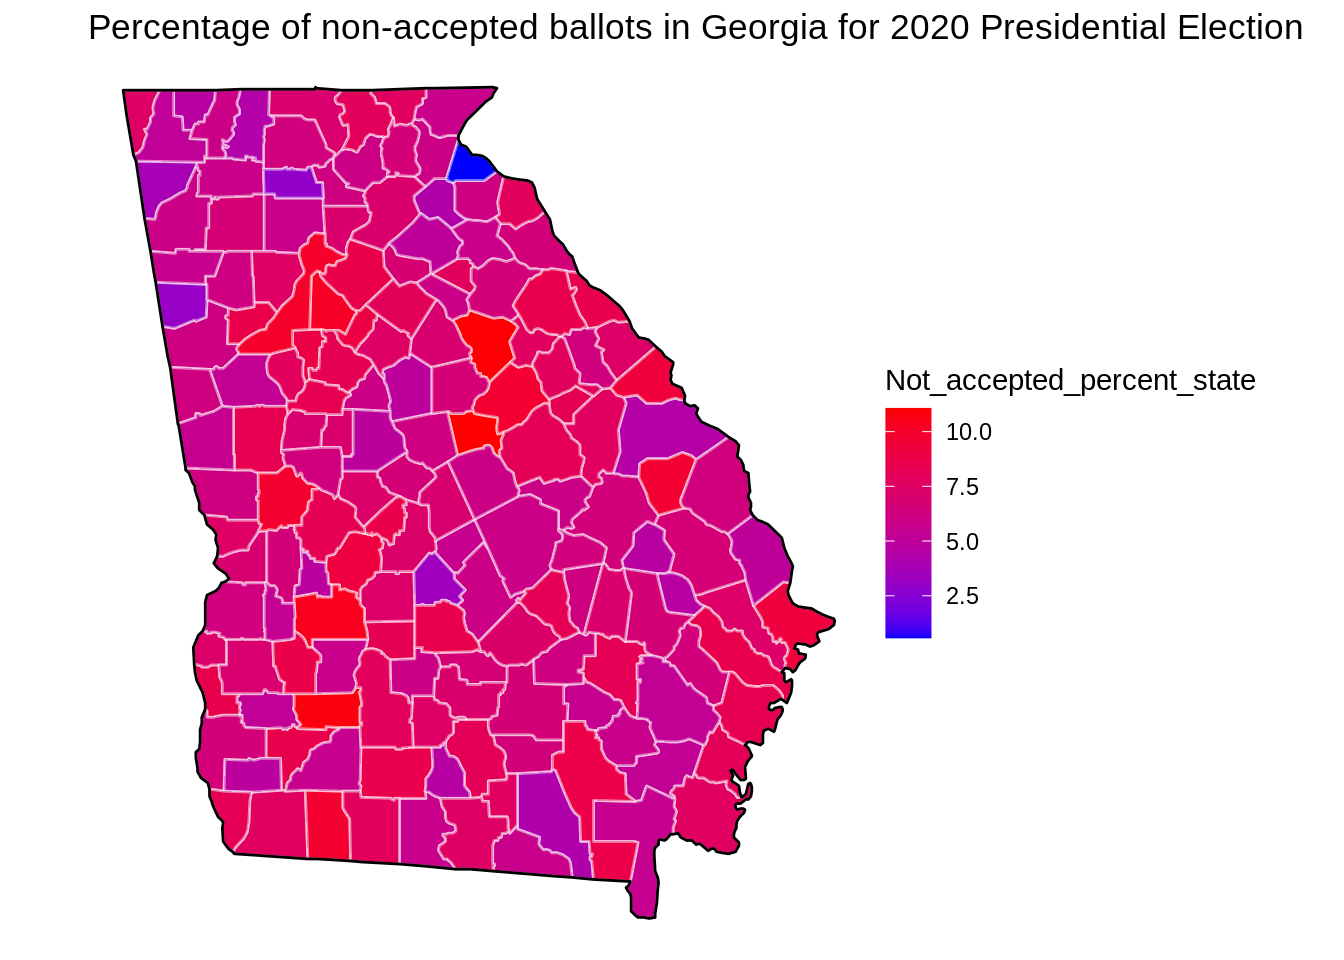
Now visualize absentee ballot participation rate for each county on map, which is calcualted by summing up all ballots and divided by population county-wise. We can see that most counties have participation rates higher than 30 percent.
s <-    ggplot(mapdat, aes(long, lat, group = group)) + # Each group is a different code for each county
        geom_polygon(aes(fill = Absentee_ballot_participation_rate, color="brown"),
                     colour = alpha("white", 1/2))  + # inside county's border is white
        scale_fill_gradient(low="blue", high="red")+ # fill-in color
        geom_polygon(data = state_df, colour = "black", fill = NA) + # outside state color
        theme_void() +
        coord_fixed(1.2)
print(s+ggtitle("Absentee ballot participation rate in Georgia for 2020 Presidential Election"))