44 AutoCorrelation plot
The auto-correlation plot is used to determine whether a time series is dependent on its past. In ggplot, ggAcf function plots the auto-correlation function for a univariate time series. It is used to analyze the raw data to determine if the data can fit into a time-series model.
Practical Example:
Use auto-correlation plot to visualized the Google and Amazon log_transformed stock price.
Coding Time:
ggAcf(ts_goog, lag.max = 20) +
    ggtitle('Auto-correlation plot for log_transformed GOOG stock price')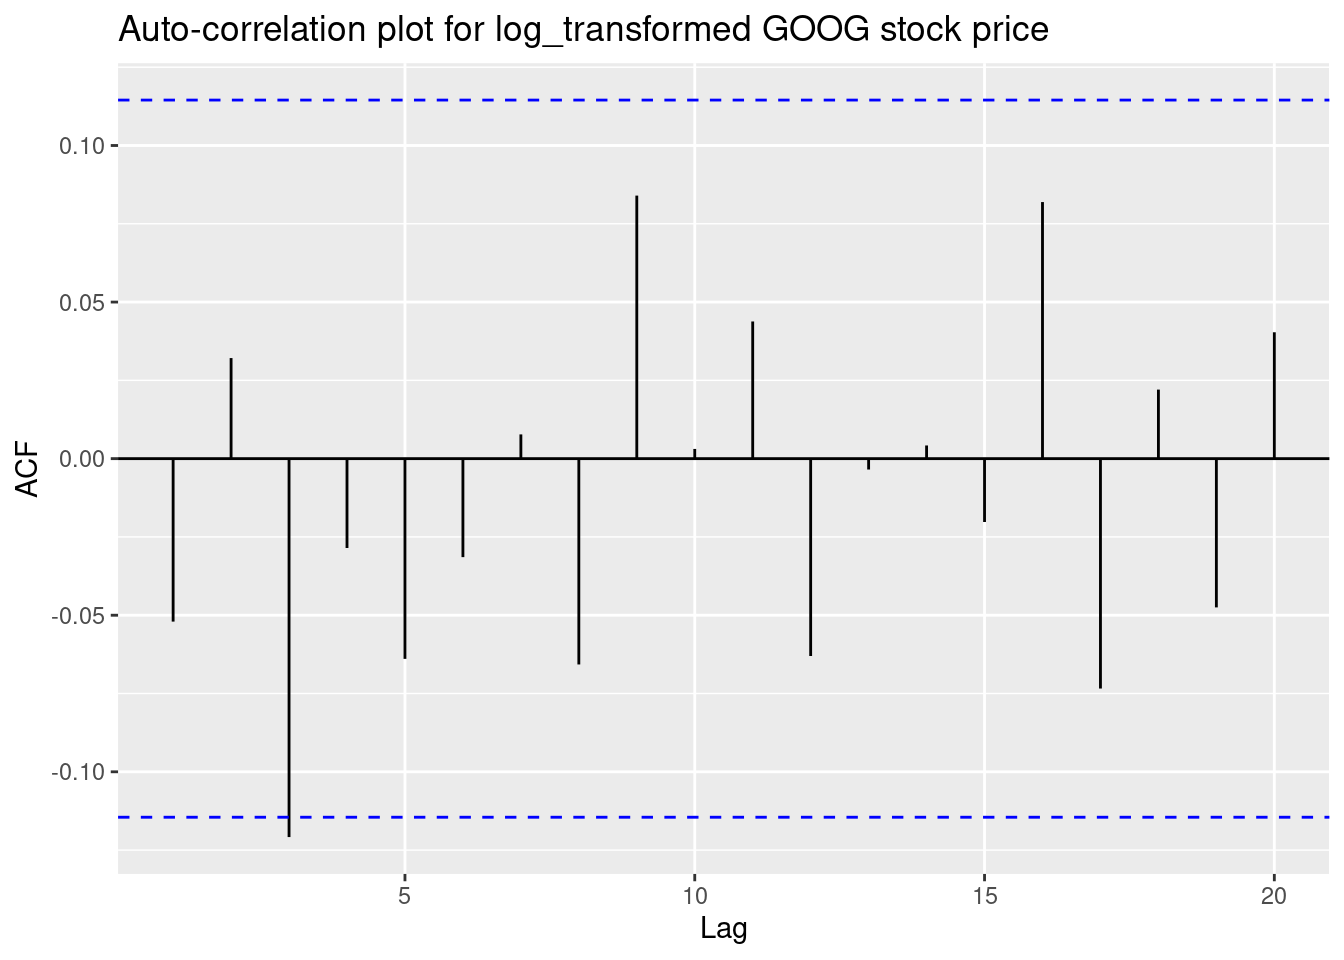
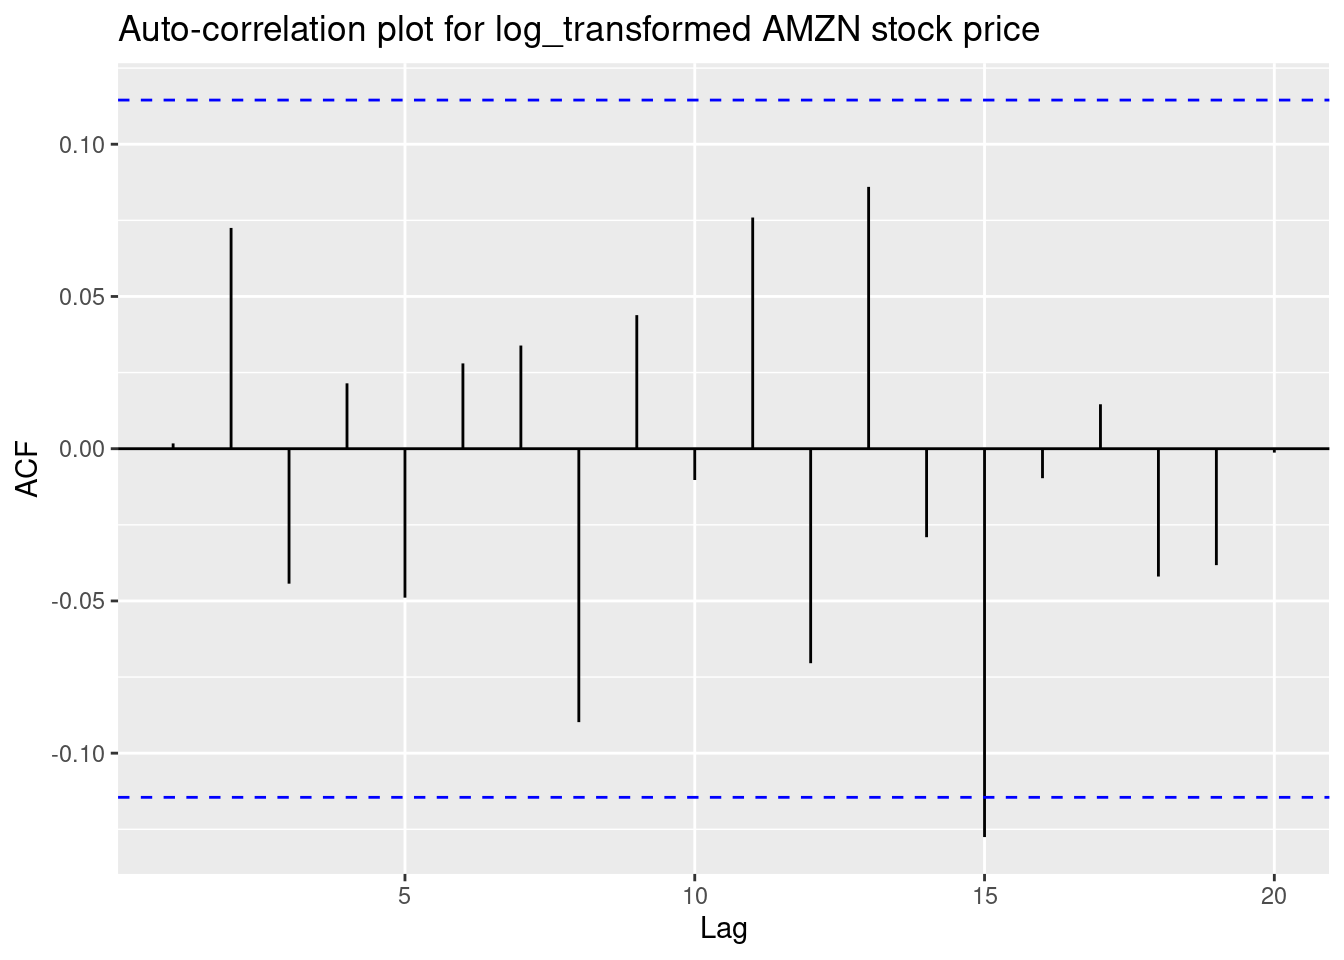
ggAcf(ts_amzn, lag.max = 20) +
    ggtitle('Auto-correlation plot for log_transformed AMZN stock price')