8 Cheatsheet of GGally (including ggcoef_model and ggpairs)
Xinhao Dai
8.0.1 Introductions of GGally
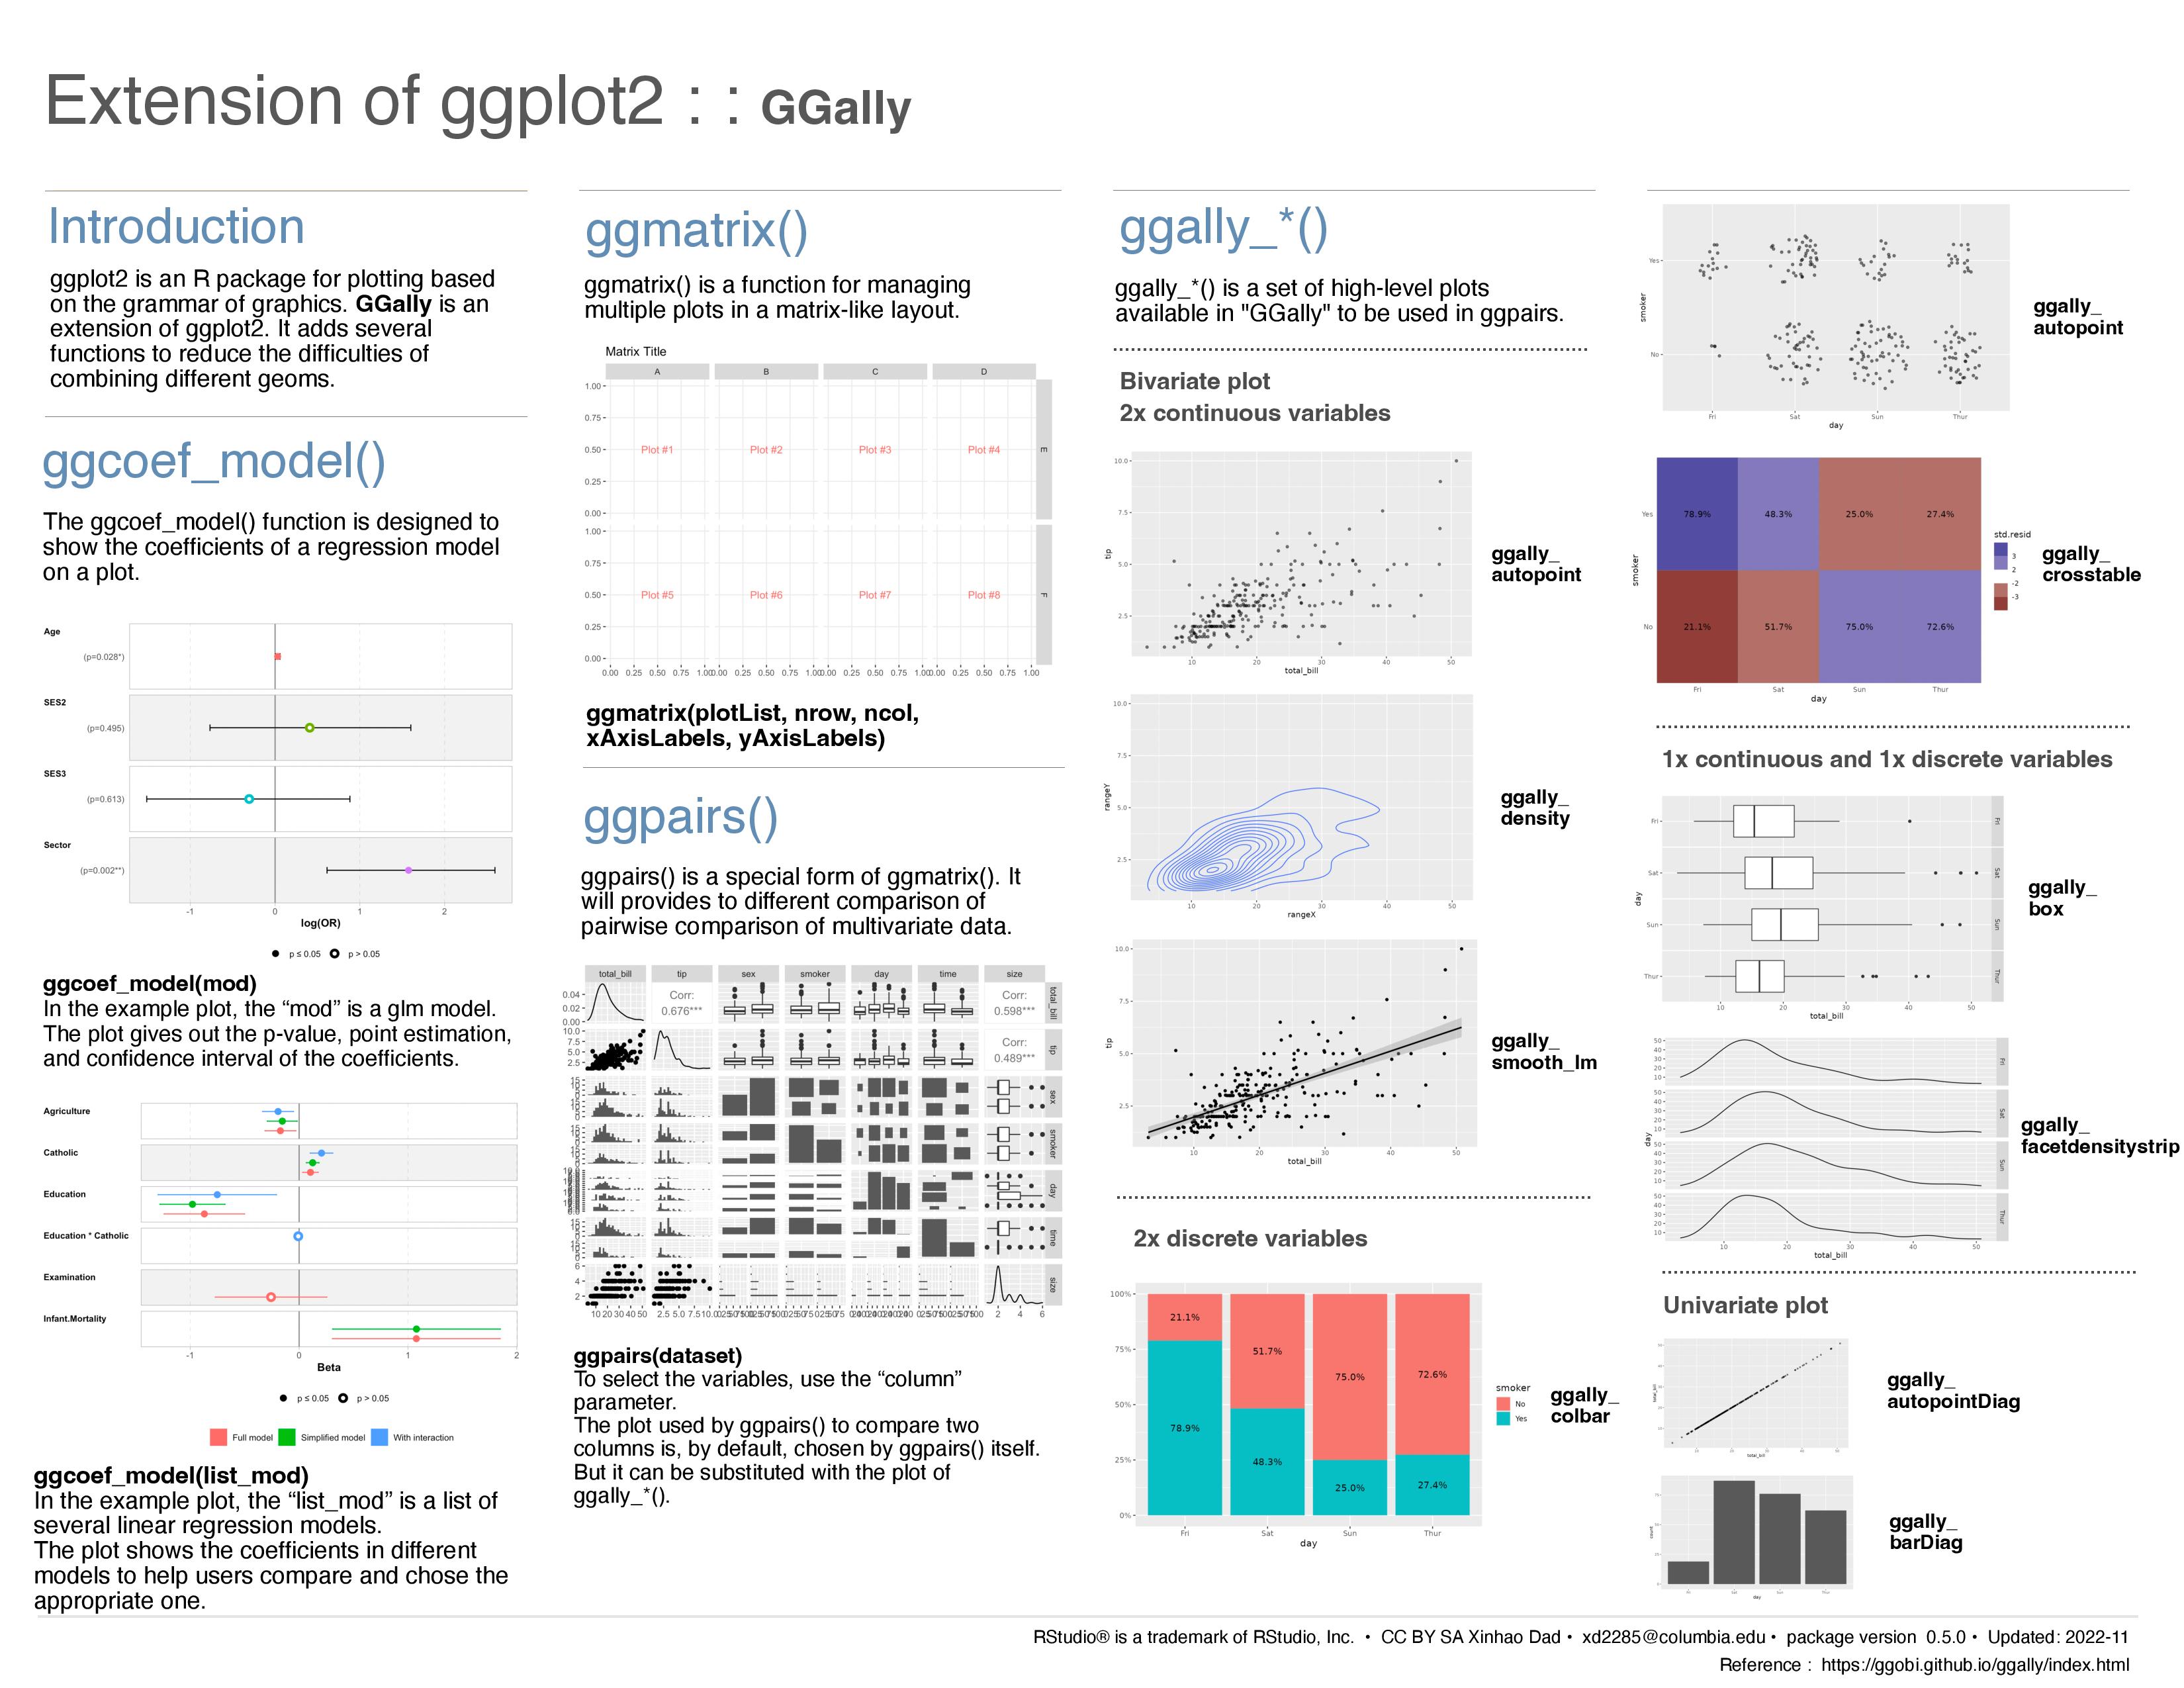
ggplot2 is a R package for plotting based on grammar of graphics. GGally is a extension of ggplot2. It adds several helpful functions to reduce the difficulties of combining different geoms. To enable novices to quickly start using the packet, I create a cheatsheet for GGally.
This cheatsheet includes several essential and efficient plots for explorary data analysis and visualization. First, it’s the ggcoef_model function, it helps to visualize the coefficients of a fitted model. It’s more intuitive and clear. Moreover, it enables us to compare several models in a plot so we can choose the best model among them. Second, it’s the ggpairs() function, which shows the relationships between every two variables in a dataset. It helps us to indentify what’s the relevent variable to a response variable. Moreover, the cheatsheet display several high-level plots that can be used in ggpairs in order to help users have a more clear intuiation.
In this project, I have learned how to do a quickly read through the documents of a packet and distinguish which functions are the most essential and helpful ones. Moreover, I have learned how to create a tidy and beautiful cheatsheet for the users. And if I have another chance, I will try to create my own templeate rather than use the rstudio templeate.
You can find a pdf version of the cheetsheet on https://github.com/Russell-A/cheatsheet-for-ggally. Below is an enclosed image of the cheatsheet.
Reference: https://ggobi.github.io/ggally/index.html.