Chapter 21 Benford’s Law Analysis of 2020 Election
Ryan McNally
For my community contribution I thought I might consider my civic community in addition to my academic EDAV community :)
I have seen some claims of election fraud online in recent days following the election, so thought I might take a look for myself and publish the findings. I have gathered vote count data from a few sources to assess whether fraud is statistically likely to have taken place, through use of Benford’s Law, which claims that sufficiently random counts spanning orders of magnitude will have FIRST DIGITS that occur with decreasing frequency from 1-9.
My initial findings are that for the 3 major candidates, Trump , Biden, and Jorgensen - that at the national level there is no evidence of fraud.
I also ran the analysis on county (or electoral district) level vote counts by state. This works well for states with a high number of counties, but is noisy and unreliable for those with only a few counties.
So the last stage I am working on is to gather precinct level data for specific states that were closely contested, as they’d have had the highest incentive for fraud, and since there is always a large number of reporting precincts. However, this data is much more difficult to find and scrape effectively, so at this point I only have a study of Michigan complete. There are a few counties in Michigan that have a high number of reporting precincts, and don’t conform to the law as closely as one might expect… take a look!
In the resources folder is a picture of the national level aggregation, showing very smooth functions and conformance with Benford’s law. Contrast this with Kent County Michigan file (this is not meant to be partisan, there were plenty of counties which Trump appeared to have failed the chi-square test as well).
In the Piazza post about this project, a peer posted the following comment/question: “This is neat! Do you have data for other states? Or for past elections? My understanding is that Benford’s Law only applies to data that meet certain criteria. For instance, the pattern emerges more often in data that spans multiple orders of magnitude. That would explain why the national data fits the law almost perfectly. The pattern is also conditional on the mean of the data and the outcome of the election (in each sample). In a county that Biden won, the pattern is more likely to emerge in Trump’s data, and the expected most frequent digit for Biden depends more on the mean than Trump’s (you can see this in how the distribution skews for Biden in Kent County).”
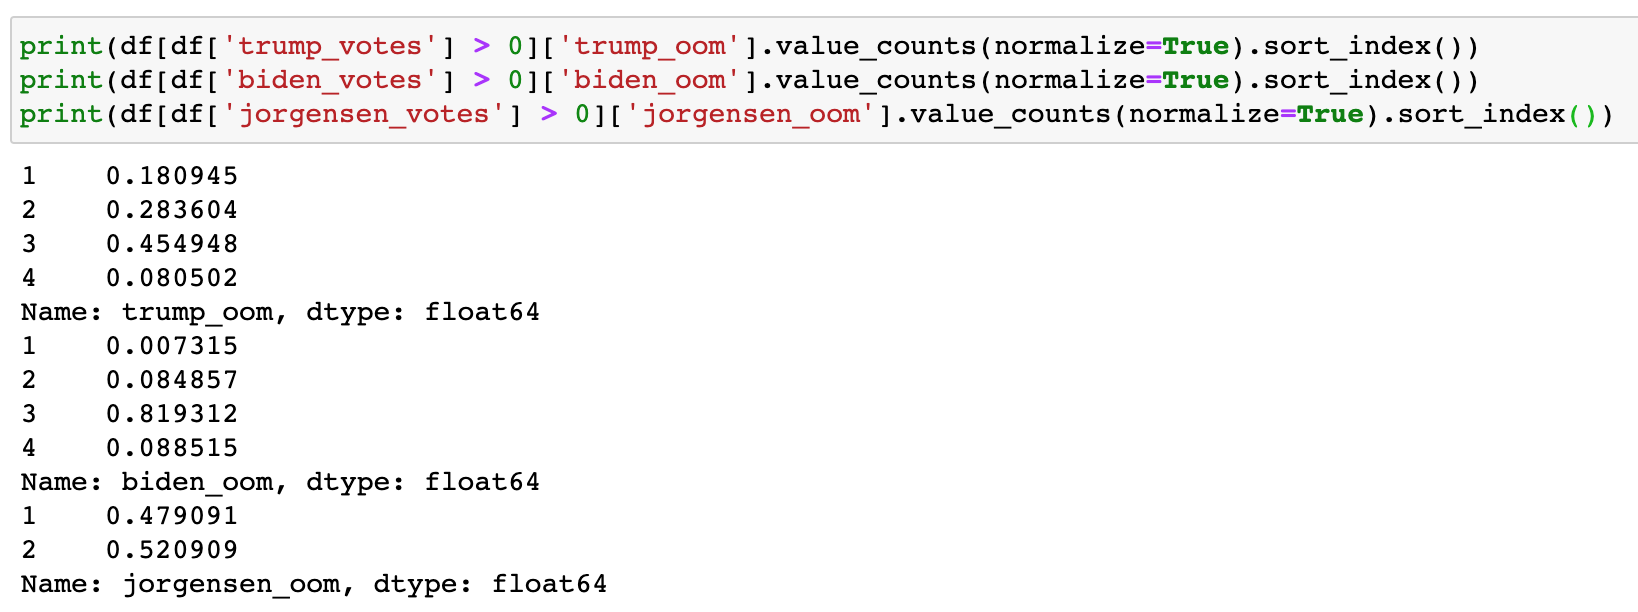
My further analysis to address this is as follows: Thanks for taking a look! Yes as I read more about Benford’s Law I am learning about that constraint. I need to delve a little deeper to see that vote counts in each county’s precincts span a few orders of magnitude to be robust. Here are order of magnitude frequencies for all Michigan precincts, and then for Kent County respectively.
Michigan total:  Kent County total:

In Michigan as a whole, Trump appears evenly/randomly distributed across several orders of magnitude, while Biden looks clustered in the hundreds, and Jorgensen only spans 2 orders of magnitude for the whole state. This might disqualify them, I am not sure.
In Kent county, we are likely constrained by the precinct sizes, and see clustering at 3 OOM for Trump and Biden and 2 for Jorgensen.
Further reading has indicated that using a combination of the first 2 digits together might be more illuminative, as well as using the last 2 digits (which ought to be totally randomly distributed).
I don’t currently have any more precinct level data for any more states, but would be interested in checking out other tight contests, perhaps Wisconsin, Pennsylvania, and Georgia.
Thanks again for taking a look and following up!
***The raw code and output can be found in the following html file: https://github.com/mcryan6/benfords_law_2020_election/blob/main/benfords_law_2020election.ipynb