18 Ggplot2 plots in python cheat sheet tutorial

Braden Huffman

18.1 Motivation

In R, ggplot2 is a powerful visualization tool that all data scientists should have knowledge of. Ggplot2 might even be the most useful visualization tool, but in the event that ggplot2 cannot be used, a data scientist needs to be able to visualize the data. I created a cheat sheet that provides documentation and examples to create some of the most popular R graphs according to http://r-statistics.co/Top50-Ggplot2-Visualizations-MasterList-R-Code.html, and what their equivalents are in Python. I also included a couple of other graphs that we discussed in class.

18.2 Table

data %>% 
  kbl(caption = "Cheat sheet", width=10) %>% 
  kable_material_dark(full_width=F, font_size=8)
Table 18.1: Cheat sheet
Type of Graph ggplot2 Python Python documentation/example
Scatter Plot geom_point pyplot.scatter https://matplotlib.org/stable/gallery/shapes_and_collections/scatter.html
Bubble Plot geom_jitter plotly.express.scatter https://plotly.com/python/bubble-charts/
Marginal Histogram ggMarginal seaborn.jointplot https://seaborn.pydata.org/generated/seaborn.jointplot.html
Correlogram ggcorrplot seaborn.diverging_palette https://seaborn.pydata.org/examples/many_pairwise_correlations.html
Diverging Bar Chart ggbar pyplot.hlines https://www.geeksforgeeks.org/diverging-bar-chart-using-python/
Diverging Dot Plot geom_point pyplot.scatter https://www.machinelearningplus.com/plots/top-50-matplotlib-visualizations-the-master-plots-python/#12.-Diverging-Dot-Plot
Area Plot geom_area pyplot.fill_between https://www.python-graph-gallery.com/area-plot/
Bar Graph geom_bar pyplot.bar https://matplotlib.org/stable/api/_as_gen/matplotlib.pyplot.bar.html
Lolipop Chart geom_point + geom_segment pyplot.stem https://matplotlib.org/stable/api/_as_gen/matplotlib.pyplot.stem.html
Dot Plot geom_point plotly.express.scatter https://lifewithdata.com/2022/02/28/how-to-create-a-dot-plot-in-plotly-python/
Slope Chart geom_vline plt.plot https://towardsdatascience.com/slope-charts-with-pythons-matplotlib-2c3456c137b8
Dumbbell Plot geom_dumbbell plotly.express.scatter + fig.add_shape https://medium.com/@ginoasuncion/creating-a-dumbbell-plot-with-plotly-python-570ff768ff7e
Histogram geom_histogram pyplot.hist https://matplotlib.org/stable/gallery/statistics/hist.html
Density Plot geom_density seaborn.displot(kind=“kde”) https://seaborn.pydata.org/tutorial/distributions.html#kernel-density-estimation
Boxplot geom_boxplot pyplot.boxplot https://matplotlib.org/stable/api/_as_gen/matplotlib.pyplot.boxplot.html
Violin Plot geom_violin seaborn.violinplot https://seaborn.pydata.org/generated/seaborn.violinplot.html
Waffle Chart geom_tile pyplot.figure(FigureClass=Waffle) https://github.com/gyli/PyWaffle
Pie Chart geom_bar + coord_polar pyplot.pie https://matplotlib.org/stable/gallery/pie_and_polar_charts/pie_features.html
Treemap treemapify + ggplotify squarify.plot https://www.python-graph-gallery.com/treemap/
Categorywise Bar Chart geom_bar pyplot.bar https://www.geeksforgeeks.org/bar-plot-in-matplotlib/
Line graph geom_line pyplot.plot https://matplotlib.org/stable/api/_as_gen/matplotlib.pyplot.plot.html
Time Series Calendar Heatmap geom_tile calmap.yearplot https://pythonhosted.org/calmap/
Hierarchical Dendrogram ggdendrogram scipy.cluster.hierarchy.dendrogram https://docs.scipy.org/doc/scipy/reference/generated/scipy.cluster.hierarchy.dendrogram.html
Ridgeline Plot geom_density_ridges2 seaborn.FacetGrid.map(seaborn.kdeplot) https://seaborn.pydata.org/examples/kde_ridgeplot
Alluvium Graph geom_alluvium plotly.graphical_objects.Figure(data=[go.Sankey(…)]) https://plotly.com/python/sankey-diagram/
Radar Chart ggradar plotly.express.line_polar https://plotly.com/python/radar-chart/

18.3 Example

Consider the following time series data:

x: 1, 2, 3, 4, 5, 6, 7, 8, 9, 10

y: 5, 4, 7, 6, 6, 19, 20, 15, 10, 8

Imagine for a moment that your boss instructed you to create an Area Plot of the above data. You know how to do this easily. In fact, you can do it in five lines of code.

x <- c(1, 2, 3, 4, 5, 6, 7, 8, 9, 10)
y <- c(5, 4, 7, 6, 6, 19, 20, 15, 10, 8)
df <- data.frame(x,y)

ggplot(data = df) +
  geom_area(mapping=aes(x,y))

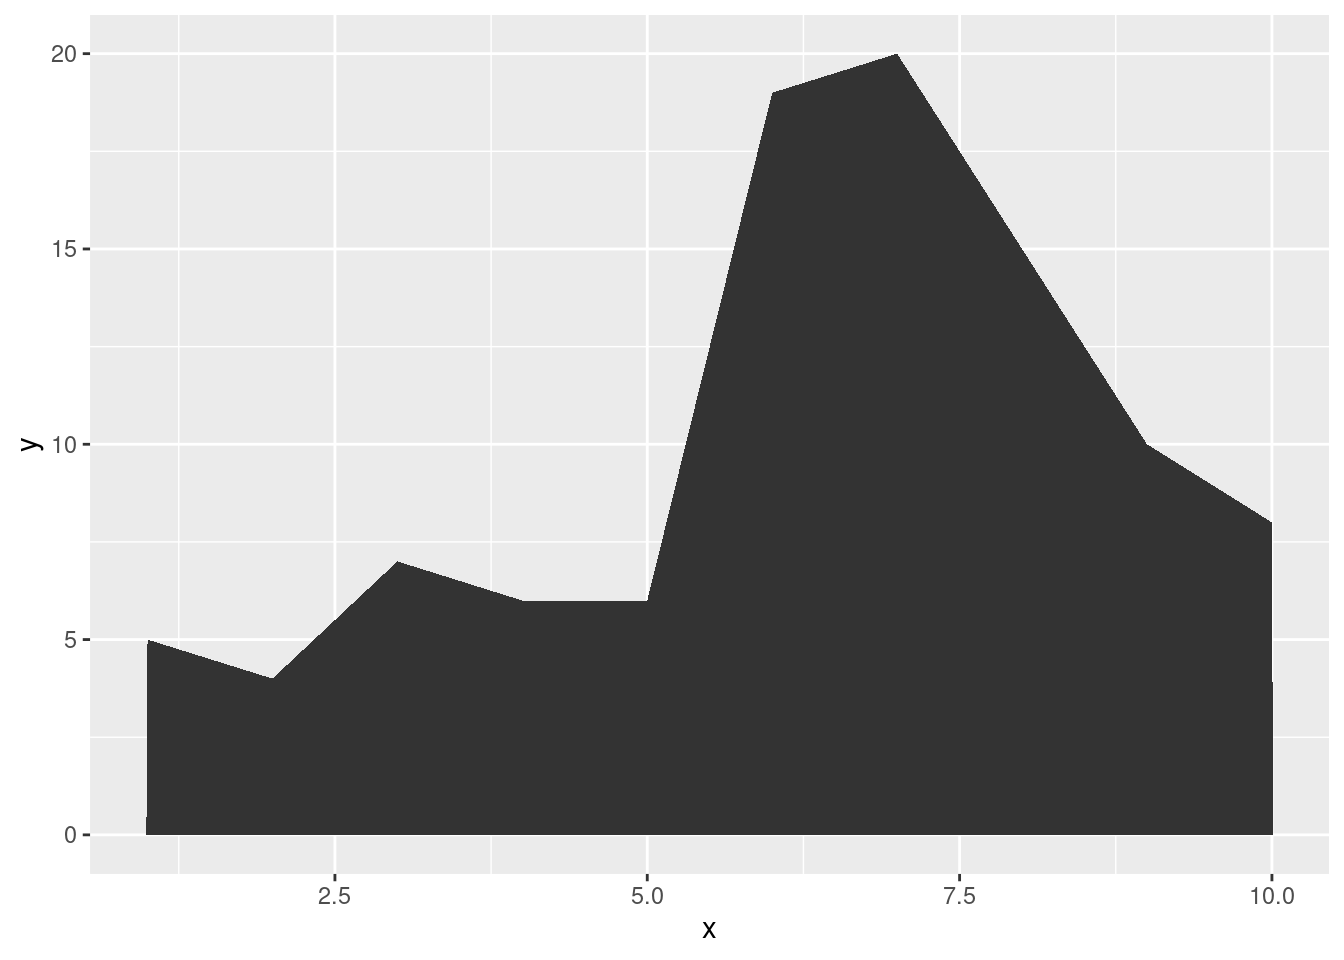
You smile for a moment, knowing that you will actually be home for dinner with the family today. You keep smiling until he utters the words, “in Python.” While area plots are a fairly popular type of graph, you realize that you don’t even know if python has a way to create an area chart, so you decide to consult the above cheat sheet.

The cheat sheet takes you to the following website https://www.python-graph-gallery.com/area-plot/. Fortune shine’s down on you today. Creating an Area Plot in Python isn’t as hard as you had thought it would have been.

https://colab.research.google.com/drive/1DxD5UZolQxcphI44kvK8w4YR-RkZNYgc#scrollTo=UdOui0Fhk24e.

You show your boss the graph linked in the above iPython notebook, and while he isn’t impressed with your artistic ability, he is impressed by your speed.

Clearly Area Plots aren’t the worlds hardest graphs to create, and many of the graphs in the table are more difficult to find and create in Python. I hope this tutorial and cheat sheet make it easier to start creating your favorite ggplot2 graphs in Python.