28 Introduction to Shiny Web Apps
Wenxi Zhang (wz2615)
28.1 Motivation
Shiny is an R package from R studio that makes it easy to build interactive web apps straight with R. Shiny allows you to create highly effective data reports and visualization where user can explore the data set by specifying data subset.
I think it is important to address shiny in this tutorial in the following ways:
Package your analysis in a format that users can easily ingest. As a data scientist, it is common to present work progress within an organization. Shiny makes it easy to deliver data-driven conclusions to users don’t use R or without technical background.
The official tutorial isn’t user friendly for someone first learns shiny. It provides a comprehensive and deep concepts in Shiny and could take too long to finish the whole lessons. Thus here I include some most heavily used functions and concepts in shiny to give viewers a more general and practical exposure to using Shiny.
Prototyping. Shiny provides a rapid way of prototyping shiny dashboards. As the user interface requirements often changes as a project progress, it is often easier to determine the requirements using a prototype. With Shiny, developers can quickly change and edit Shiny dashboards, as the Shiny framework includes a set of pre-configured functions that generate panels and widgets. When the requirements are settled, we could move from the Shiny app to a formal web development framework.
Performing daily data analytics task. We can save the R code that does data analytics job in Shiny. For users who have no background in R, they can also perform data manipulation and visualization task. This allows the daily analytics task to move away from data scientists so that they could focus more on the new challenges in business decisions.
28.2 How to host
There are multiple way to host a shiny app.
- Install shiny server on a computer
- Upload your app to https://www.shinyapps.io/
- Each month you have 25 free active hours
- Maximum 5 apps for free
- Google Cloud Run: https://code.markedmondson.me/shiny-cloudrun/
28.3 Create your first Shiny app
Here we only focus on creating a Shiny app in Rstudio. There are several ways to do:
- File -> New File -> Shiny Web App
- Single file ( What this tutorial uses)
- Multiple files
- File -> New File -> R Markdown -> Shiny
- File -> New File -> R Markdown -> From Template -> Flex Dashboard
28.4 Basic Struture
Shiny applications are divided into three parts:
User Interface (UI)
Server
a call to the shinyApp function
The user interface (ui) is responsible for the app presentation, while the server is responsible for the app logic. Finally the shinyApp() function creates Shiny app objects from an explicit UI/server pair.
UI controls the lay out of components and what are being displayed on the application page, like text, plots, and widgets that take user input. The server controls the data being displayed in UI. It’s where you load and wrangle data, transforming input from UI to outputs.
Below is a simple example
28.5 The UI
You may lay out the user interface of your app by placing elements in the fluidPage function. Elements can be seperated to inputs and outputs function.
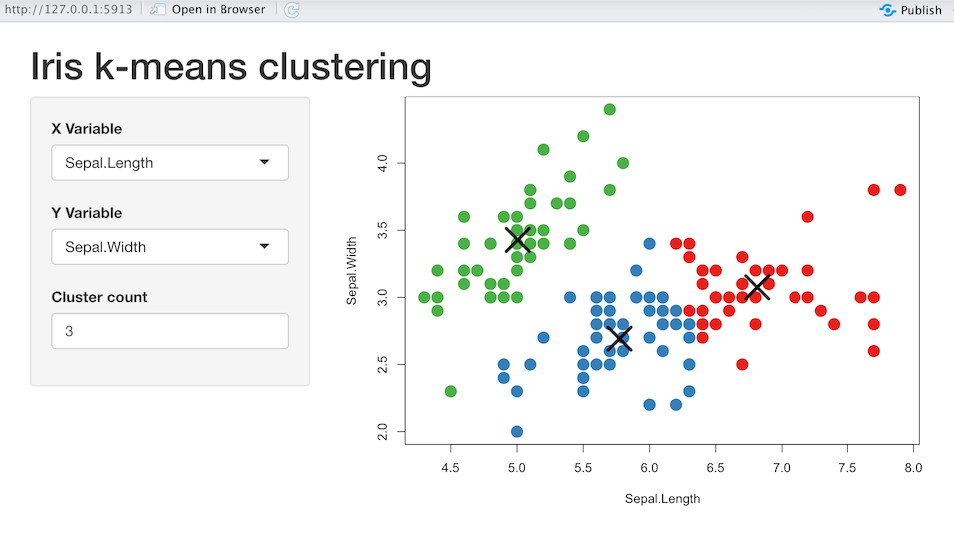
Next we will create a visualization tool to display k-means clustering of Iris dataset. To do this, we need to define the UI panel and return a scatterplot. Iris data set contains 3 classes of 50 instances each, where each class refers to a type of iris plant. The feature set contains “Sepal.Length”, “Sepal.Width”, “Petal.Length”, “Petal.Width”
28.5.1 layout
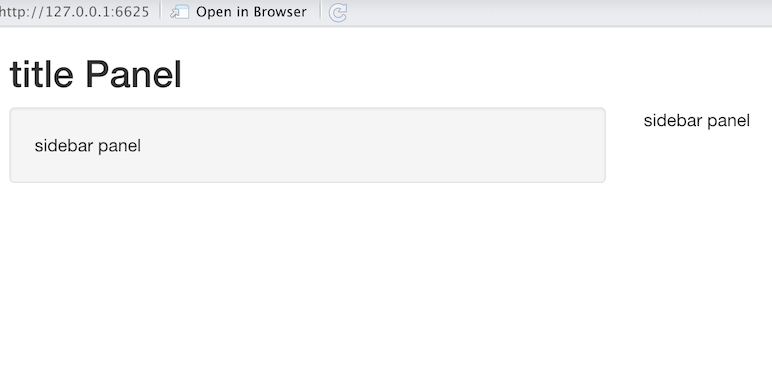
First, let’s create the UI panel above on the left side. We will need to define three panels: title, sidebar for users’ input, and main for where all of our visualization work will go.
titlePanel and sidebarLayout are two popular elements to create layout.
titlePanel is basically where you put the App title in.
sidebarLayout has two arguments: sidebarPanel and mainPanel, which place content at sidebar or main panels as shown below in example1. You can put values like text or input/output functions in the Panels.
ui <- fluidPage(
  titlePanel("title panel"),

  sidebarLayout(
    sidebarPanel("sidebar panel"),
    mainPanel("main panel")
  )
)
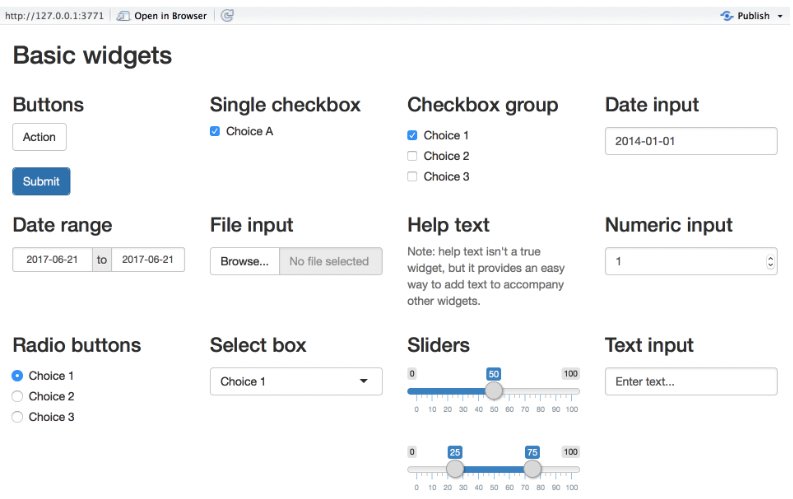
28.5.2 Input functions
We can also add control widgets to provide a way for users to send messages to the Shiny app. Shiny widgets collect a value from your user. When a user changes the widget, the value will change as well.There are many input functions to create widgets. Below are some examples of basic widgets.
Next I will introduce a common input function selectInput() that shows a box with choices to select from.
selectInput() has 3 required arguments:
inputId: The input name to access the value (for internal ues–> use input$inputId to refer the input value when in server)
label: Label shown in the UI, NULL for no label.
choices: List of values to select from.
We can also use selected to set initial selected value if user not specify.
selectInput(inputID='ycol', label='Y Variable',
            choices=names(iris)[1:4],#"Sepal.Length" "Sepal.Width"  "Petal.Length" "Petal.Width"
      selected = names(iris)[[2]])# set "Petal.Length" to be default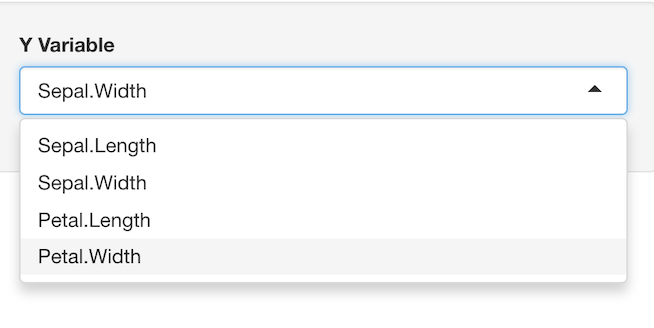
Here I include the select widget that allows the user to select the y variable of output plot. I also define the variables to choose from are attributes from the feature set, and set the default choice to be ‘Sepal.Width’. Similarly, we can define the selection box for x variable and a numeric Input box that user can define cluster numbers for our clustering example.
28.5.3 Output functions
To display output, we add output function to fluidPage() with an *Output() function. Below is a list of output functions that turn R objects into a specific type of output
| Output | function Creates |
|---|---|
| dataTableOutput | DataTable |
| htmlOutput | raw HTML |
| imageOutput | image |
| plotOutput | plot |
| tableOutput | table |
| textOutput | text |
| uiOutput | raw HTML |
| verbatimTextOutput | text |
Just like other elements in ui, we can add output to the user interface inside sidebarPanel or mainPanel.
In our example, we place the output in the mainPanel and the output is a scatter plot with user defined x, y variables. We may add plotOutput('plot') to the mainPanel to create the plot object, where "plot" is the name given to the output plot. numericInput() is used for choosing cluster numbers, users are allowed to enter cluster numbers from 1 to 9, with the default of 3 clusters.
Below is the complete ui portion for our Iris clustering problem.
ui <- fluidPage(
  headerPanel('Iris k-means clustering'),
  sidebarPanel(
    selectInput('xcol', 'X Variable', names(iris)[1:4]),
    selectInput('ycol', 'Y Variable', names(iris)[1:4],
                selected = names(iris)[[2]]),
    numericInput('clusters', 'Cluster count', value=3,#value: initial value
                 min = 1, max = 9)#Minimum allowed value, Maximum allowed value
  ),
  mainPanel(
    plotOutput('plot')
  )
)
28.6 The Server
After adding the output object in ui, we need to tell Shiny how to build the object in the server function. To do this, we need to
Access input values with
input$(In our example, we haveinput$xcol,input$ycol,input$clusters)builds a list-like object named
outputthat contains all of the code needed to update the R objects in the app. (Save objects to display tooutput$. In our case output isoutput$plot)Define text/charts/plots in the server function (Build objects to display with
render*())
Each entry to output should contain the output of one of Shiny’s render* functions. These functions capture an R expression and do some light pre-processing on the expression. render*() function creates the type of output you wish to make. Shiny will re-run the function every time it needs to update your object.
Below are some common render functions and their descriptions.
| render function | creates |
|---|---|
| renderDataTable | DataTable |
| renderImage | images (saved as a link to a source file) |
| renderPlot | plots |
| renderPrint | any printed output |
| renderTable | data frame, matrix, other table like structures |
| renderText | character strings |
| renderUI | a Shiny tag object or HTML |
By following the rules above, reactivity automatically occurs whenever you use an input value to build rendered Outputs.
28.6.1 Reactivity
We know that the input value changes whenever a user changes the input. The input values notify render* functions and R expression inside the render*() when input changes. When notified that input changes, the object created by a render*() function will return the entire code block to update itself.
However, it could be computational costy if we update all R expression inside the render*() whenever an input updates. For example, if we want to use the same modified input several times, the duplicate R expressions for modifying input could slows the program. Thus it is better to save the reusable R expressions that modifies input to a function. Luckily, reactive() function in shiny does this job!
reactive() builds a reactive object that will respond to every input value in the code. We can save the R expressions what modifies input values in reactive() and call the reactive expression like a function.
In our example, we can save the user specified two feature columns of Iris dataset as selectedData and calculate k-mans model clusters base on selectedData and user specified cluster numbers.
Moreover, selectedData won’t change if input$xcol and input$ycol aren’t changed. We can avoid unnecessary computation by not putting all expressions in the final render*() function, so that we don’t need to update iris[, c(input$xcol, input$ycol)] whenever input$clusters changes.
28.6.2 Display output with render*()
In our example, we need to define a plot as output. Thus we use the render function renderPlot() here.
As discussed before, renderPlot() will respond to every reactive value in the code, which are selectedData() and clusters(). We use these two functions as the input data in renderPlot(). When any of the two functions change, renderPlot() will rerun the r expressions inside.
output$plot <- renderPlot({
par(mar = c(5.1, 4.1, 0, 1))
plot(selectedData(),
col = clusters()$cluster,
pch = 20, cex = 3)
points(clusters()$centers, pch = 4, cex = 4, lwd = 4)
})Now everything is connected! The overall server section looks like below. Finally, we need one more statement to have our app running –>shinyApp(ui = ui, server = server)
server <- function(input, output) {
  selectedData <- reactive({
    iris[, c(input$xcol, input$ycol)]
  })

  clusters <- reactive({
    kmeans(selectedData(), input$clusters)
  })
  output$plot <- renderPlot({
    par(mar = c(5.1, 4.1, 0, 1))
    plot(selectedData(),
         col = clusters()$cluster,
         pch = 20, cex = 3)
    points(clusters()$centers, pch = 4, cex = 4, lwd = 4)
  })
}28.7 Conclusion
In general, Shiny is a great option to presenting results combining with the visualization tool using R expressions. Though the example we went through, we have covered the basic structure of Shiny, how to manipulate the layout of UI, and how to connect the logic behind input s and outputs in the server function.
Functions introduced above are some most used functions in shiny. There are more powerful and interesting aspects of shiny app like customizing appearance and other internal functions. I highly recommend you to visit https://shiny.rstudio.com/ for the documentation and gallery.
28.8 Evaluation
During my experience of dive deep into learning shiny and experimenting with different data sets, I find shiny is a powerful and easy to learn package that generate intuitive interactive web apps, especially for the interactive plots. If you want to report an ongoing project, shiny would be a great tool for visualizing the impact of your work. Just like in our example here of visualizing k-means clusters, it gives users a more intuitive way of understanding k-means clustering.
I also learnt that Shiny has unlimited possibilities of improving efficiency of our work, from creating interactive presentations on project result to solving daily analytic task. Moreover, Shiny enables users who have no R background to do data analyzing work, by manipulating the widgets in the UI.
Things I might do differently next time would be including more complex and useful internal functions for the server part, and customizing appearance of Shiny’s UI components using differnt themes.