54 What you see is what you understand: learning data science visually
Rohan Poddar
“Visualization is the process of making an external spatial representation of information. Visualizing is a useful strategy for discovering structure and organizing information efficiently” (Schwartz, Tsang, & Blair, 2016, p. 277)
Data Science consists of a lot of abstract concepts like Linear Algebra, Probability and Statistics, and Machine Learning. I believe a great way to develop a strong understanding and intuition of these concepts is by learning through interactive visualizations. I have curated a list of resources that cover some of the important topics in a visually interactive way.
54.1 Programming
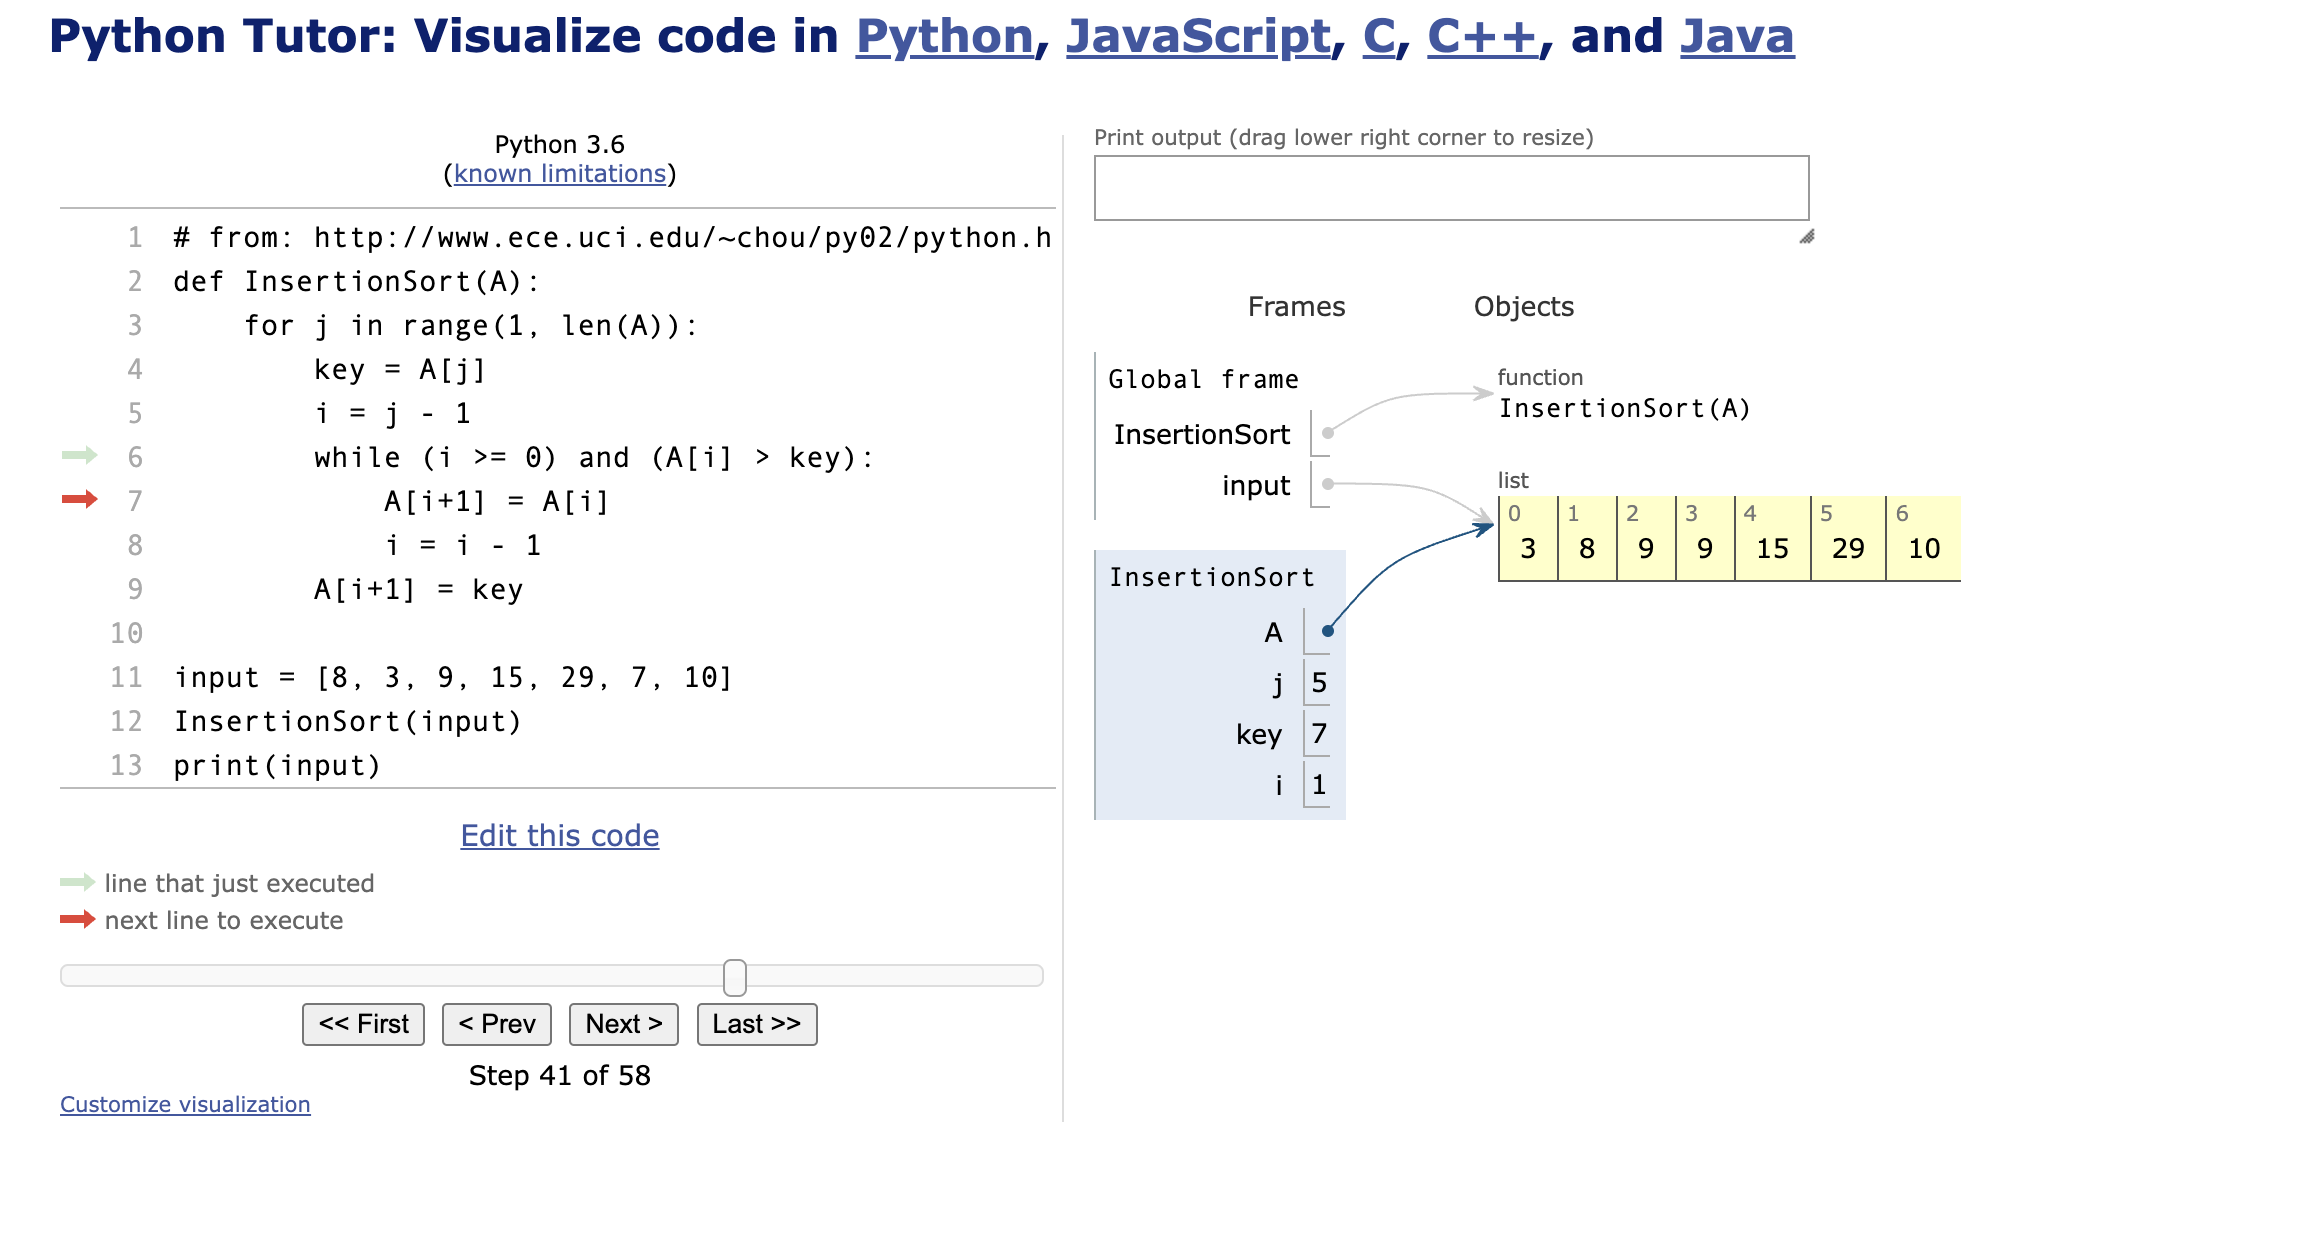
54.1.1 1. Python Tutor
Link: https://pythontutor.com/
Writing code is very abstract and become difficult to follow as the length and complexity of the code increases. Python Tutor helps learn Python, JavaScript, C, C++, and Java programming by visualizing code execution.
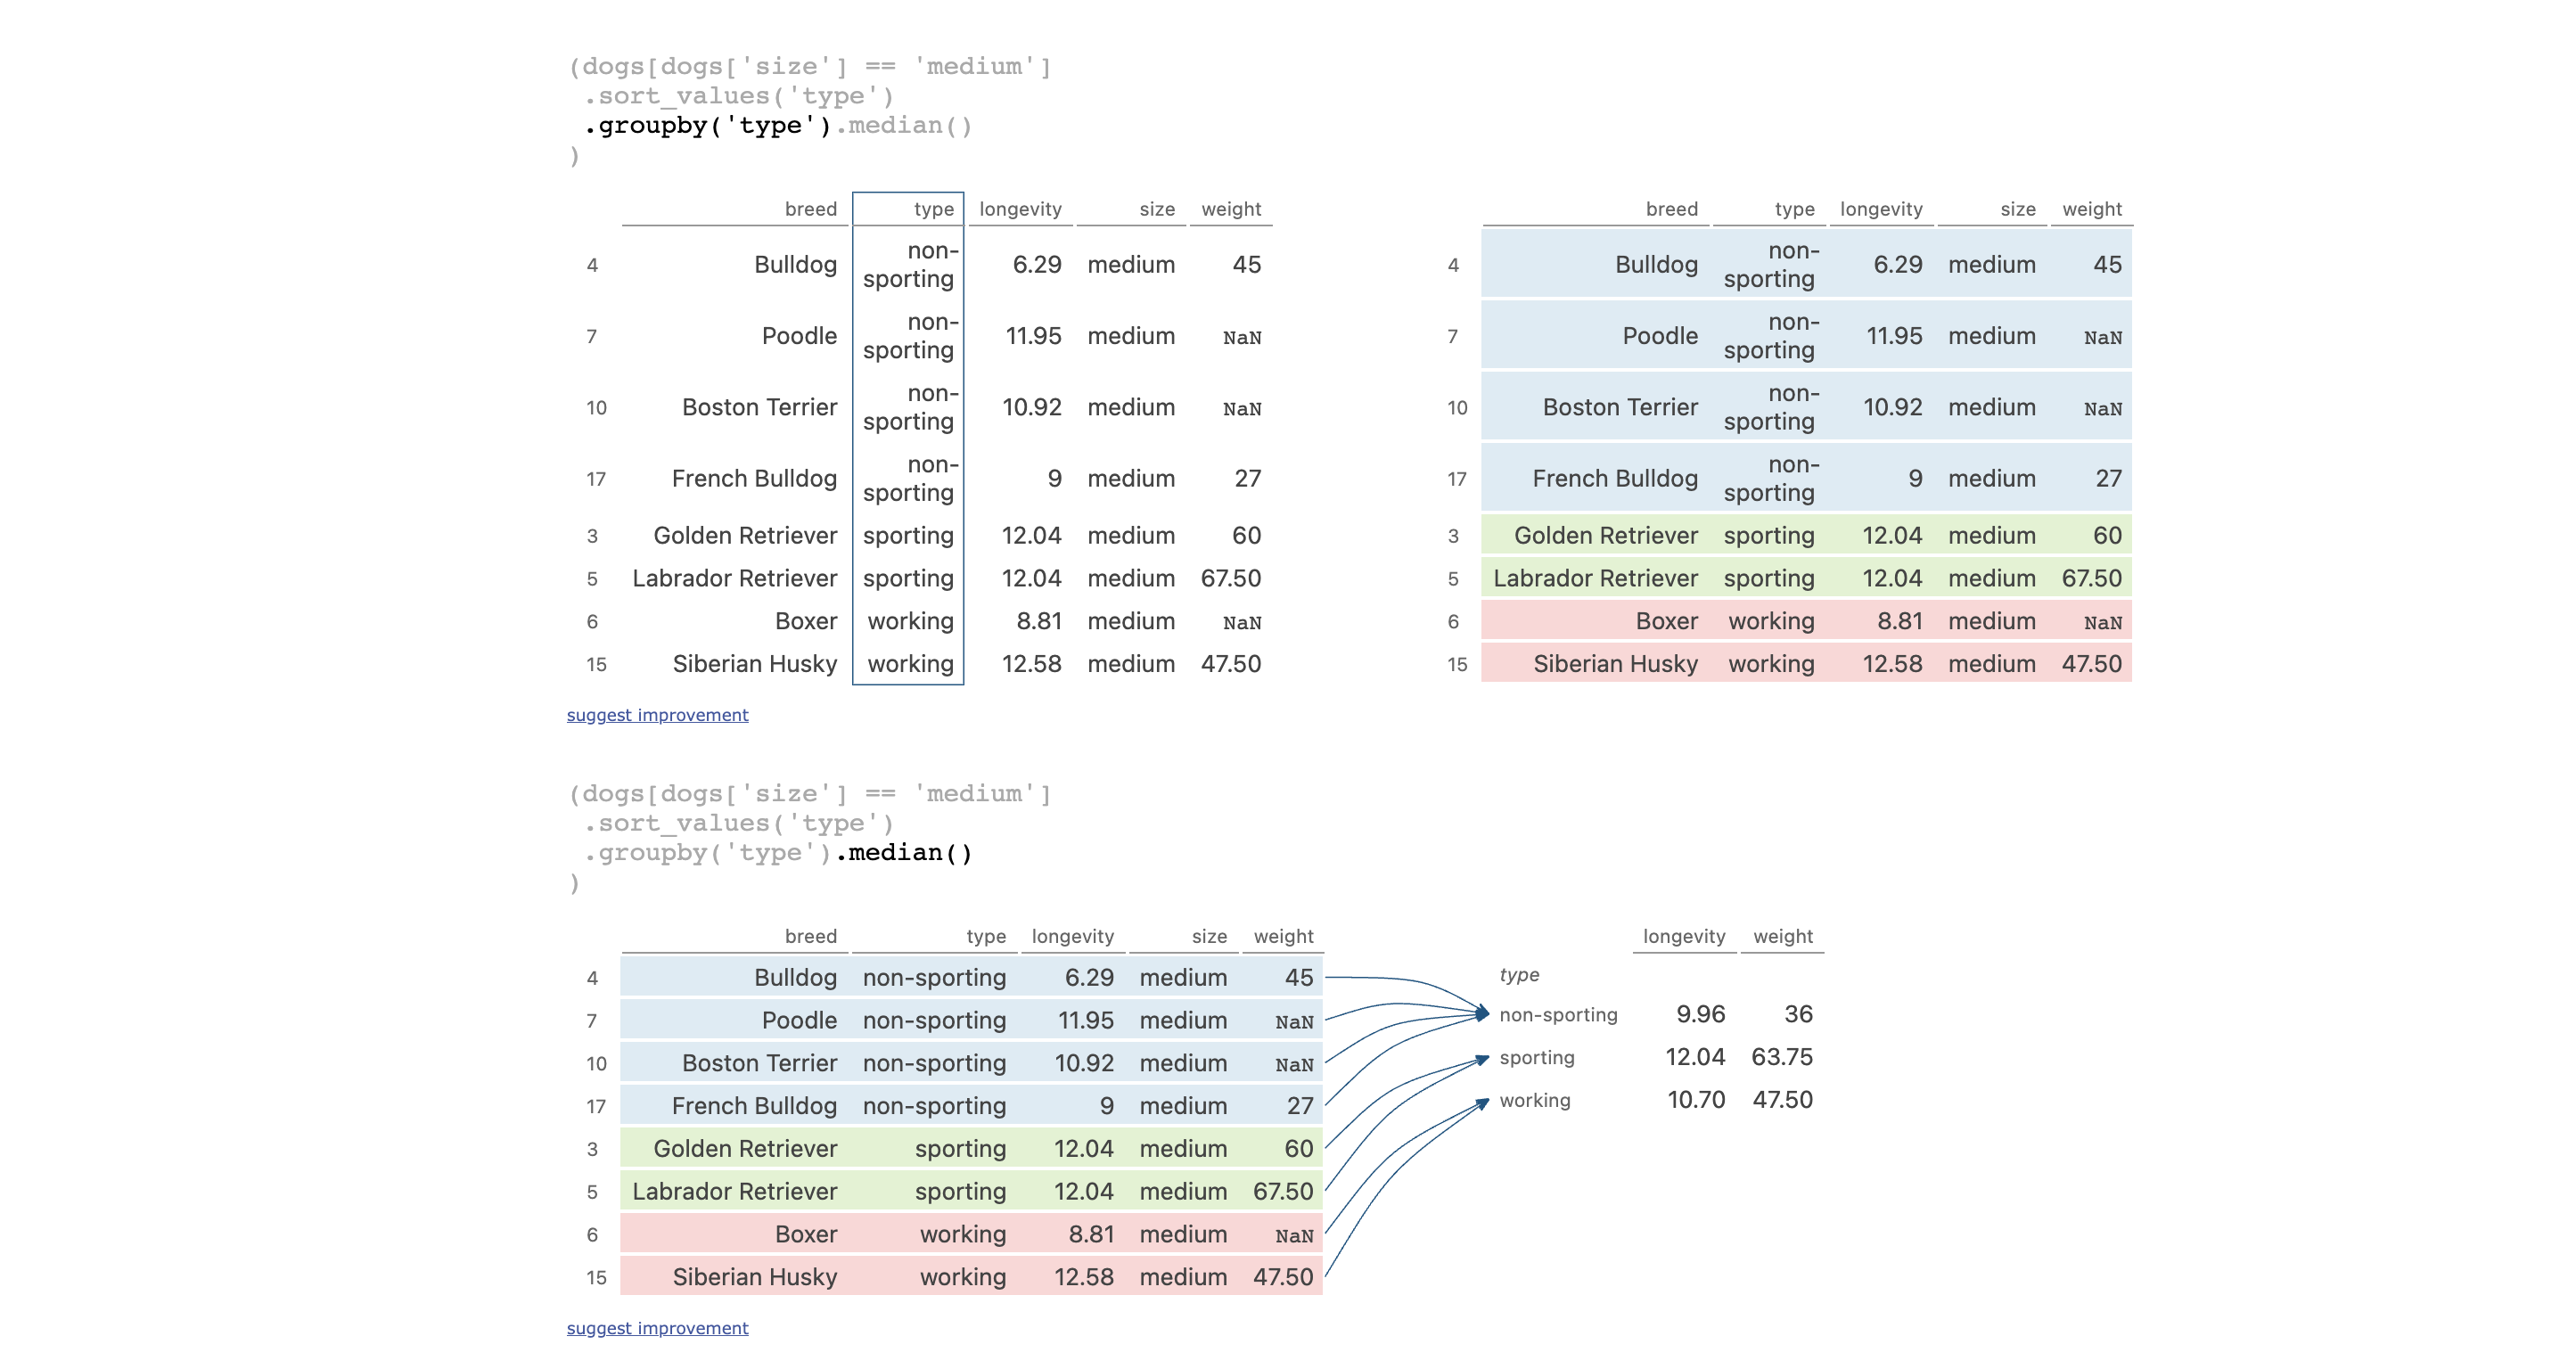
54.1.2 2. Pandas Tutor
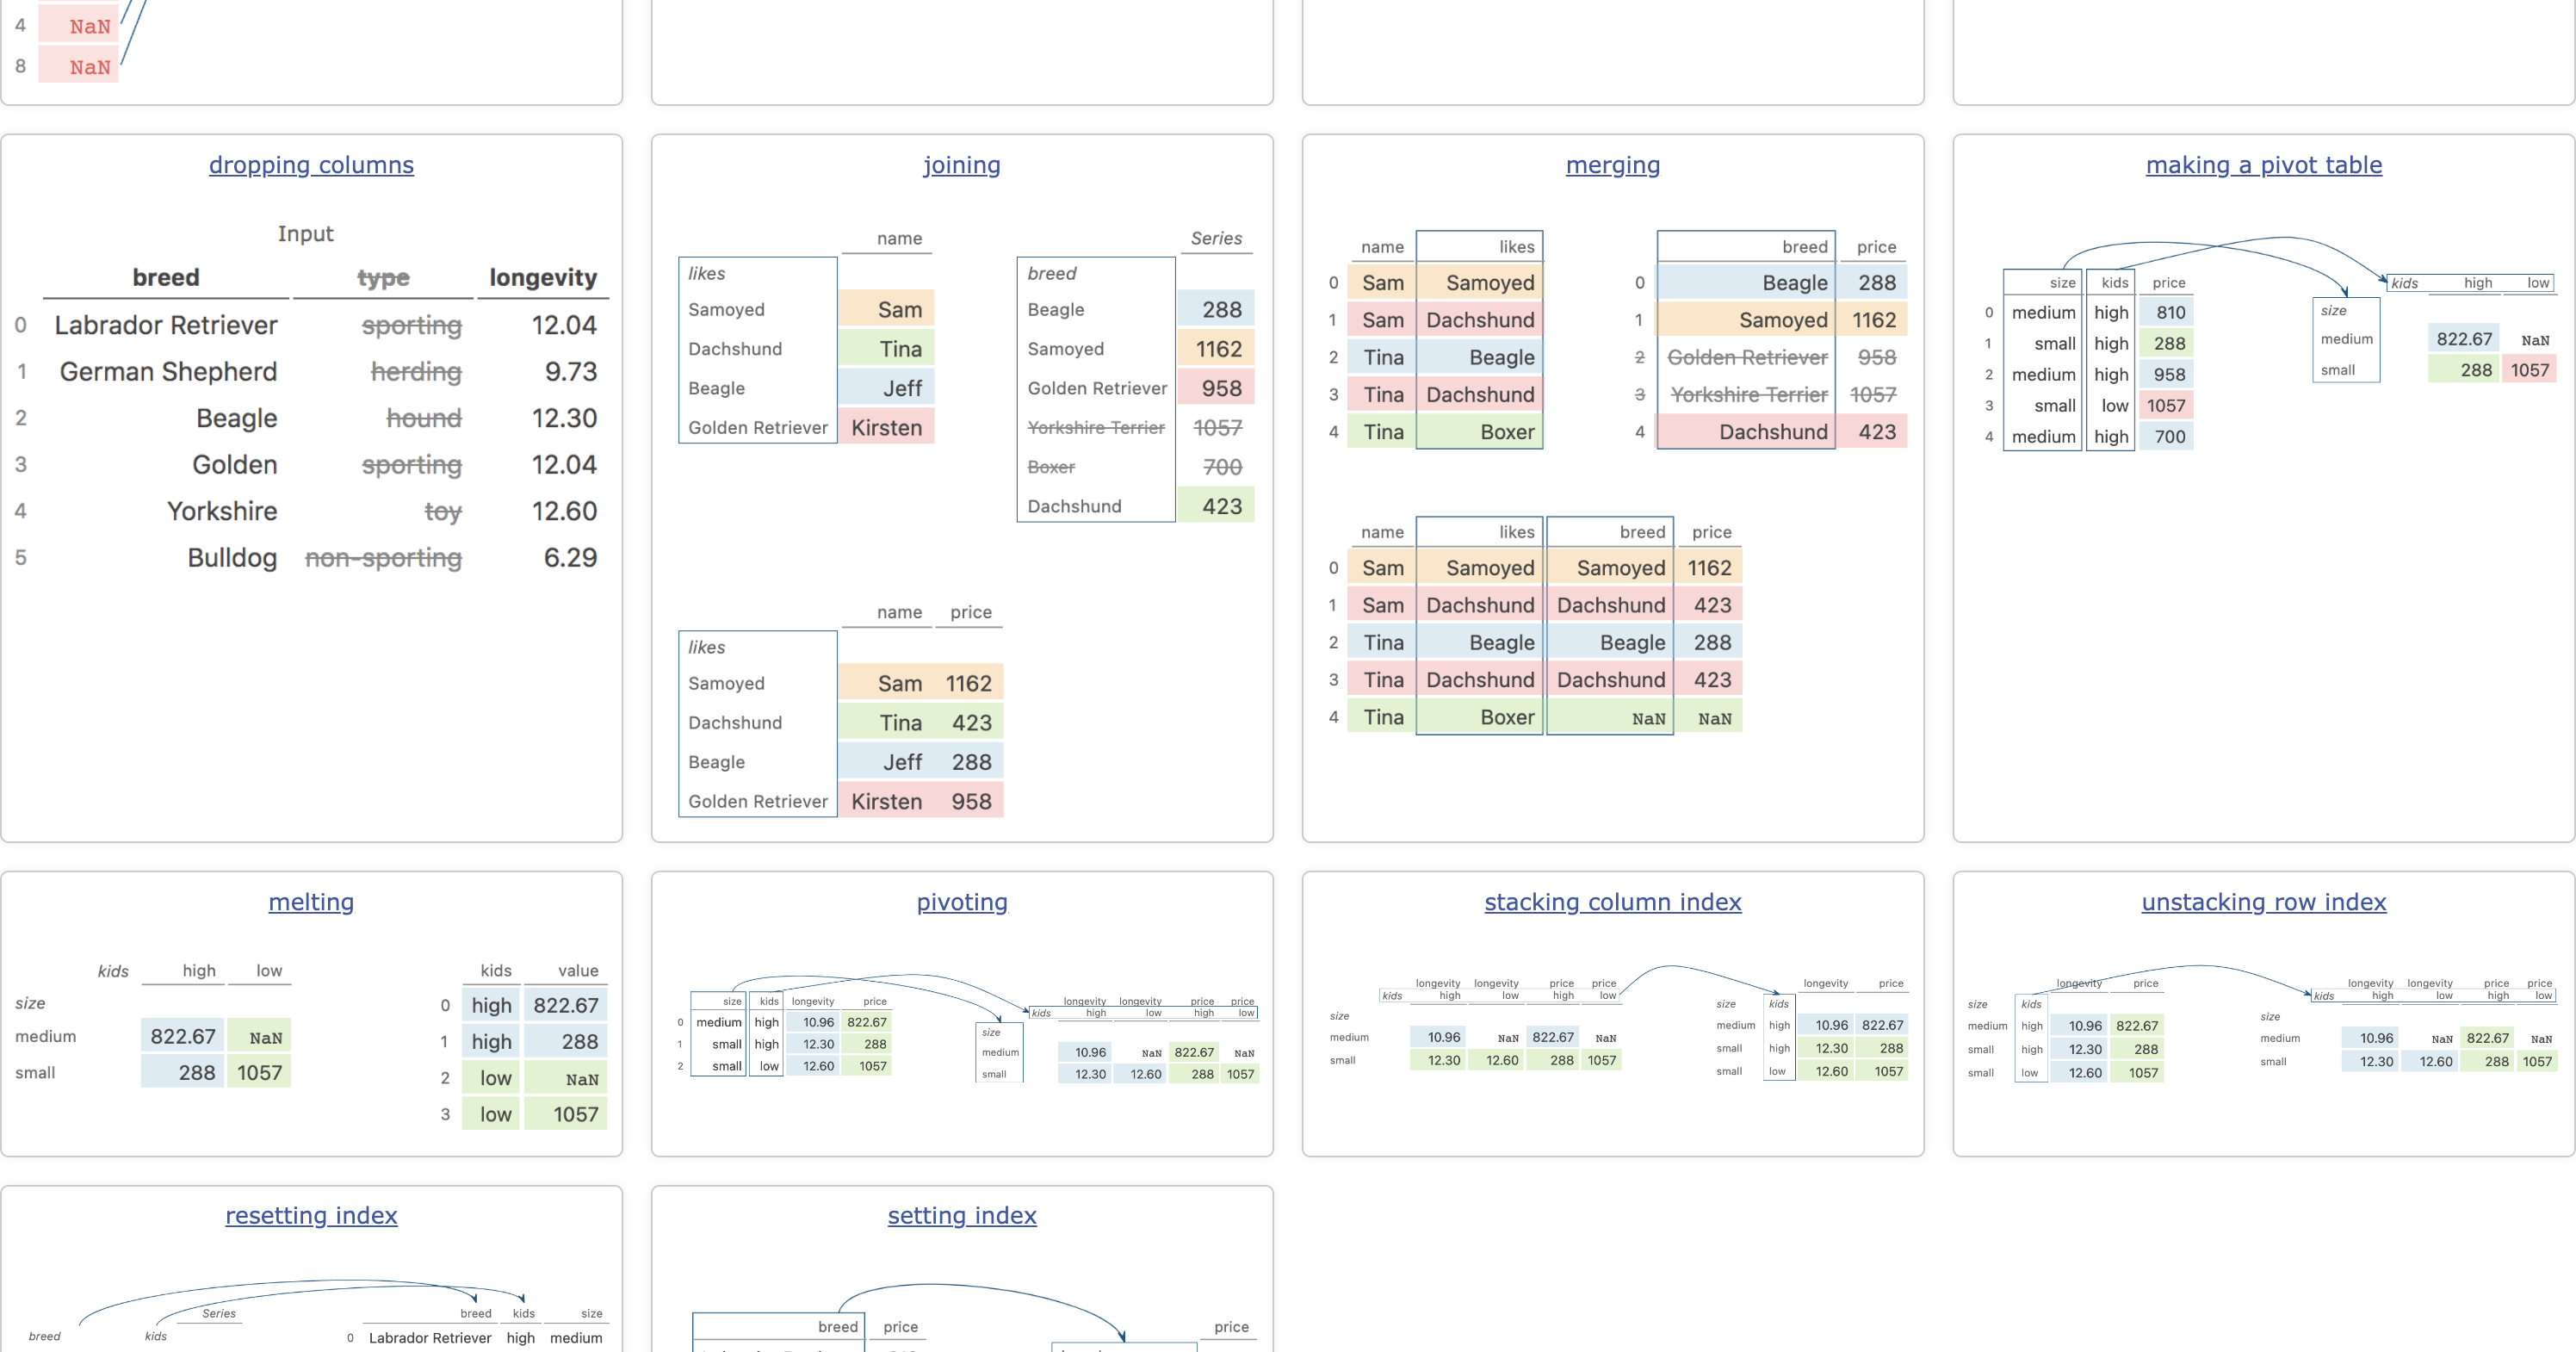
Link: https://pandastutor.com/
Transforming and manipulating Pandas data frames are the backbone of every Data Science project. However, manipulating data frames can become very complex to hard to follow. Using bulky print statements and copy-pasting snippets of the code to see what is happening can get cumbersome. Pandas Tutor lets you write code directly in the browser and helps visualize the data transformation step-by-step.
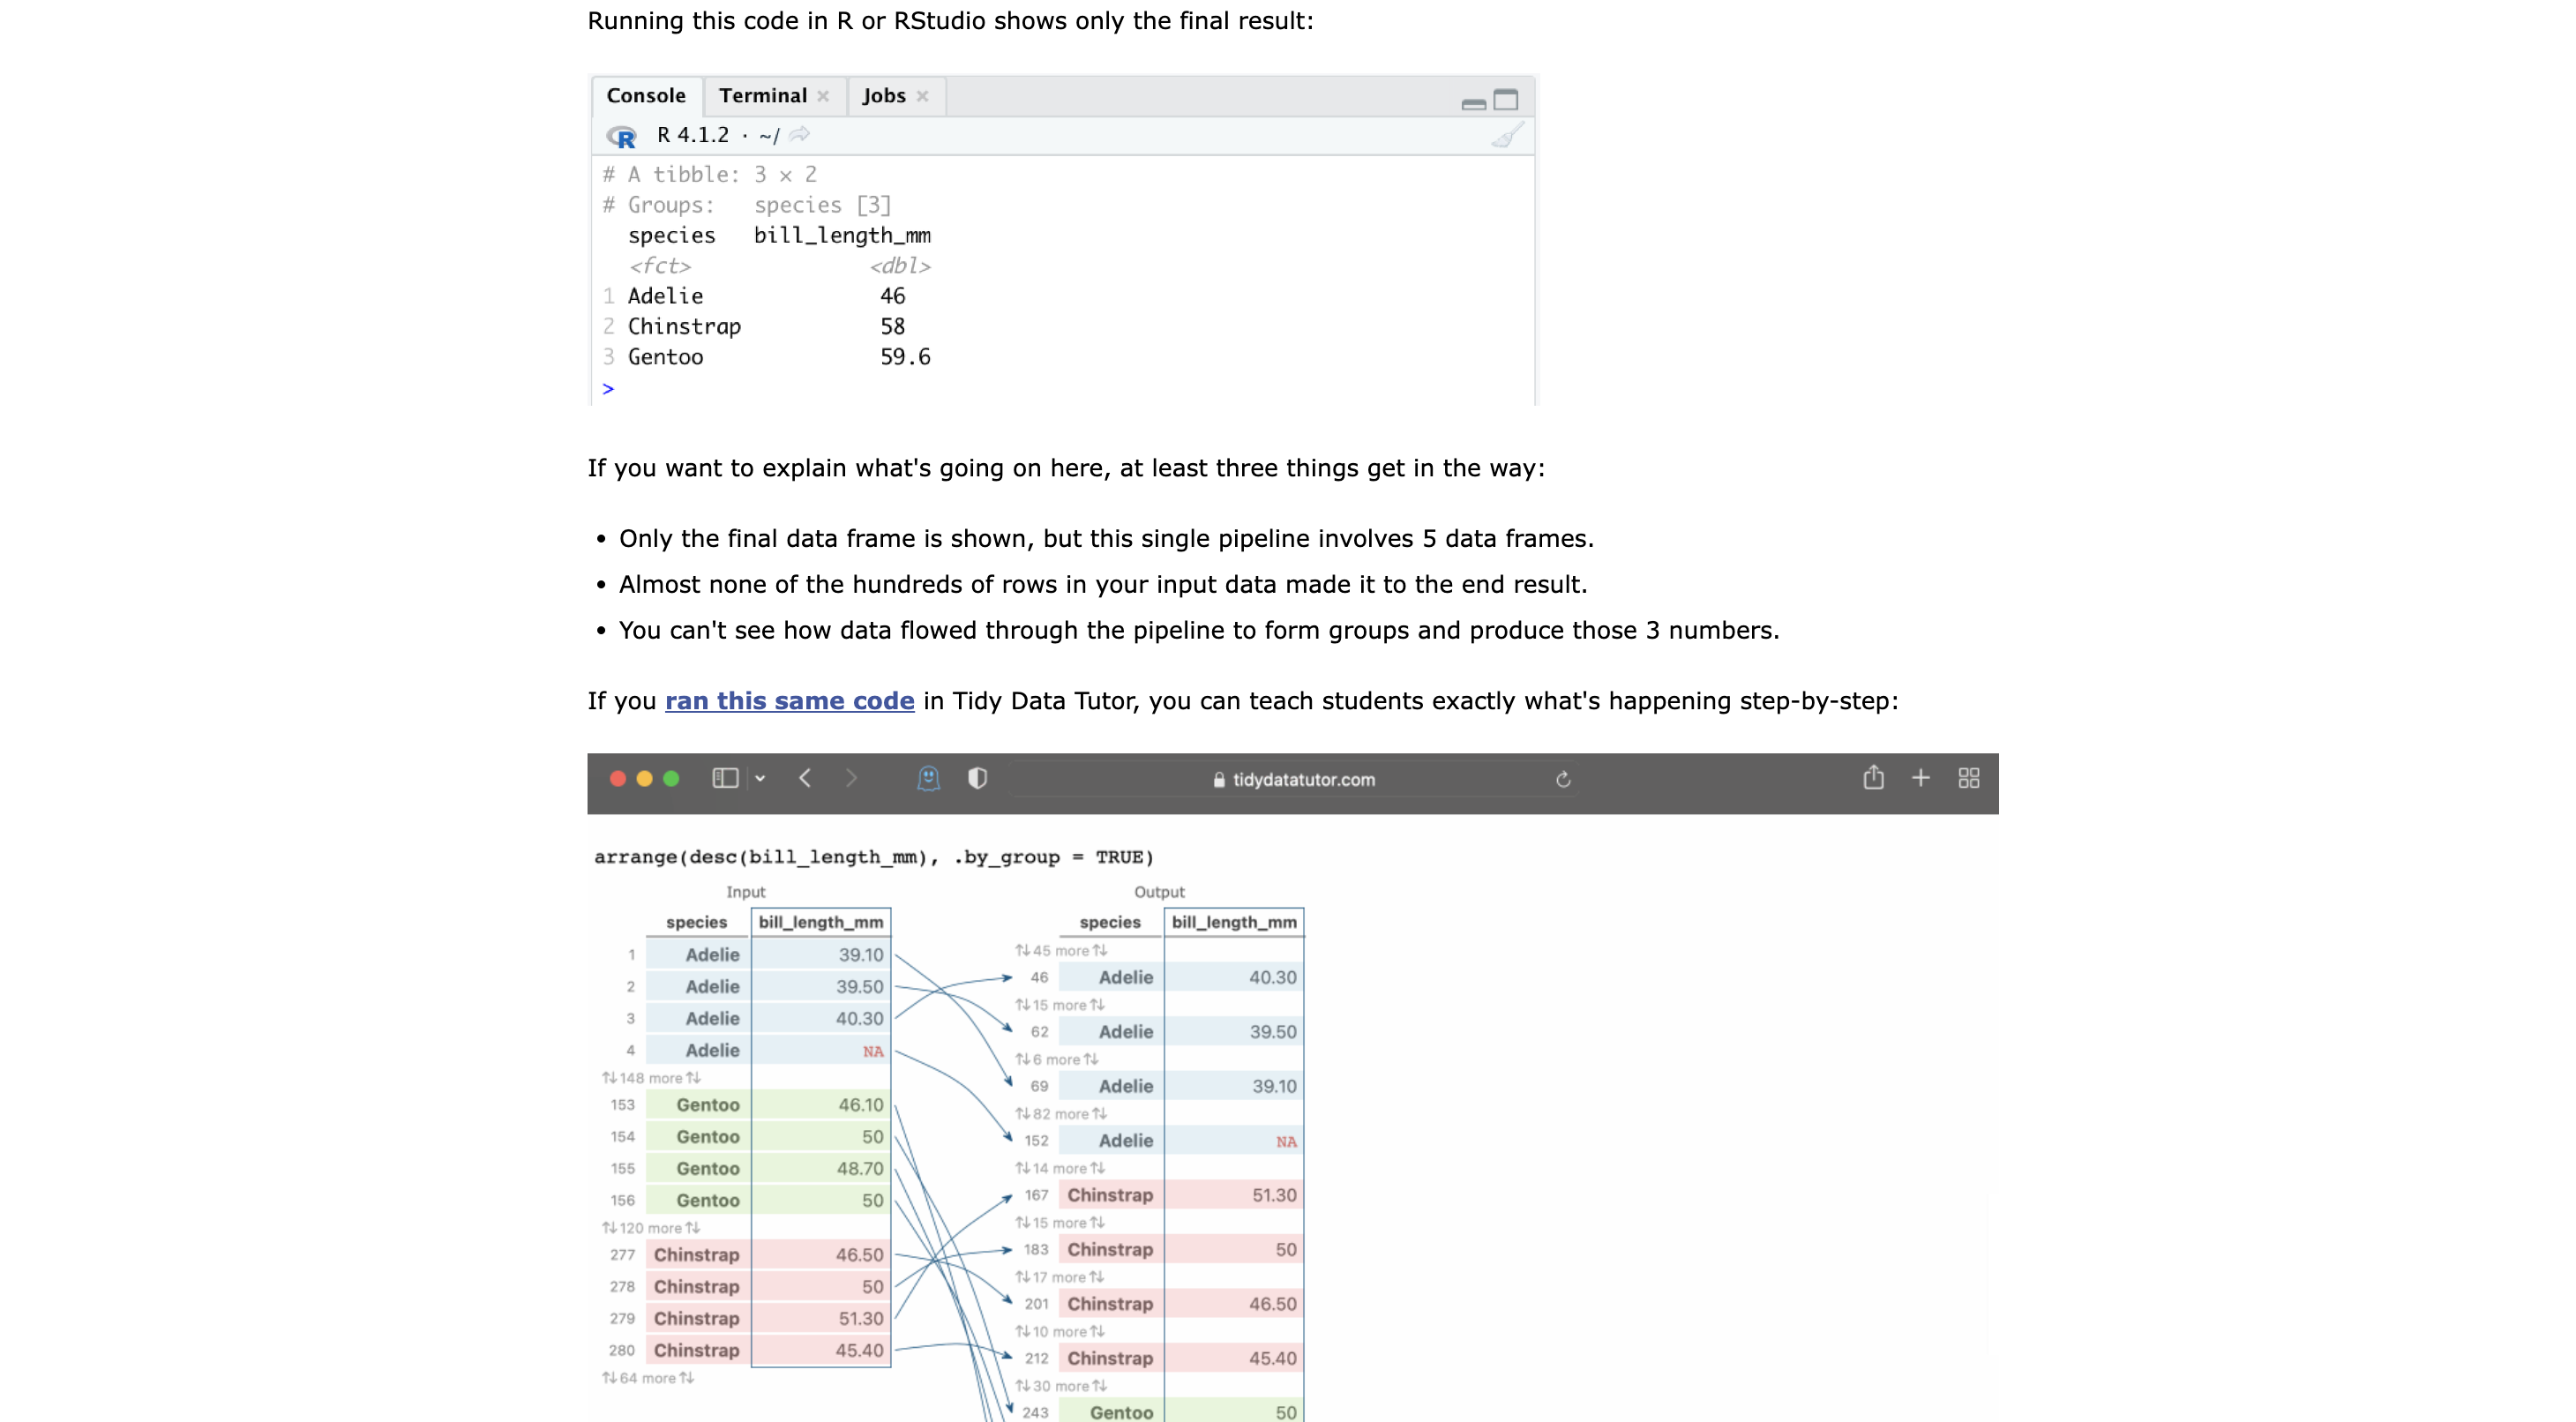
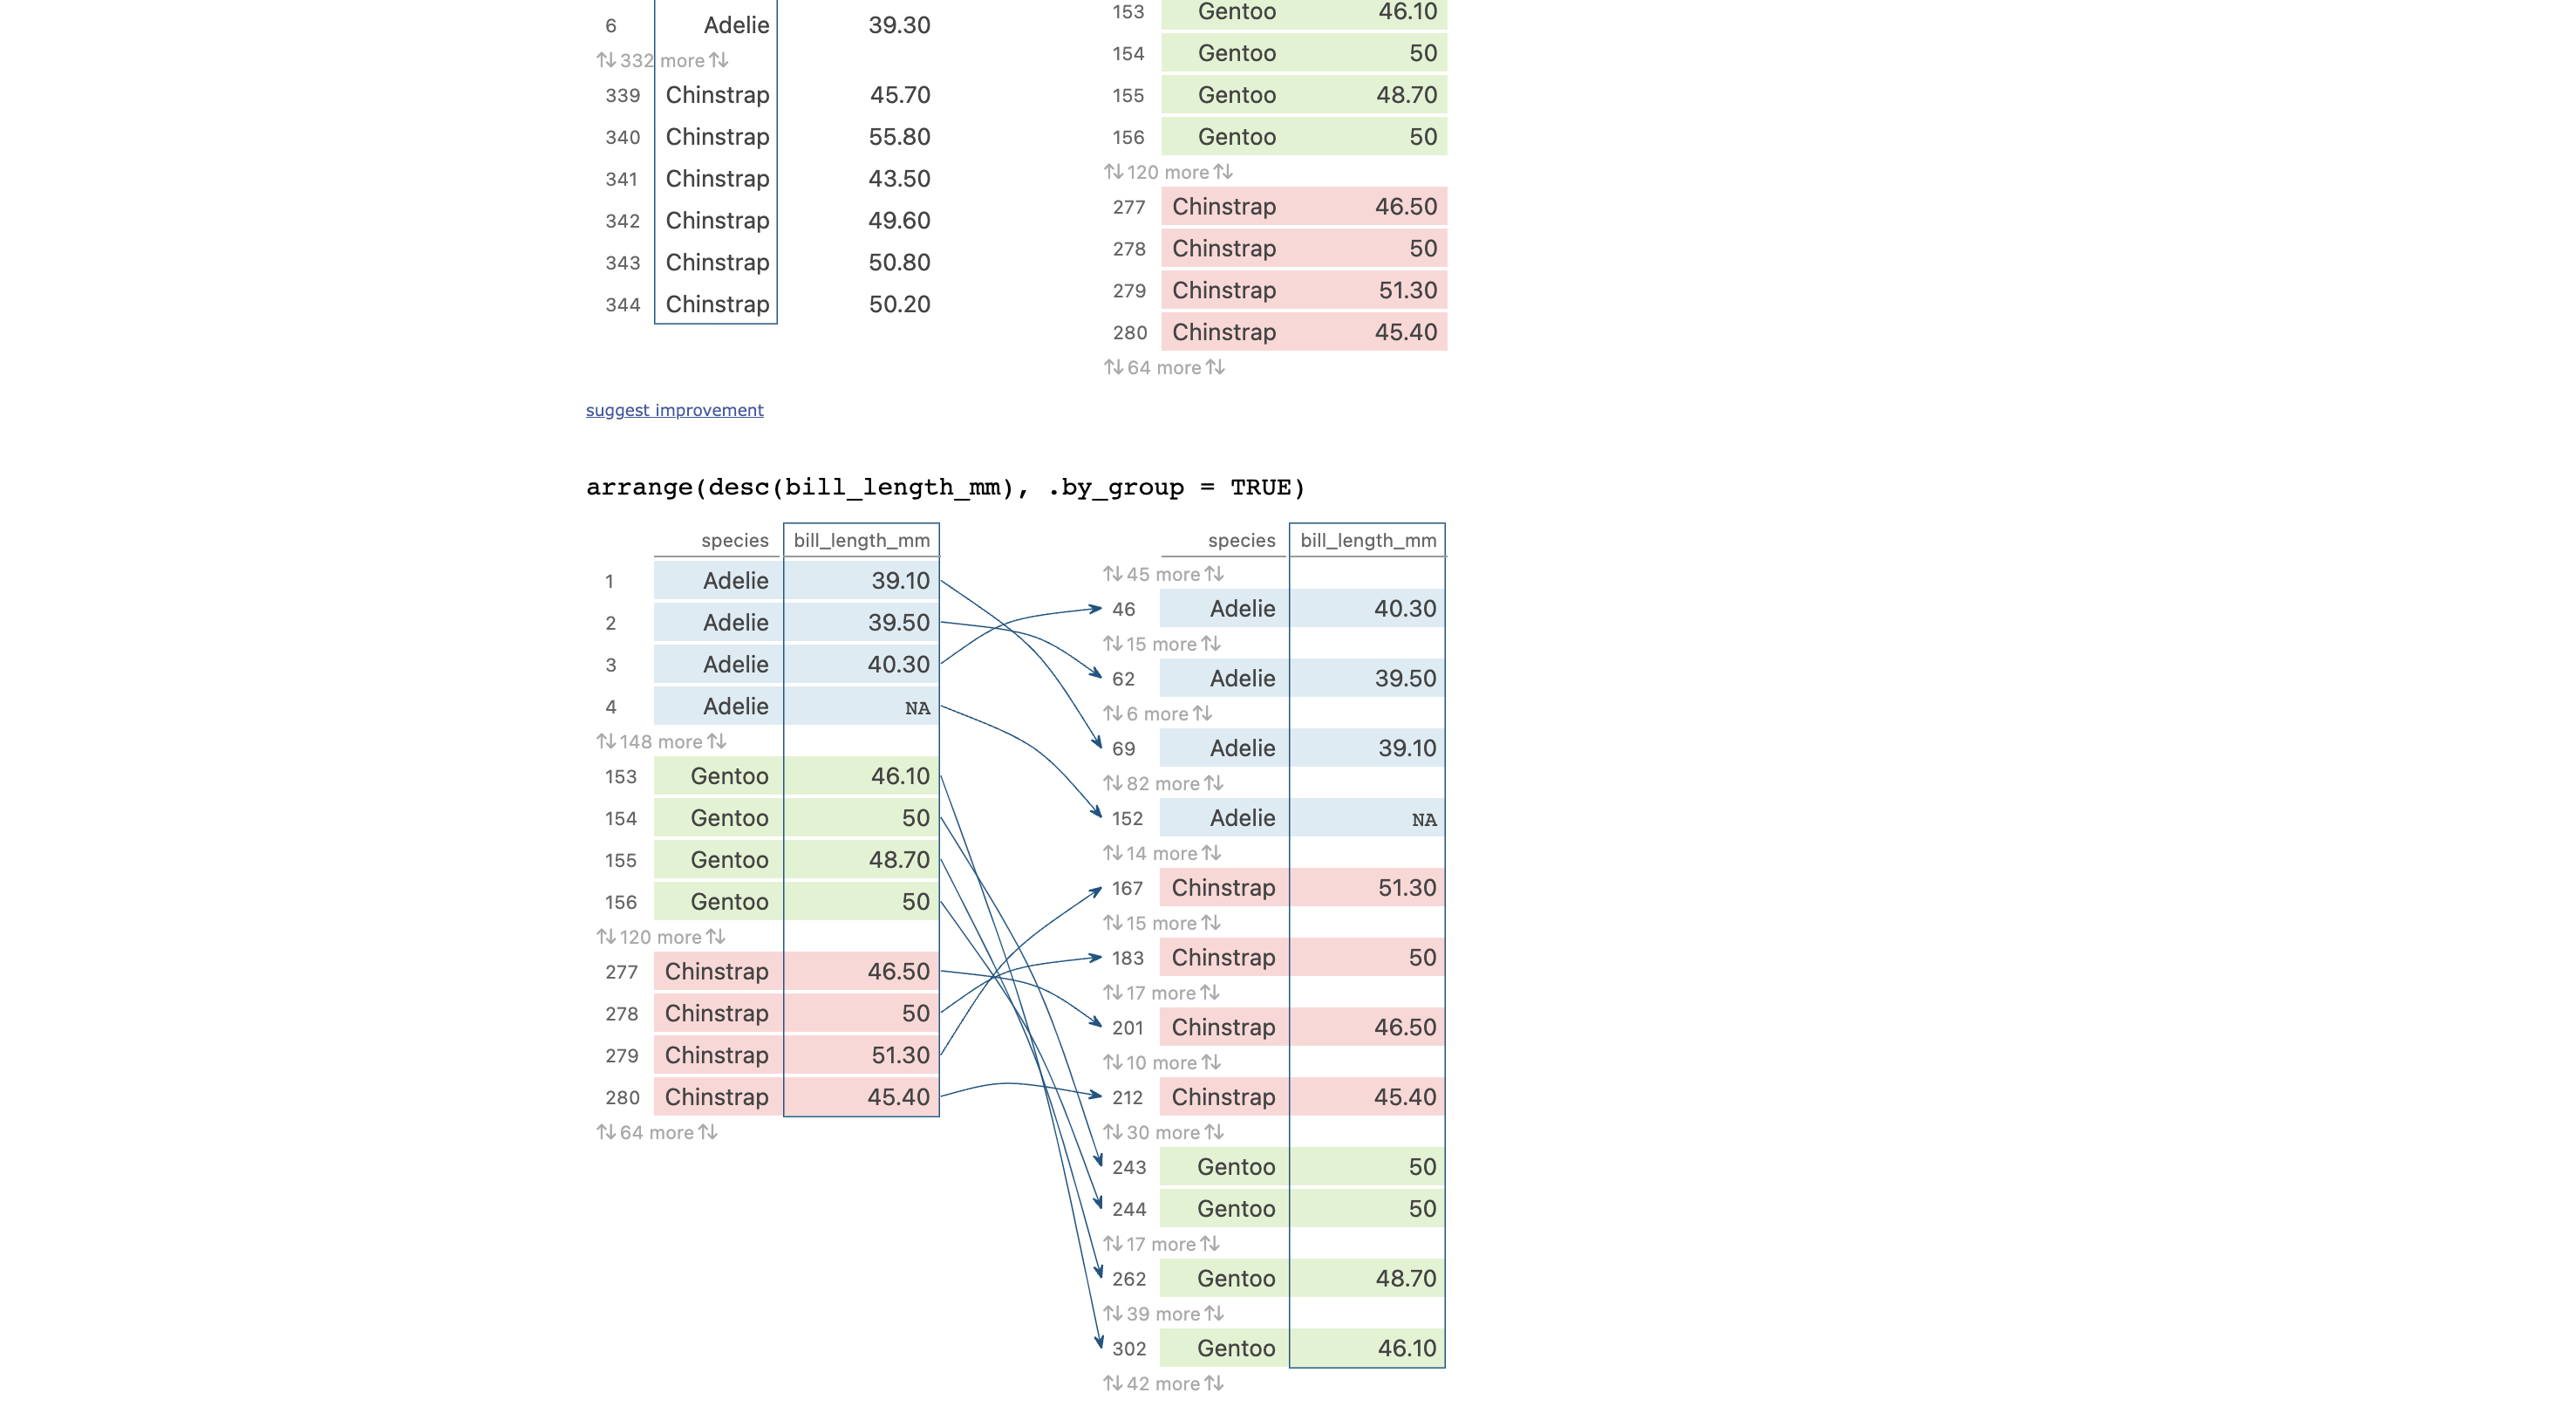
54.1.3 3. TidyData Tutor
Link: https://tidydatatutor.com/
Similar to Pandas Tutor, Tidy Data Tutor lets you write R code in the browser and helps visualize how the data frame changes at each step of a data analysis pipeline.
54.2 Probability and Statistics
54.2.1 1. Seeing Theory
Link: https://seeing-theory.brown.edu/
Seeing Theory was created by an undergraduate student at Brown University with the aim of making statistics more accessible through interactive visualizations. Seeing theory breaks down statistical concepts into 6 chapters:
-
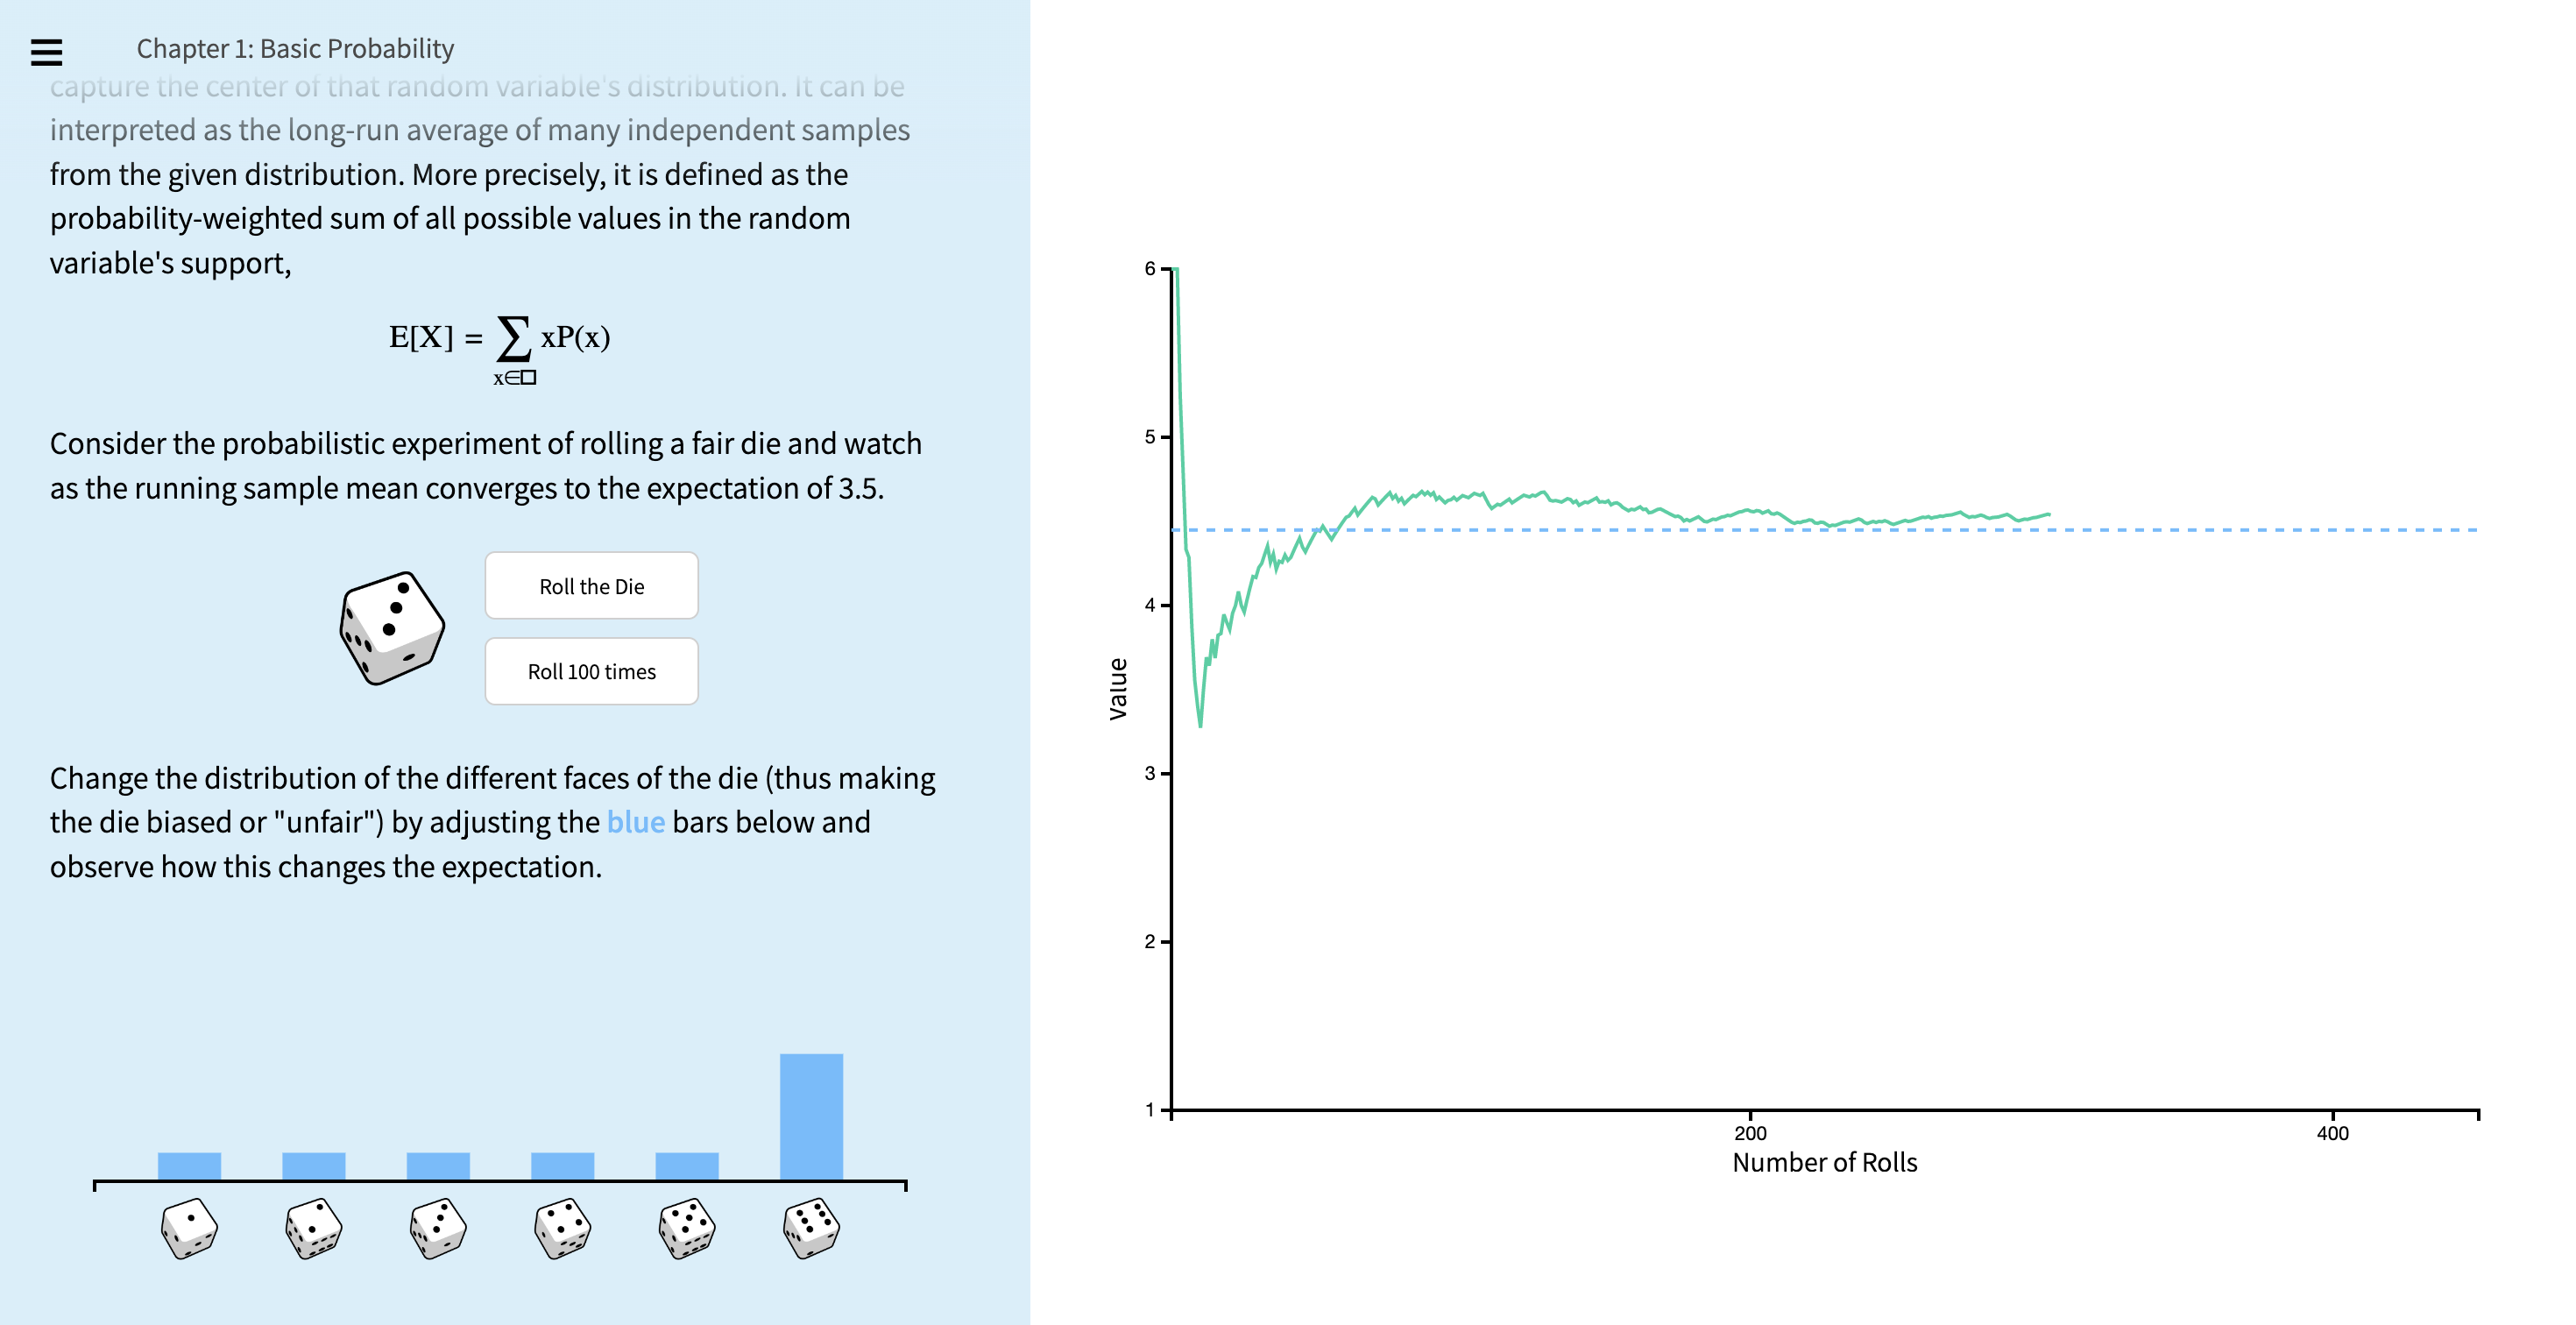
Basic Probability - An introduction to the basic concepts of probability theory.
Chance Events, Expectation and Variance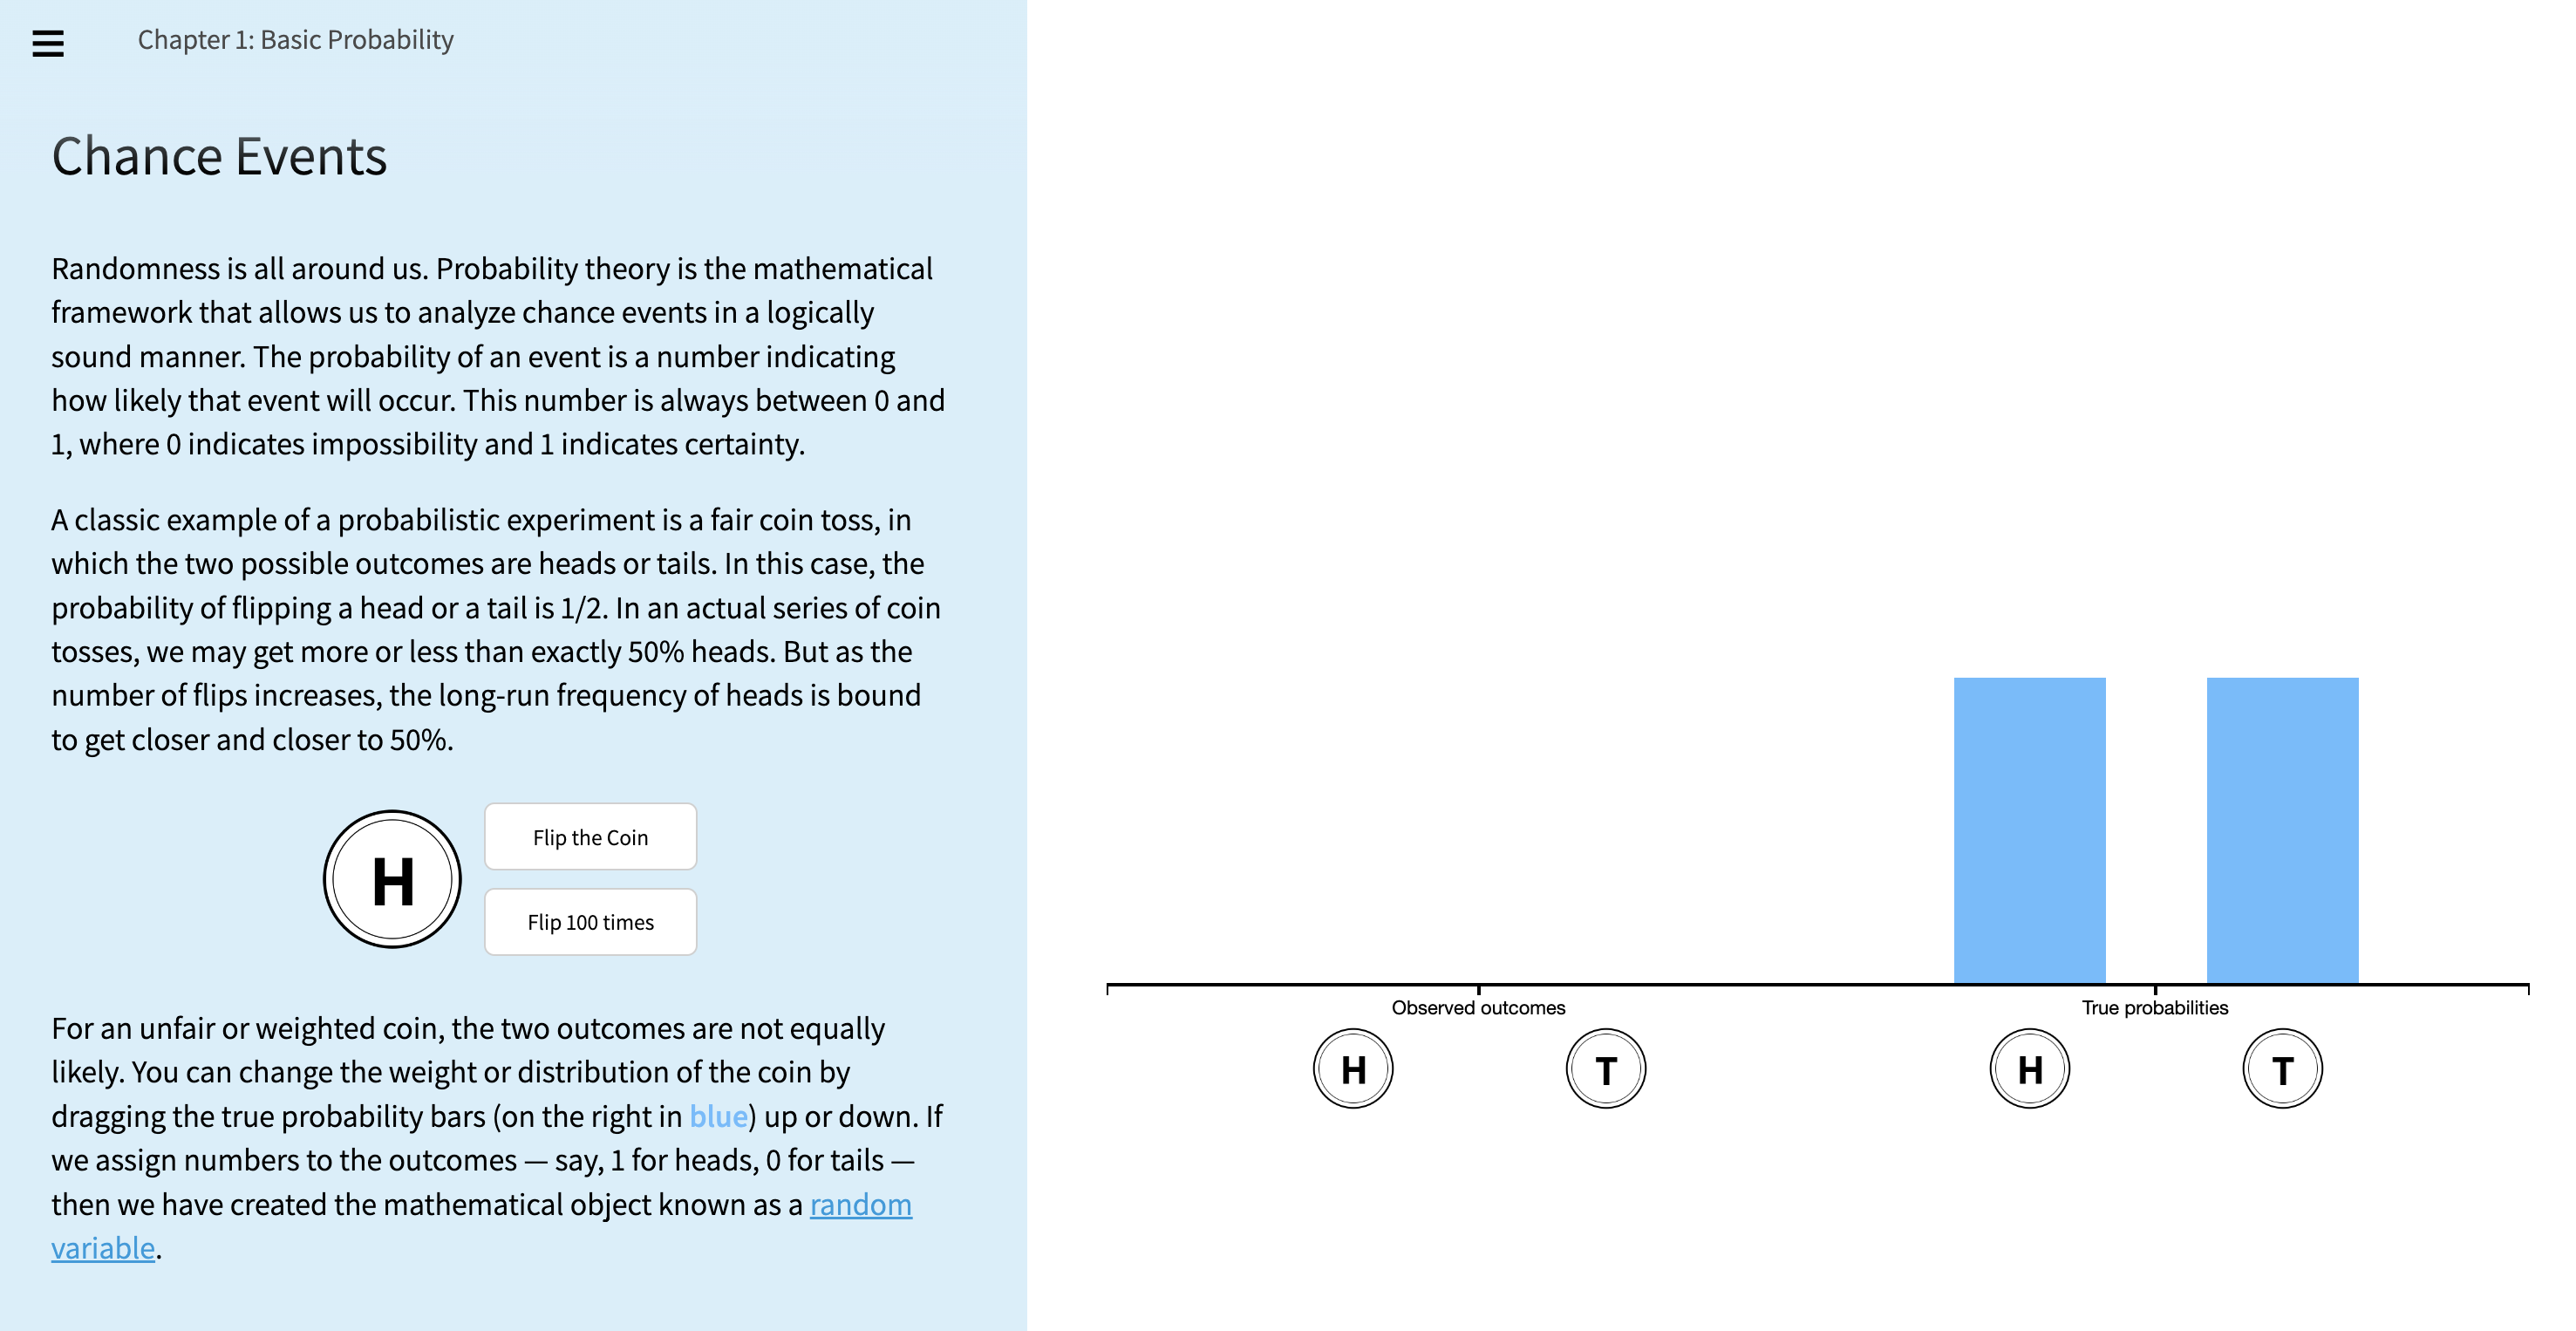
-
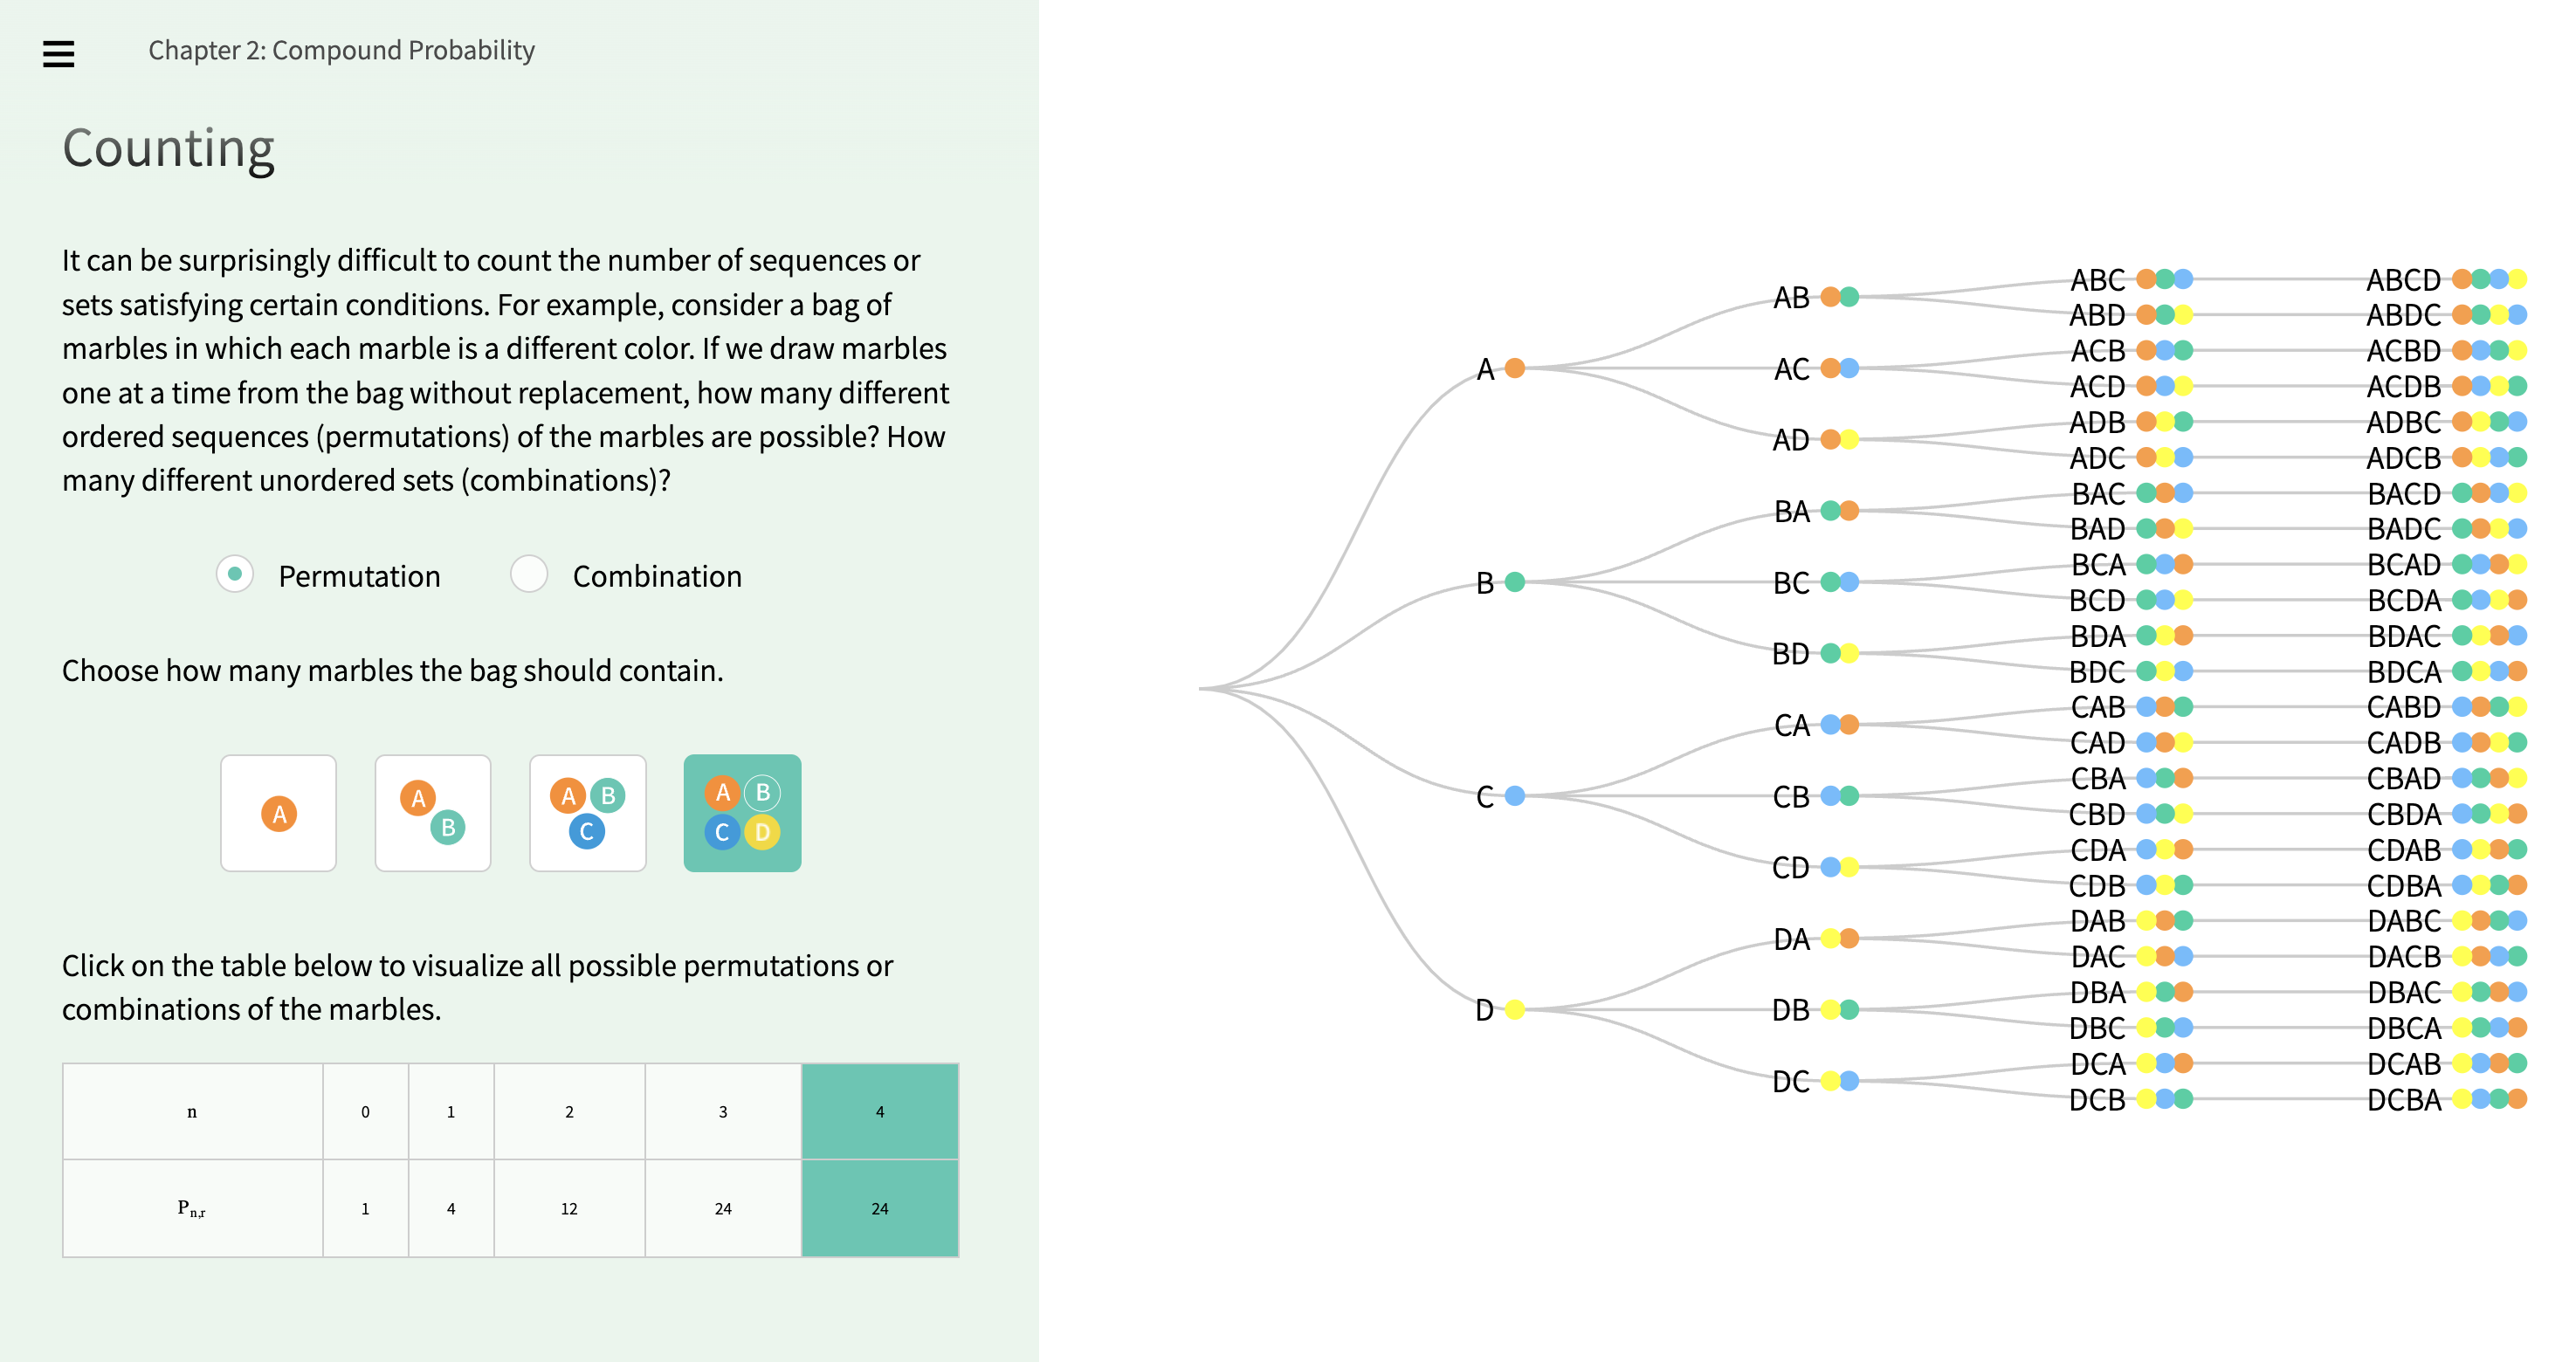
Compound Probability - Further discusses concepts that lie at the core of probability theory.
Set Theory, Counting, Conditional Probability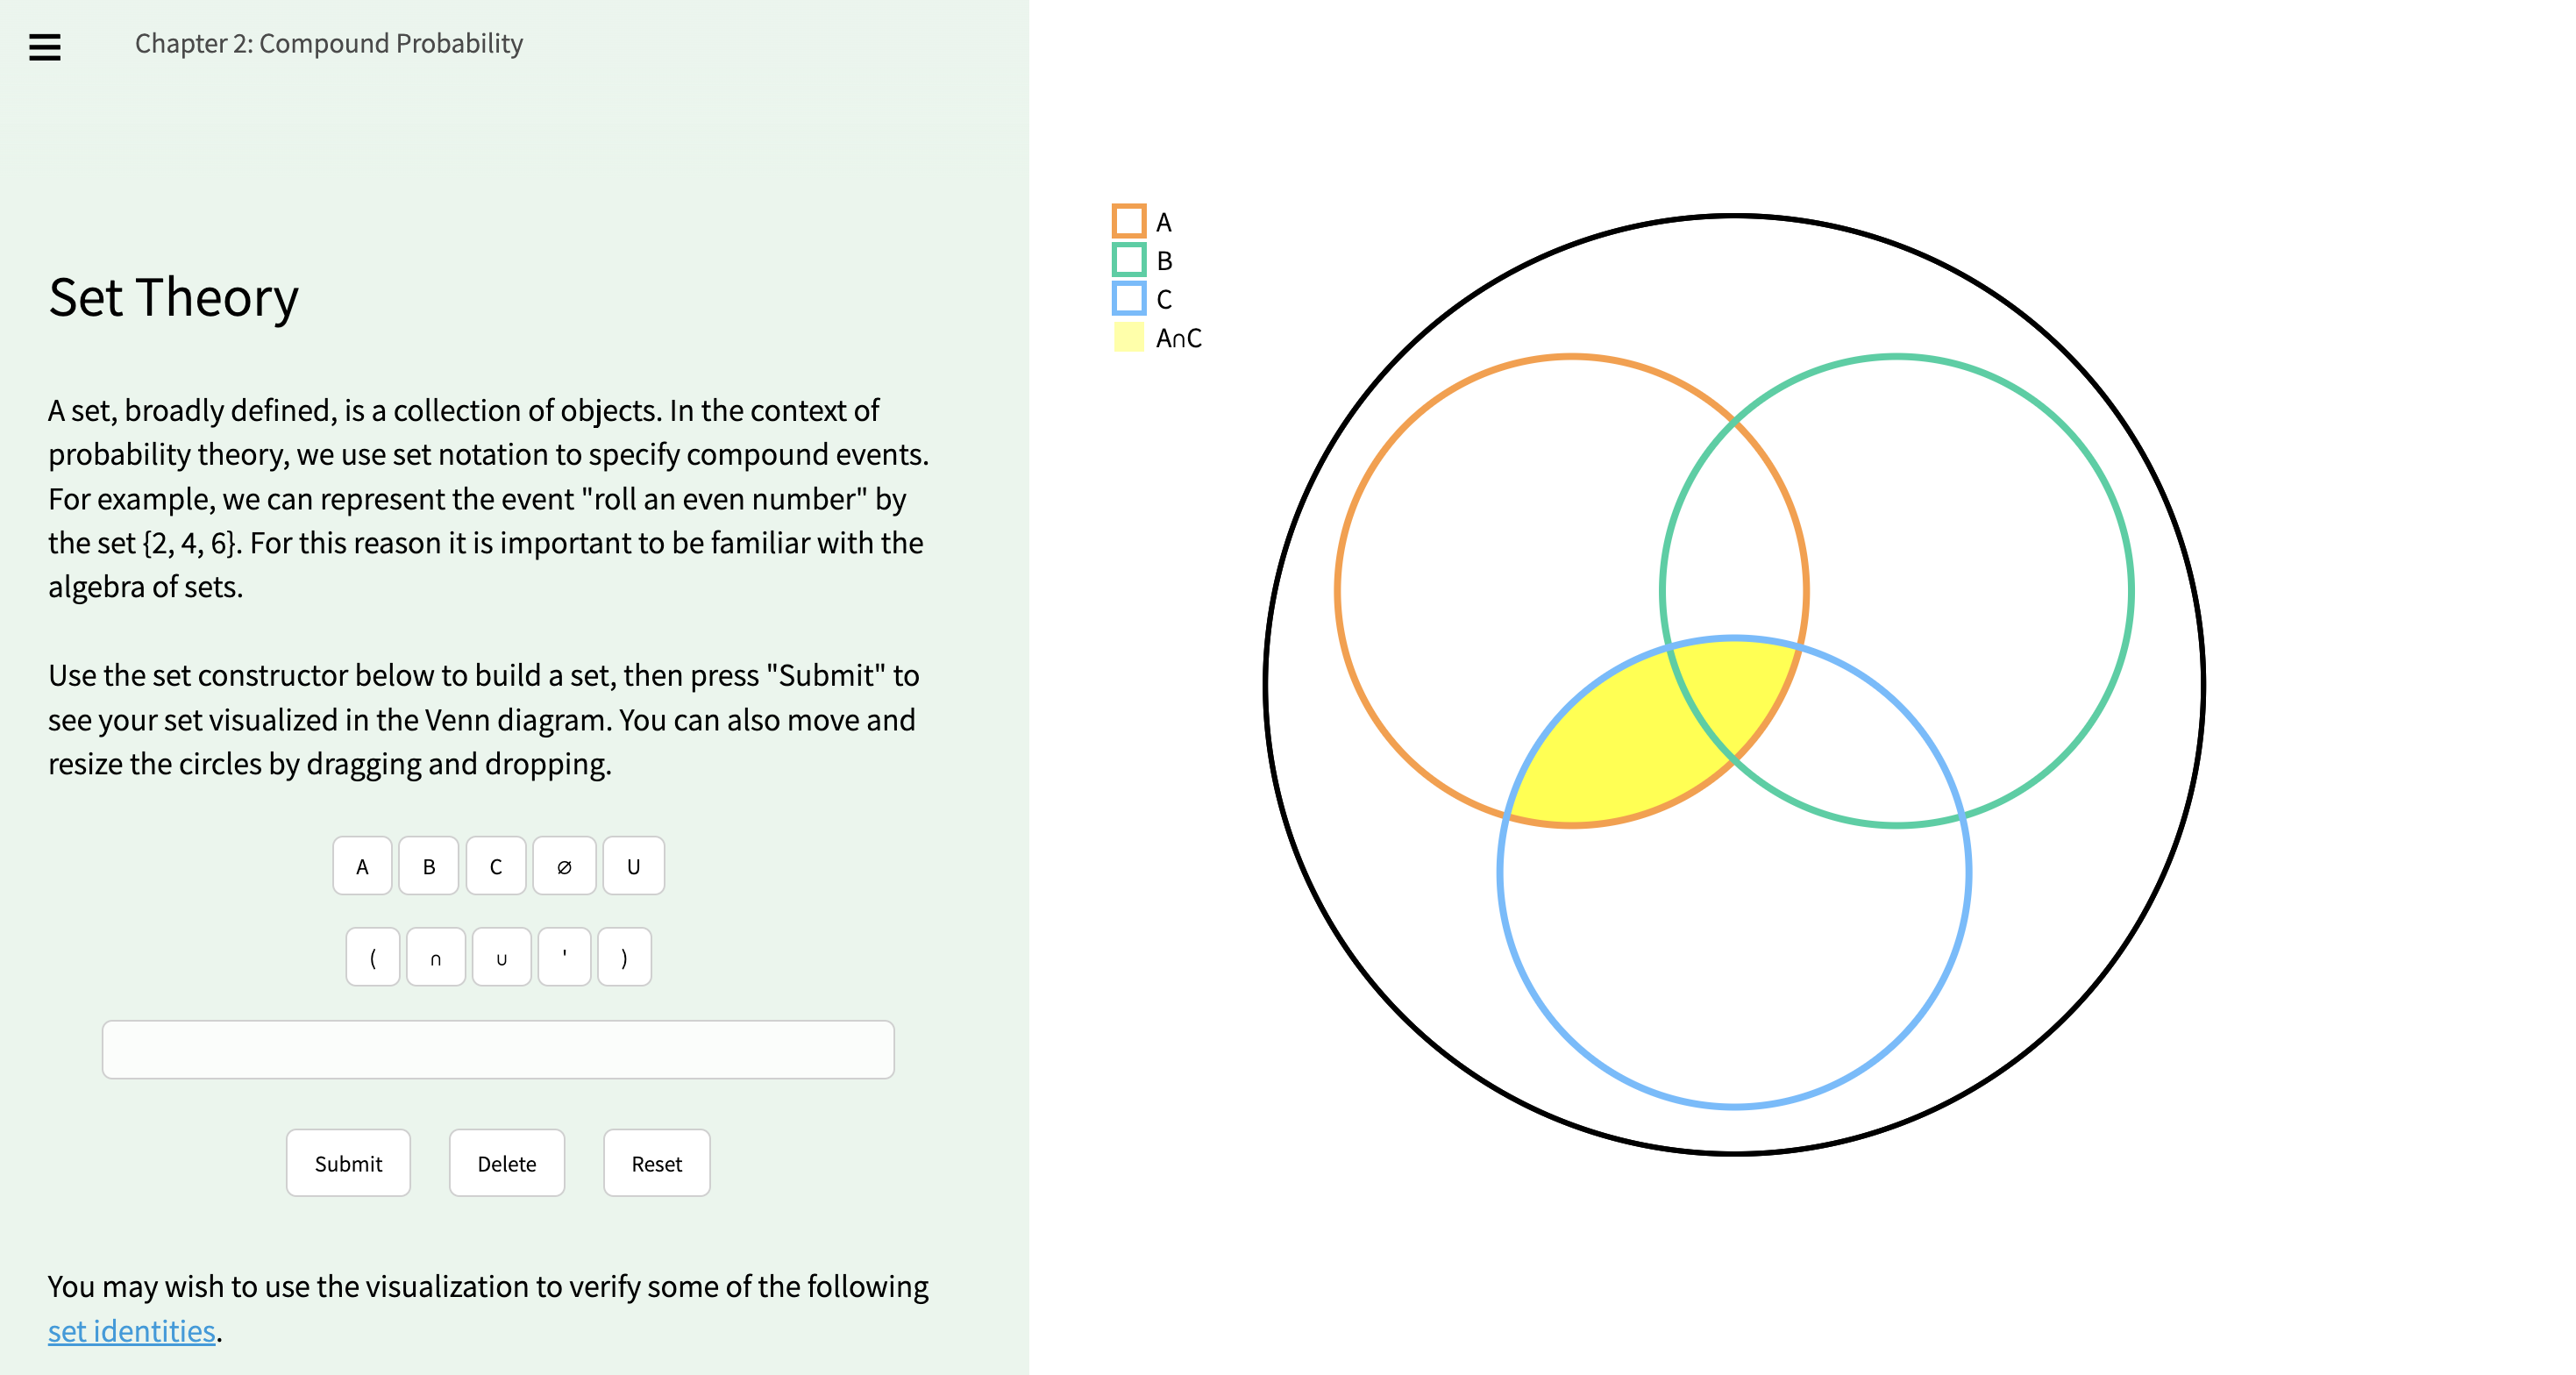
-
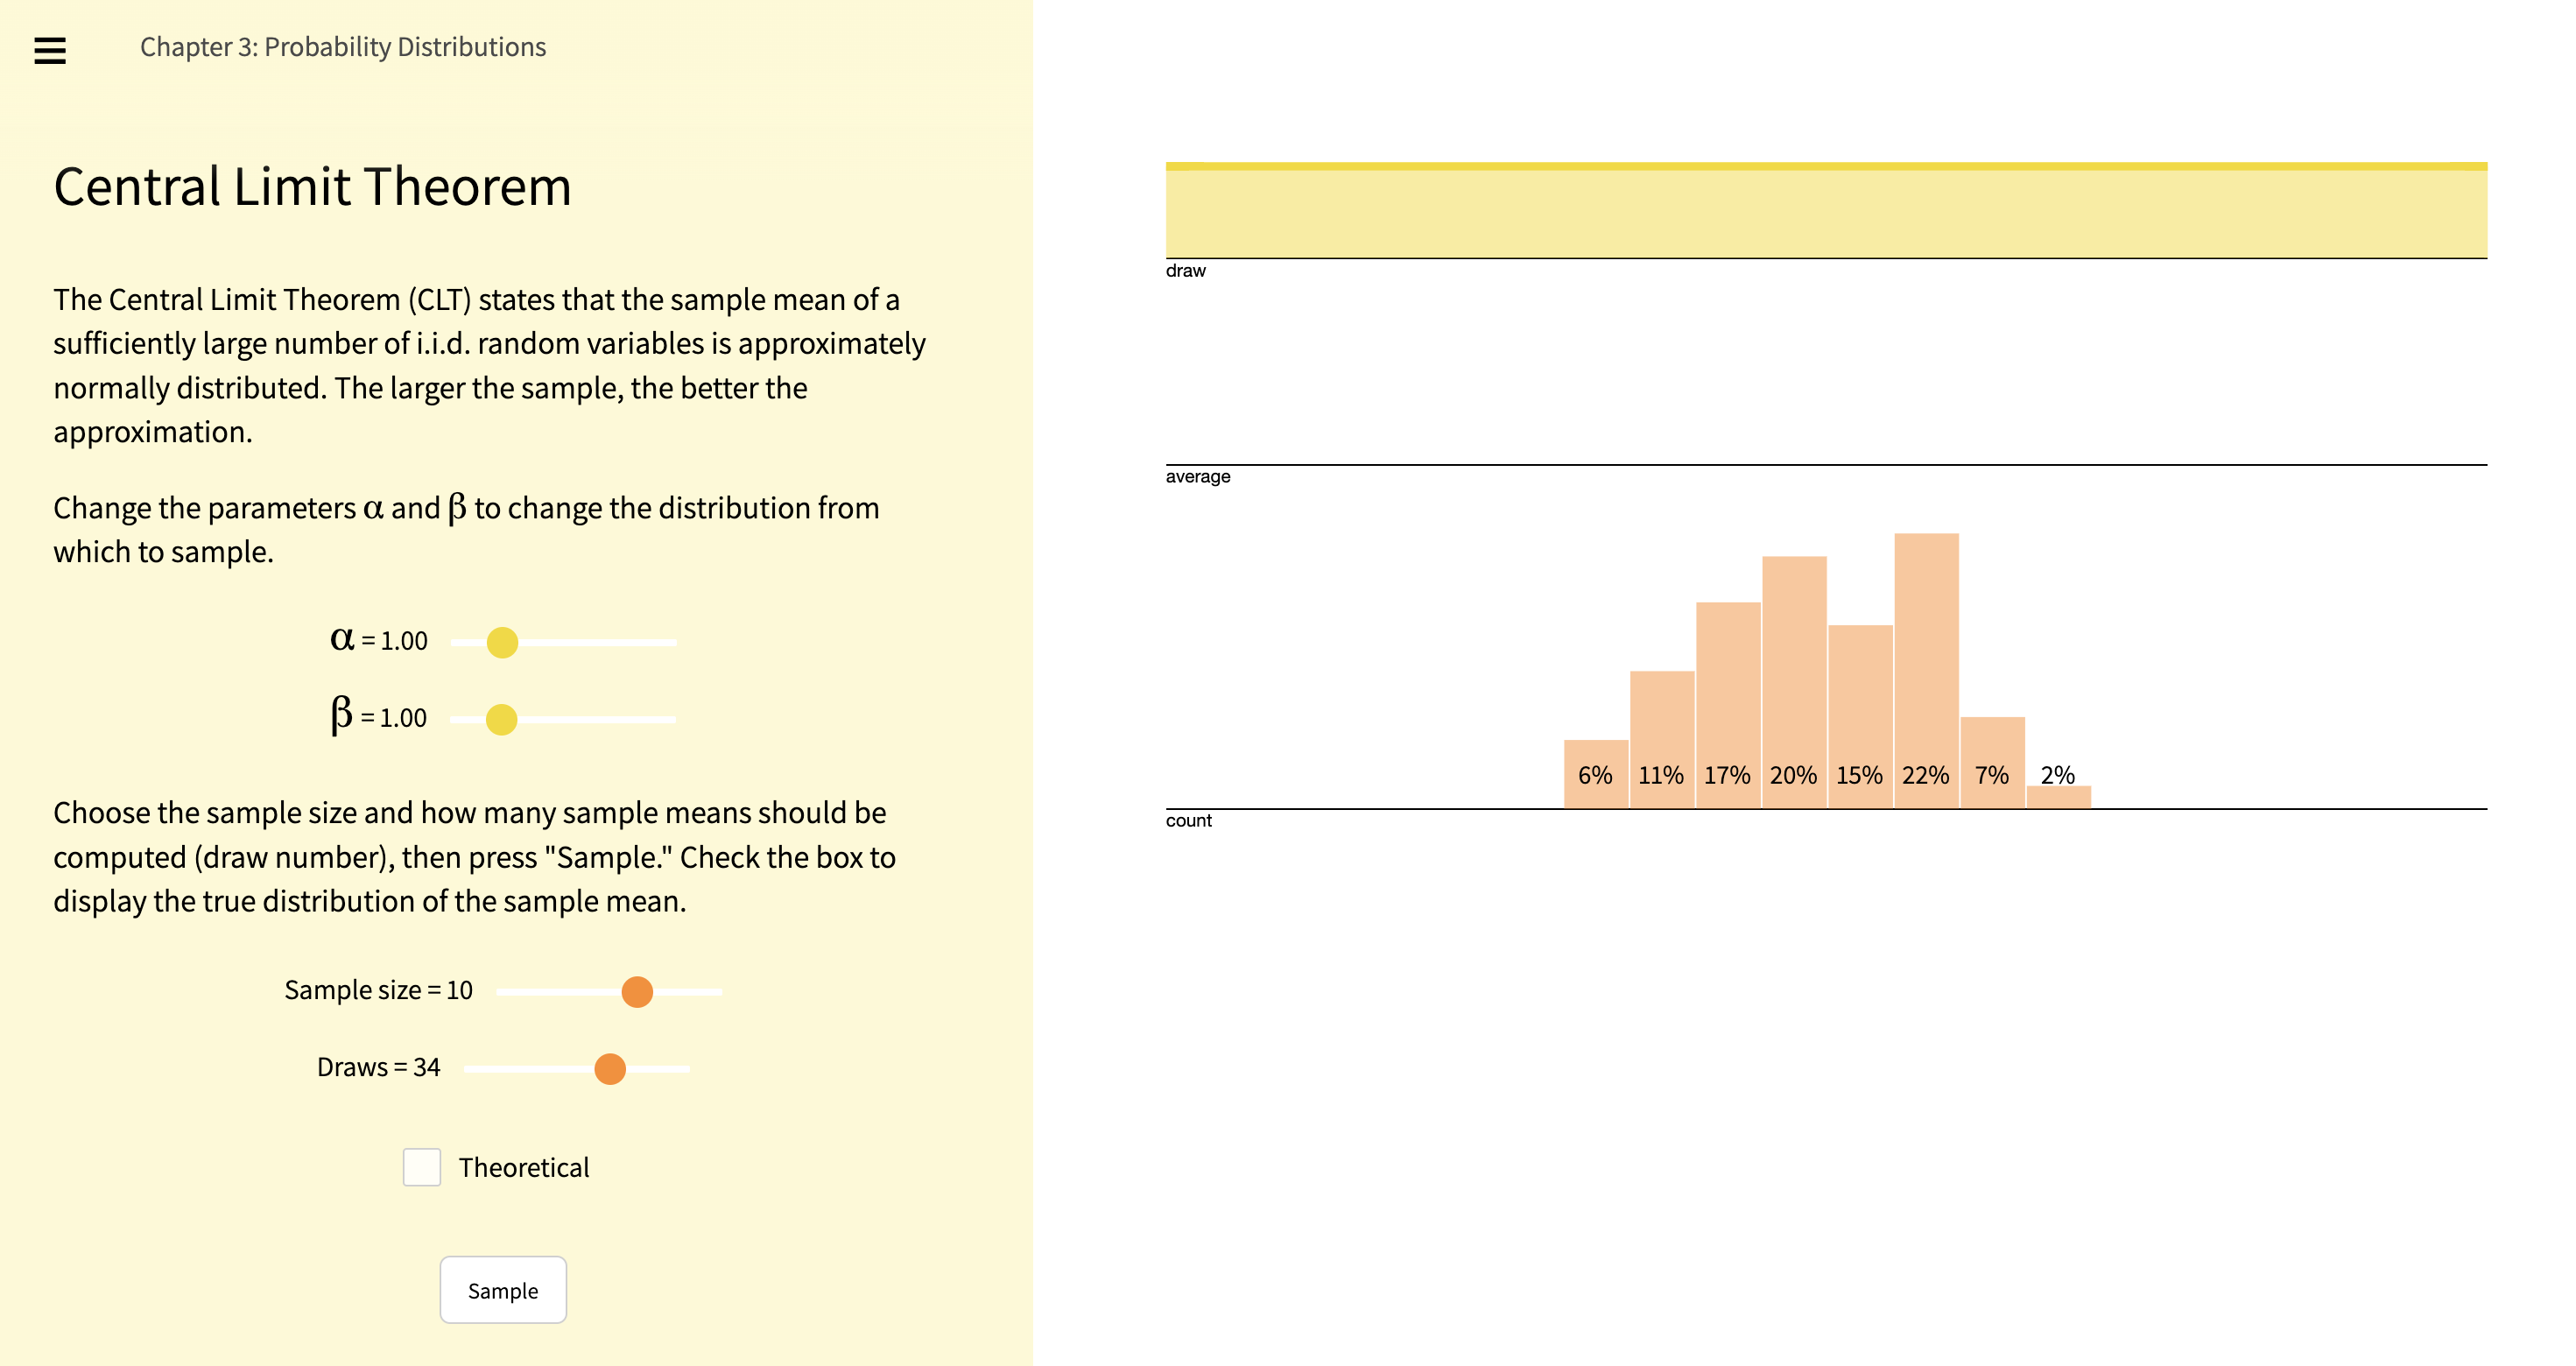
Probability Distributions - Specifies the relative likelihoods of all possible outcomes.
Random Variables, Discrete and Continuous, Central Limit Theorem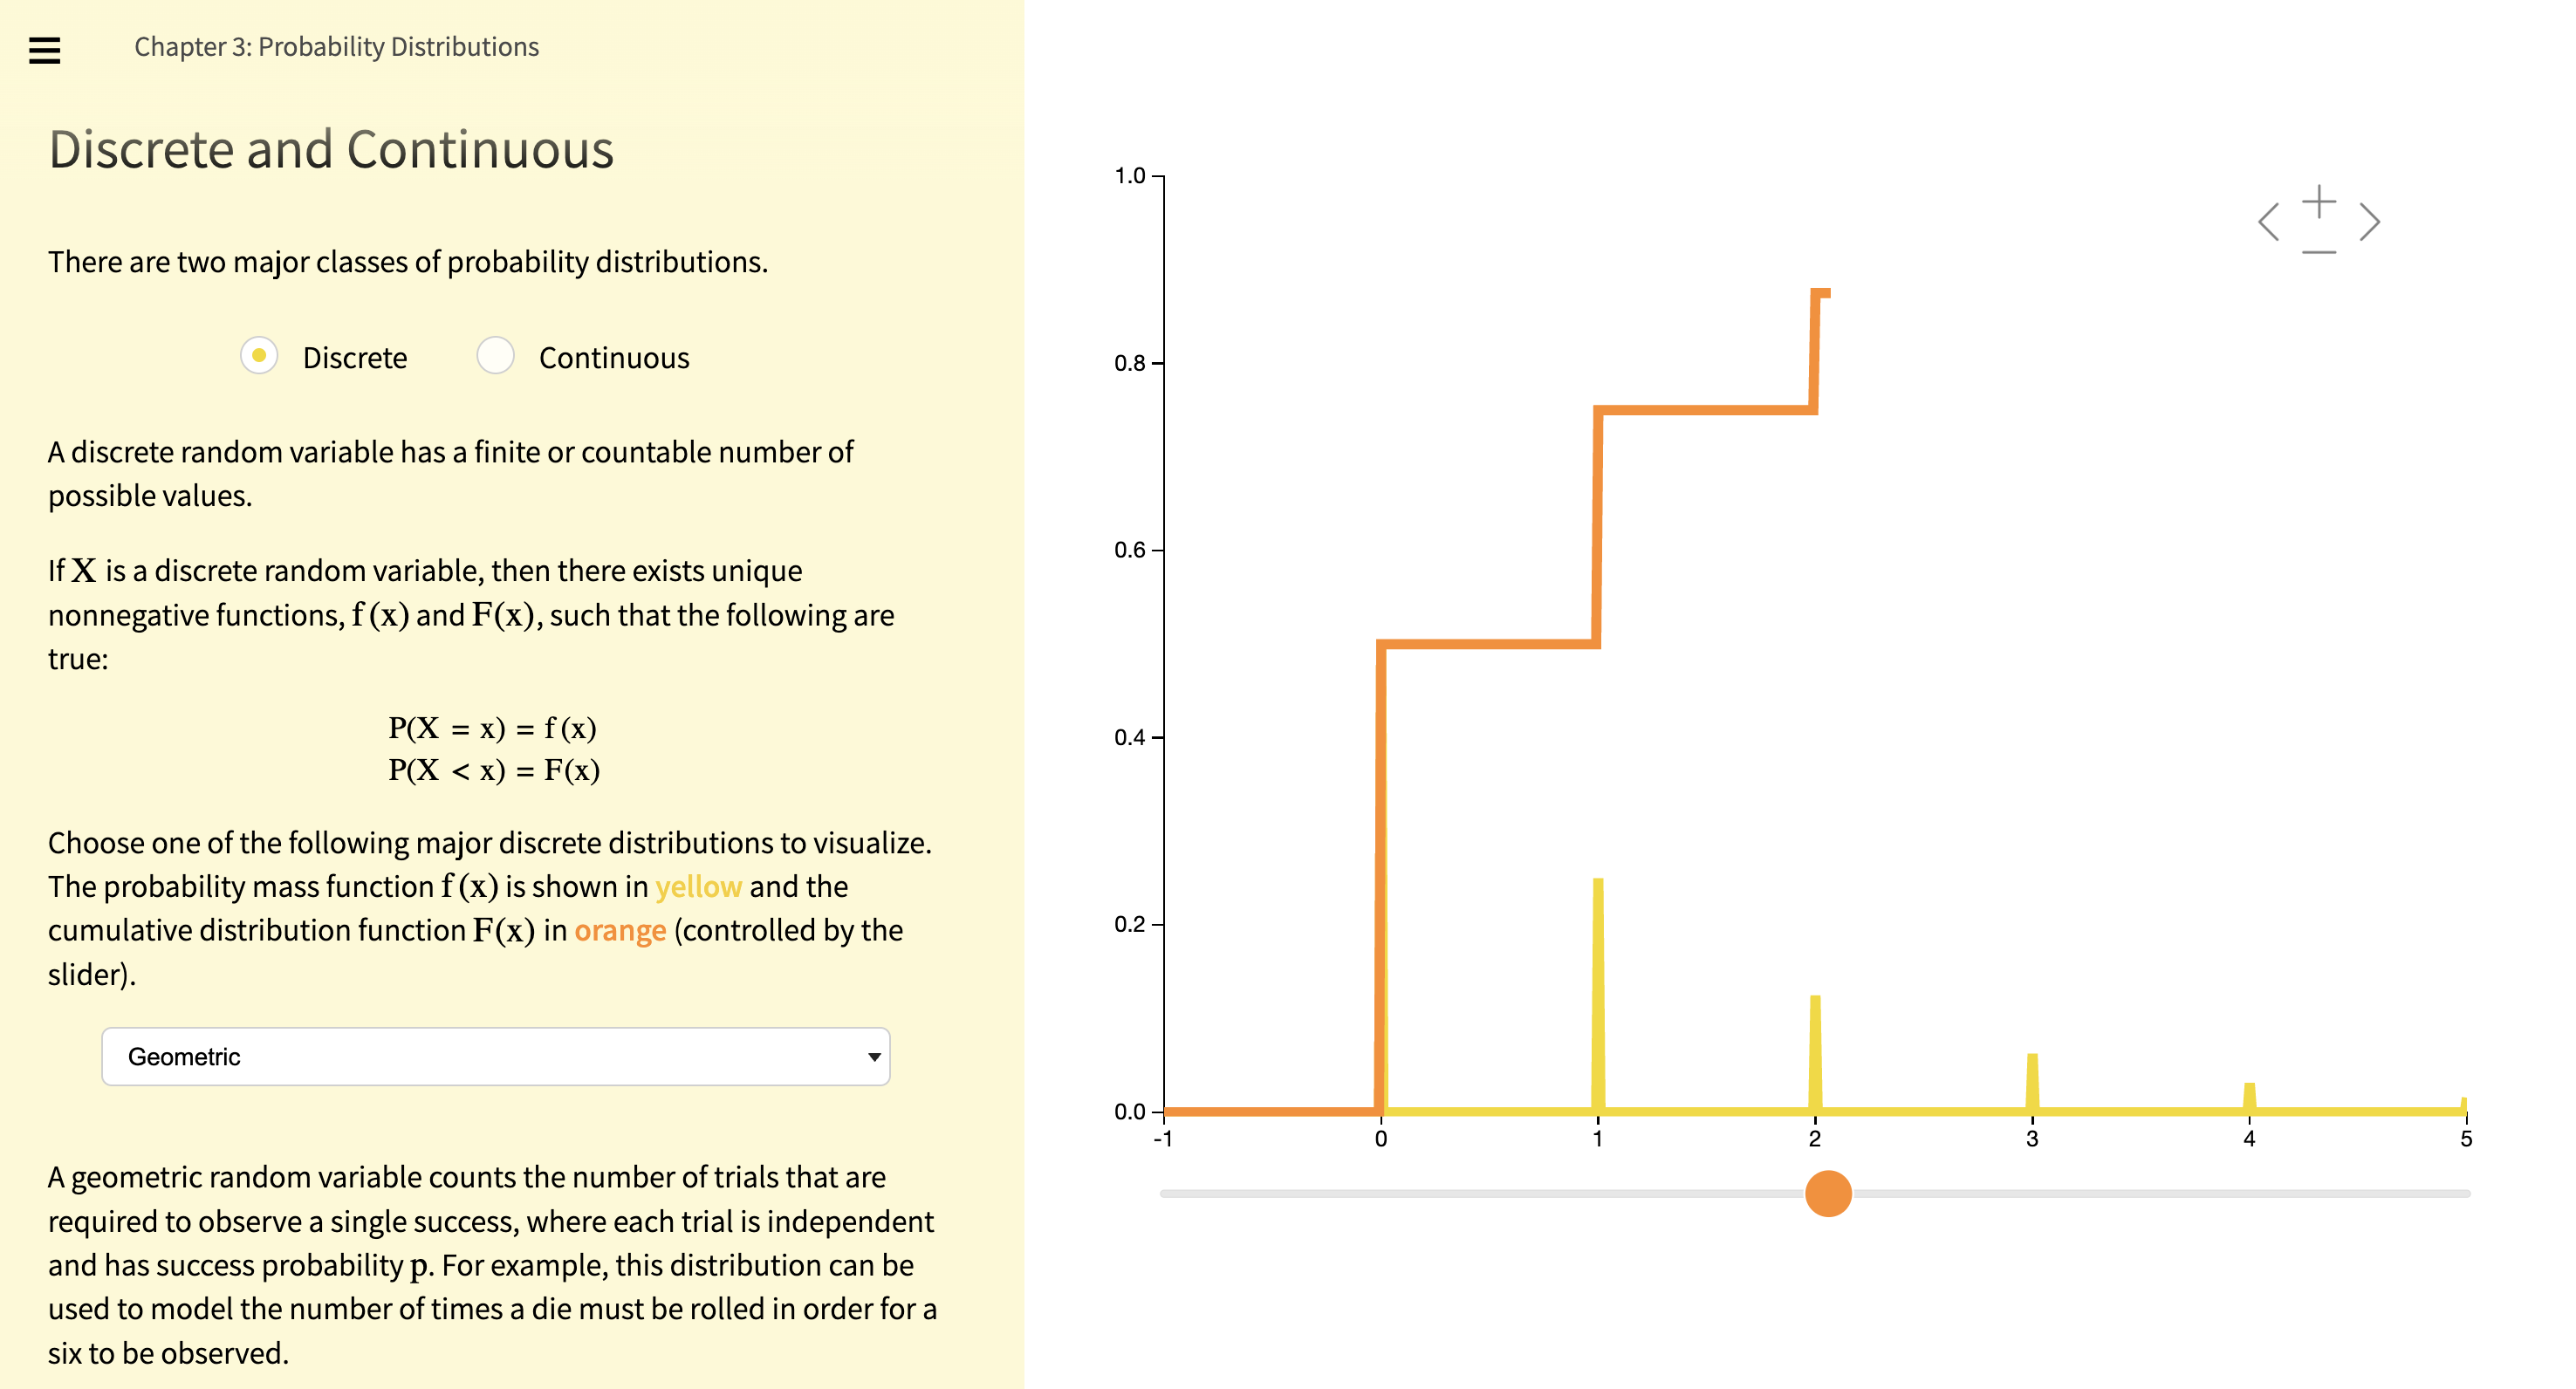
-
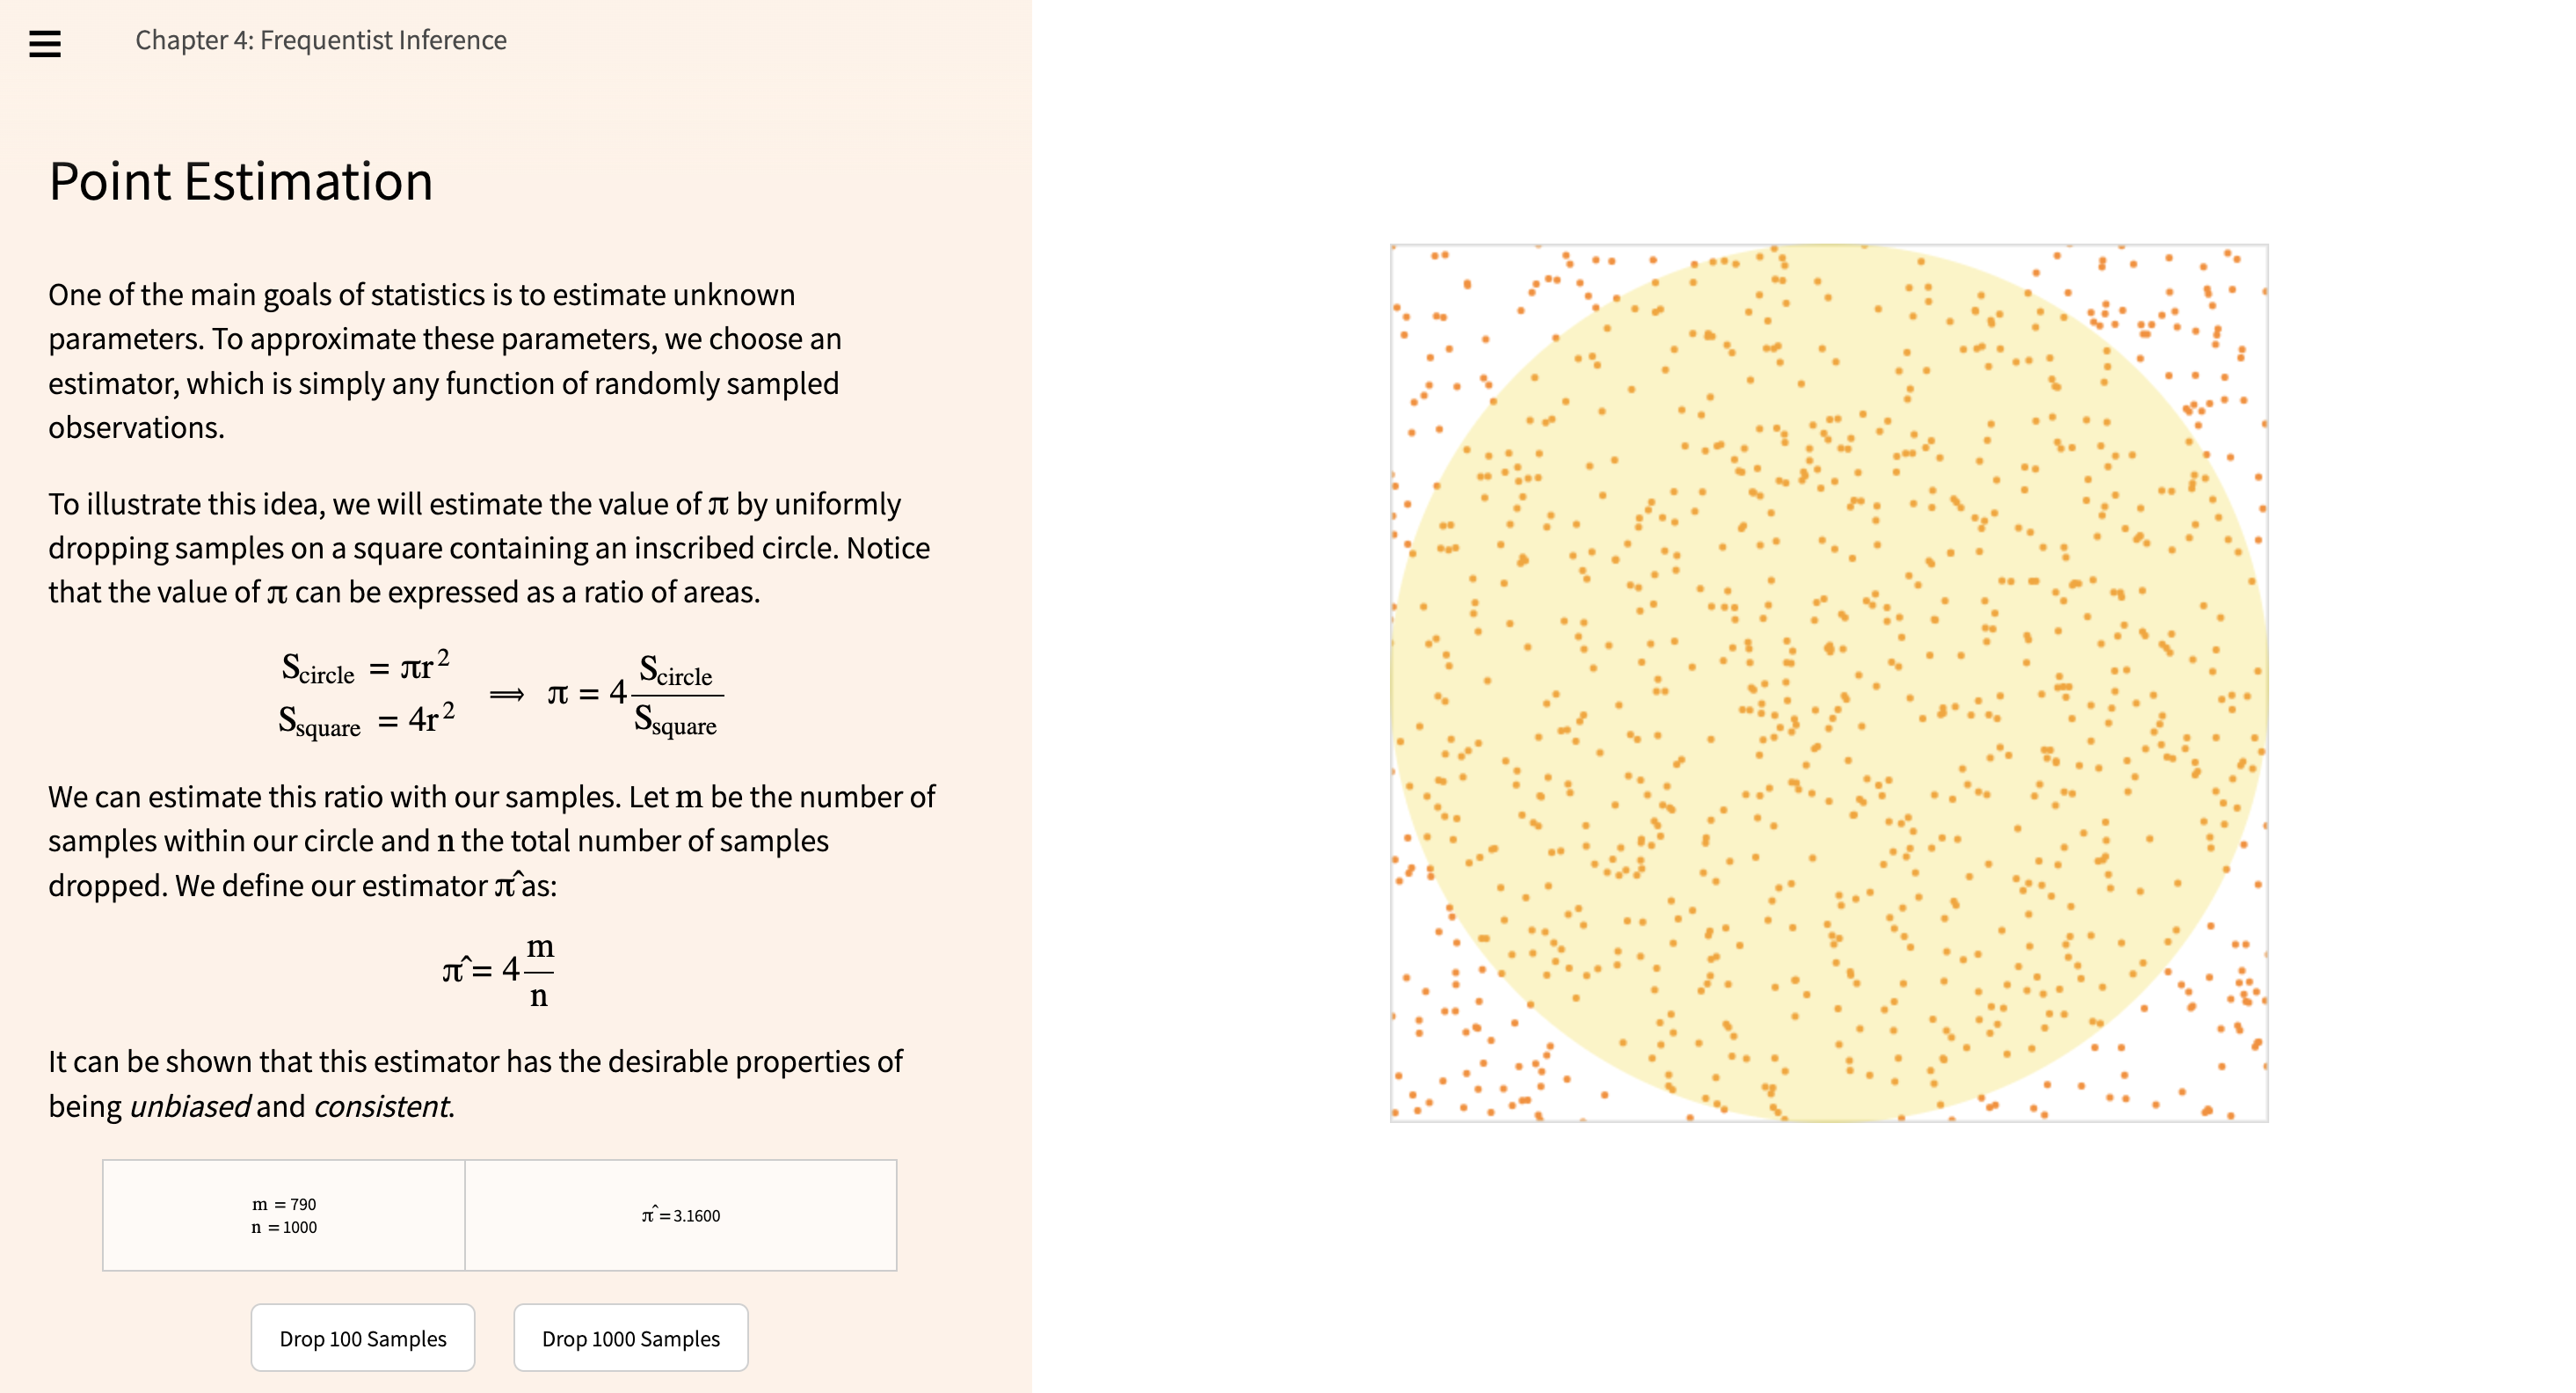
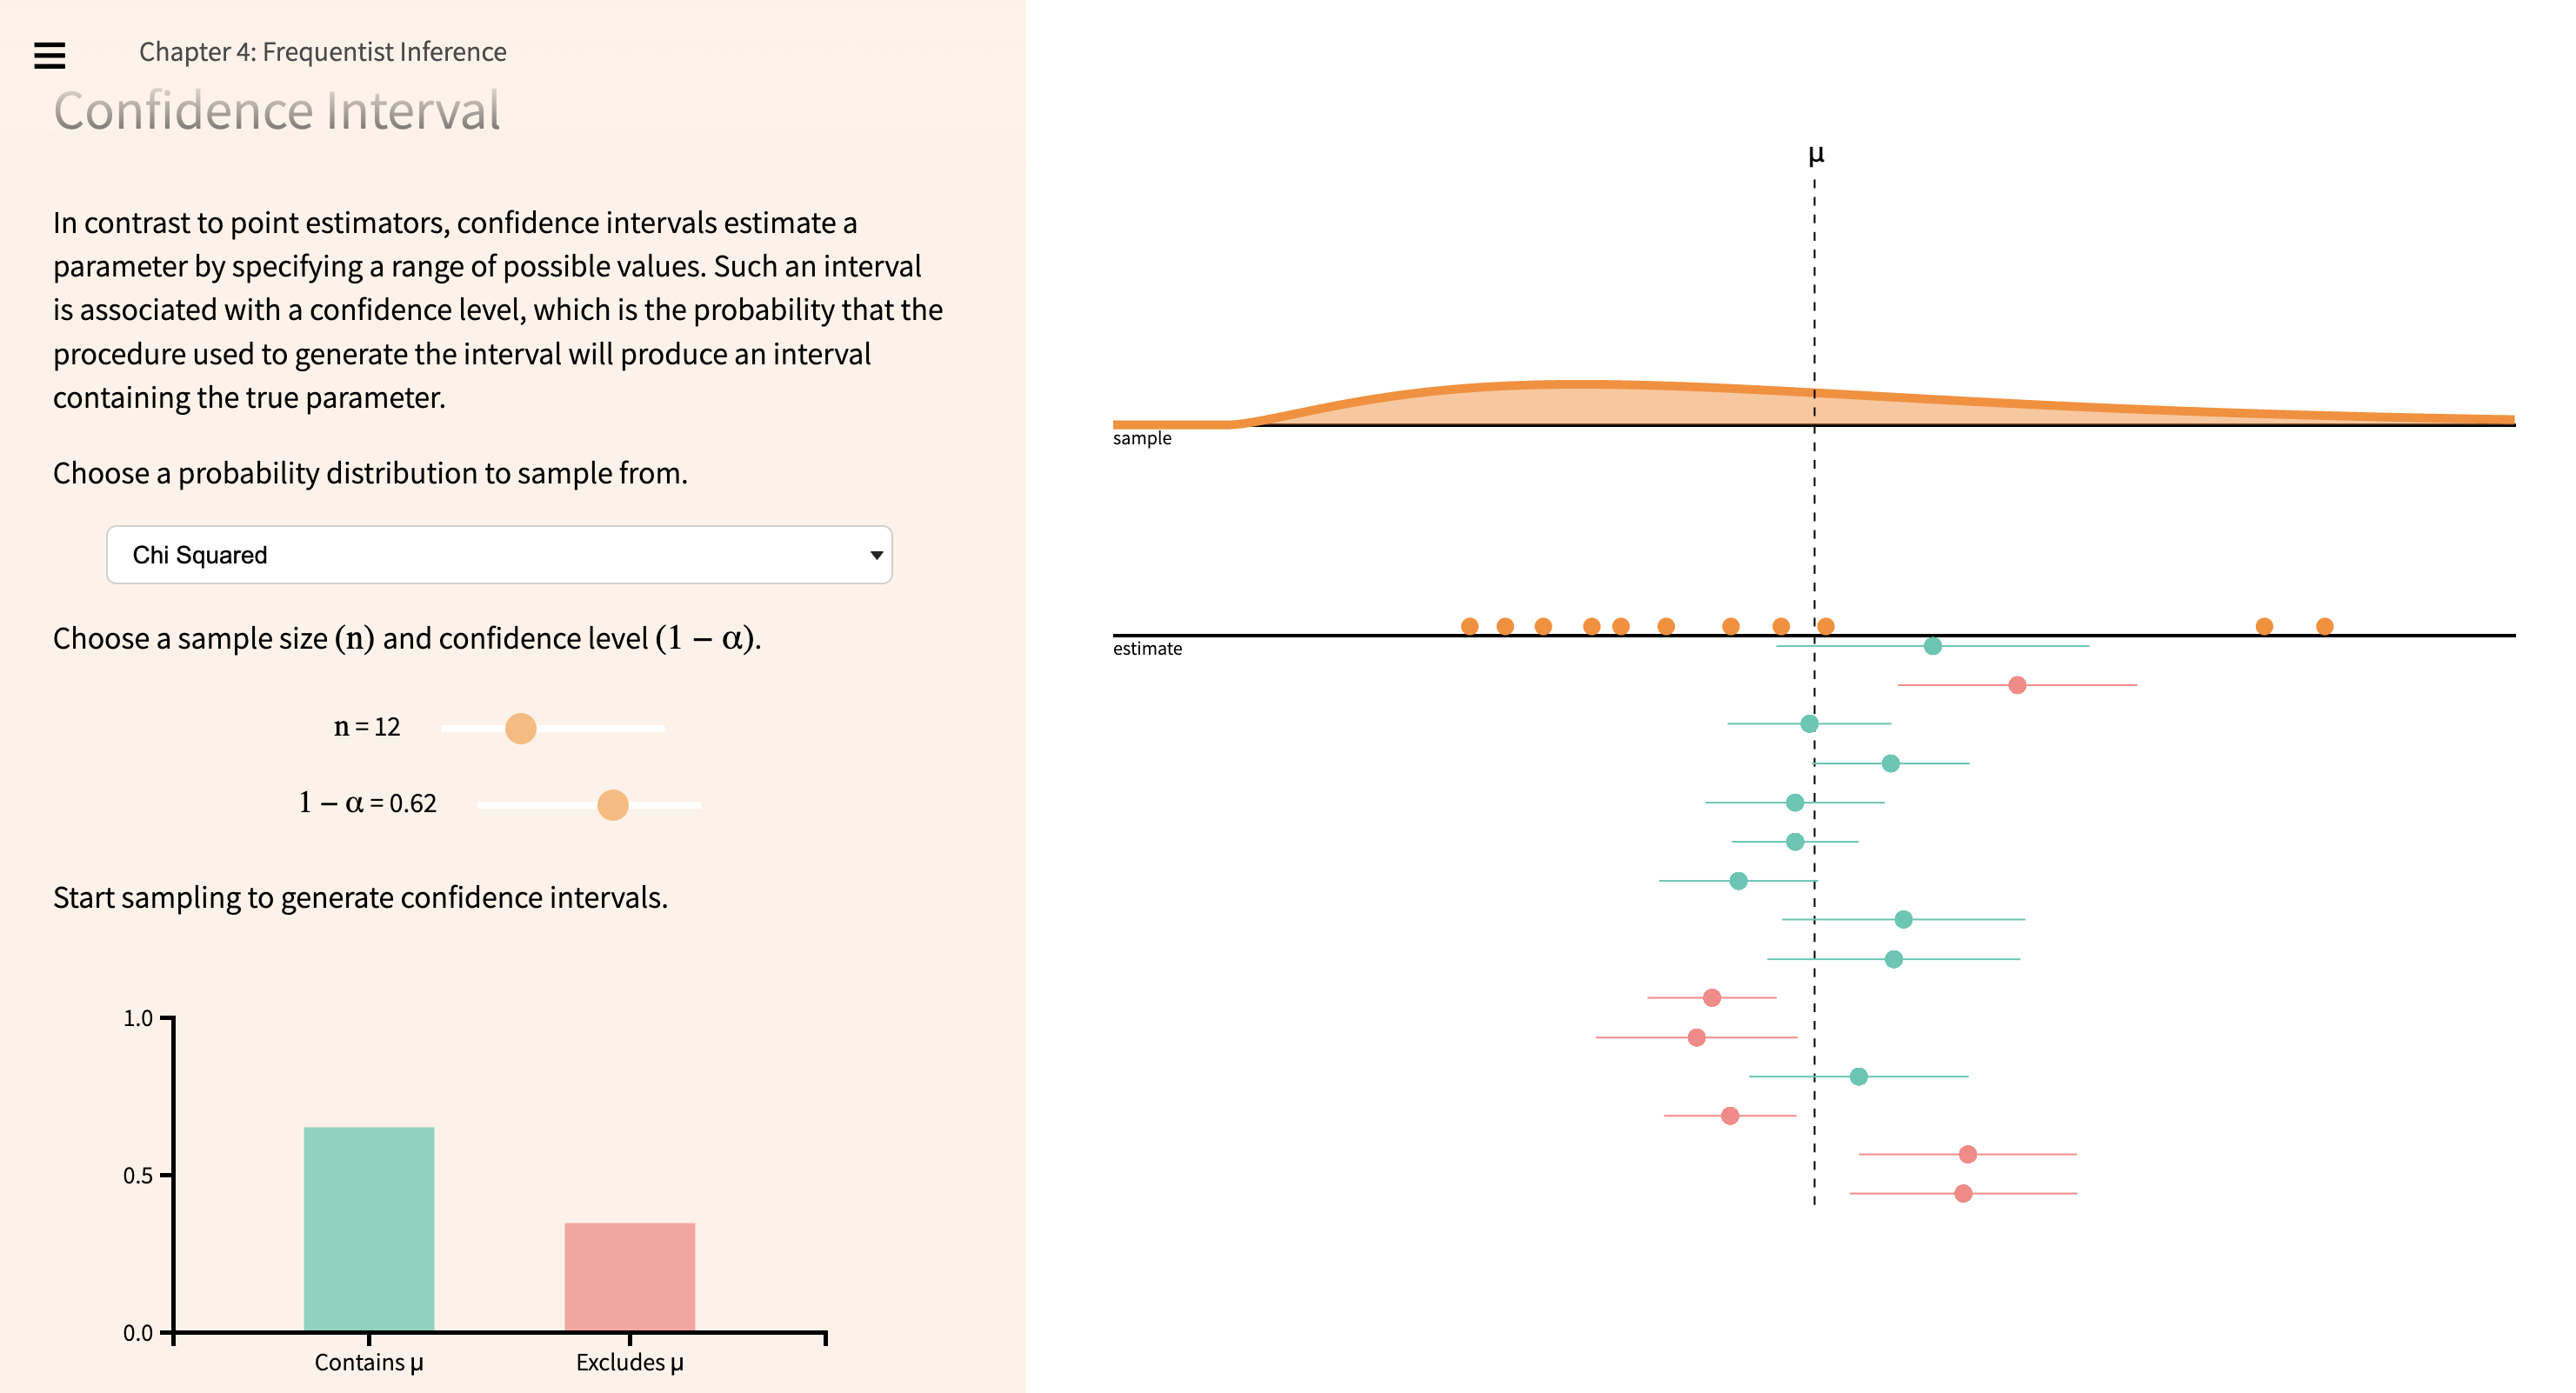
Frequentist Inference - The process of determining properties of an underlying distribution via the observation of data. Point Estimation, Interval Estimation, The Bootstrap
-
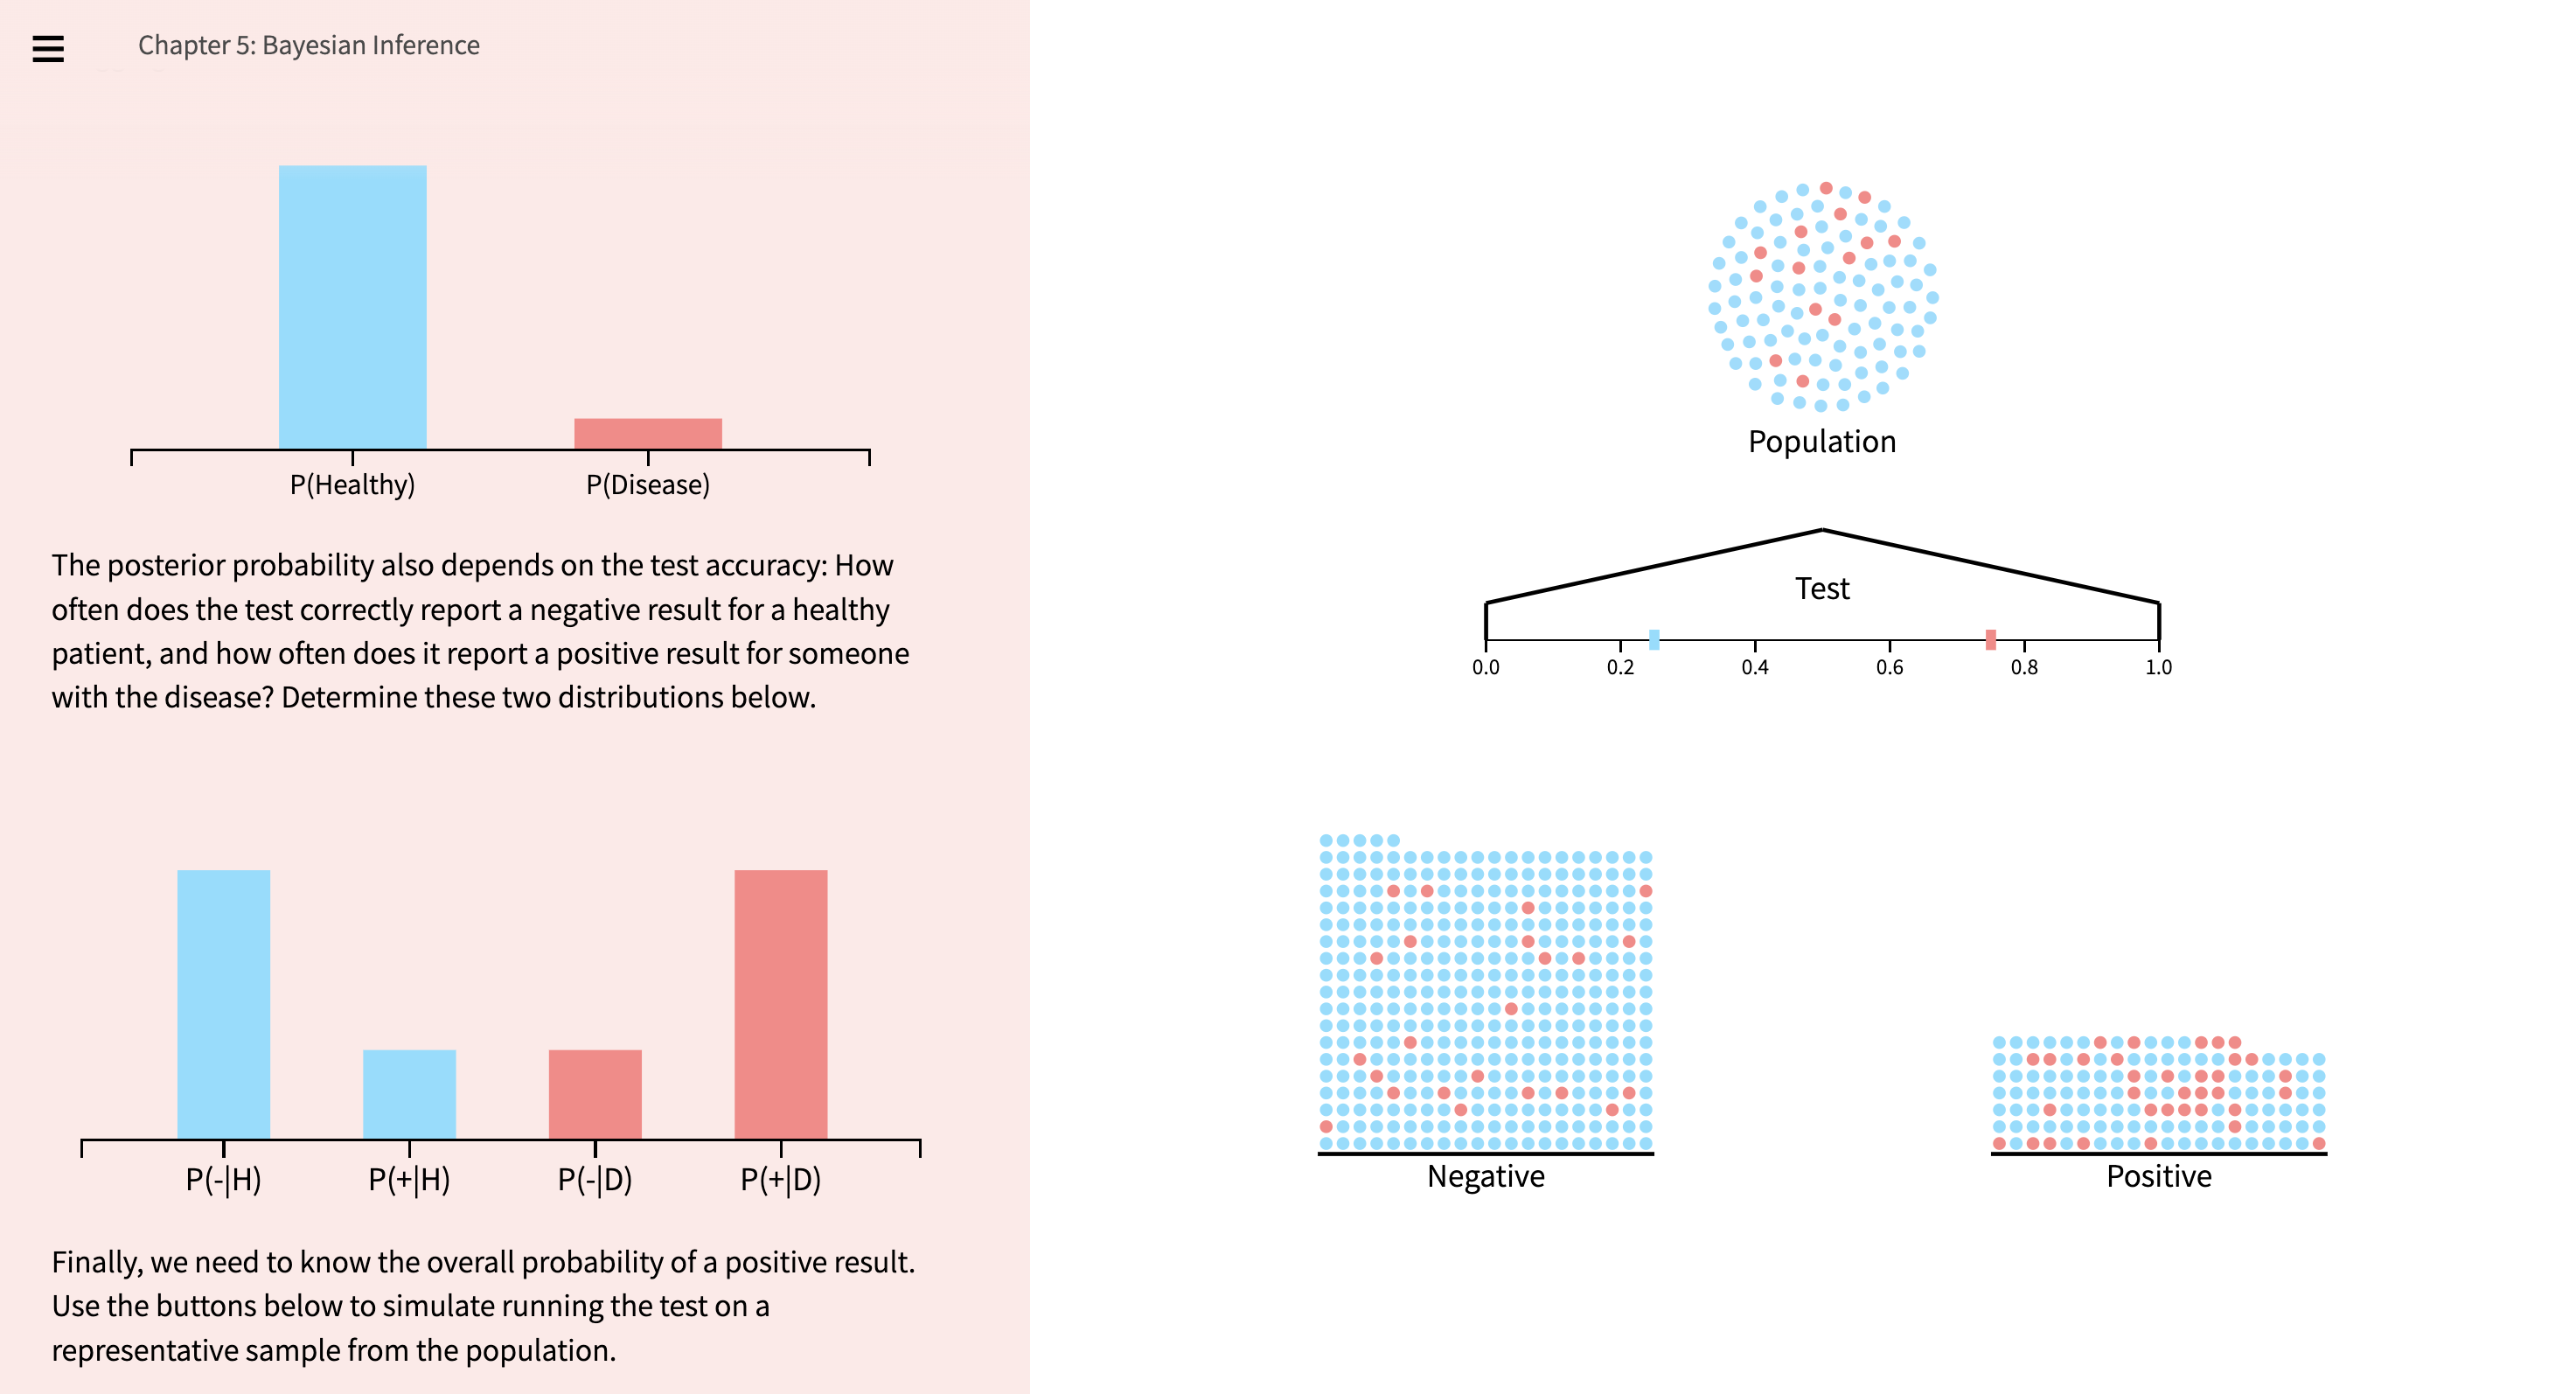
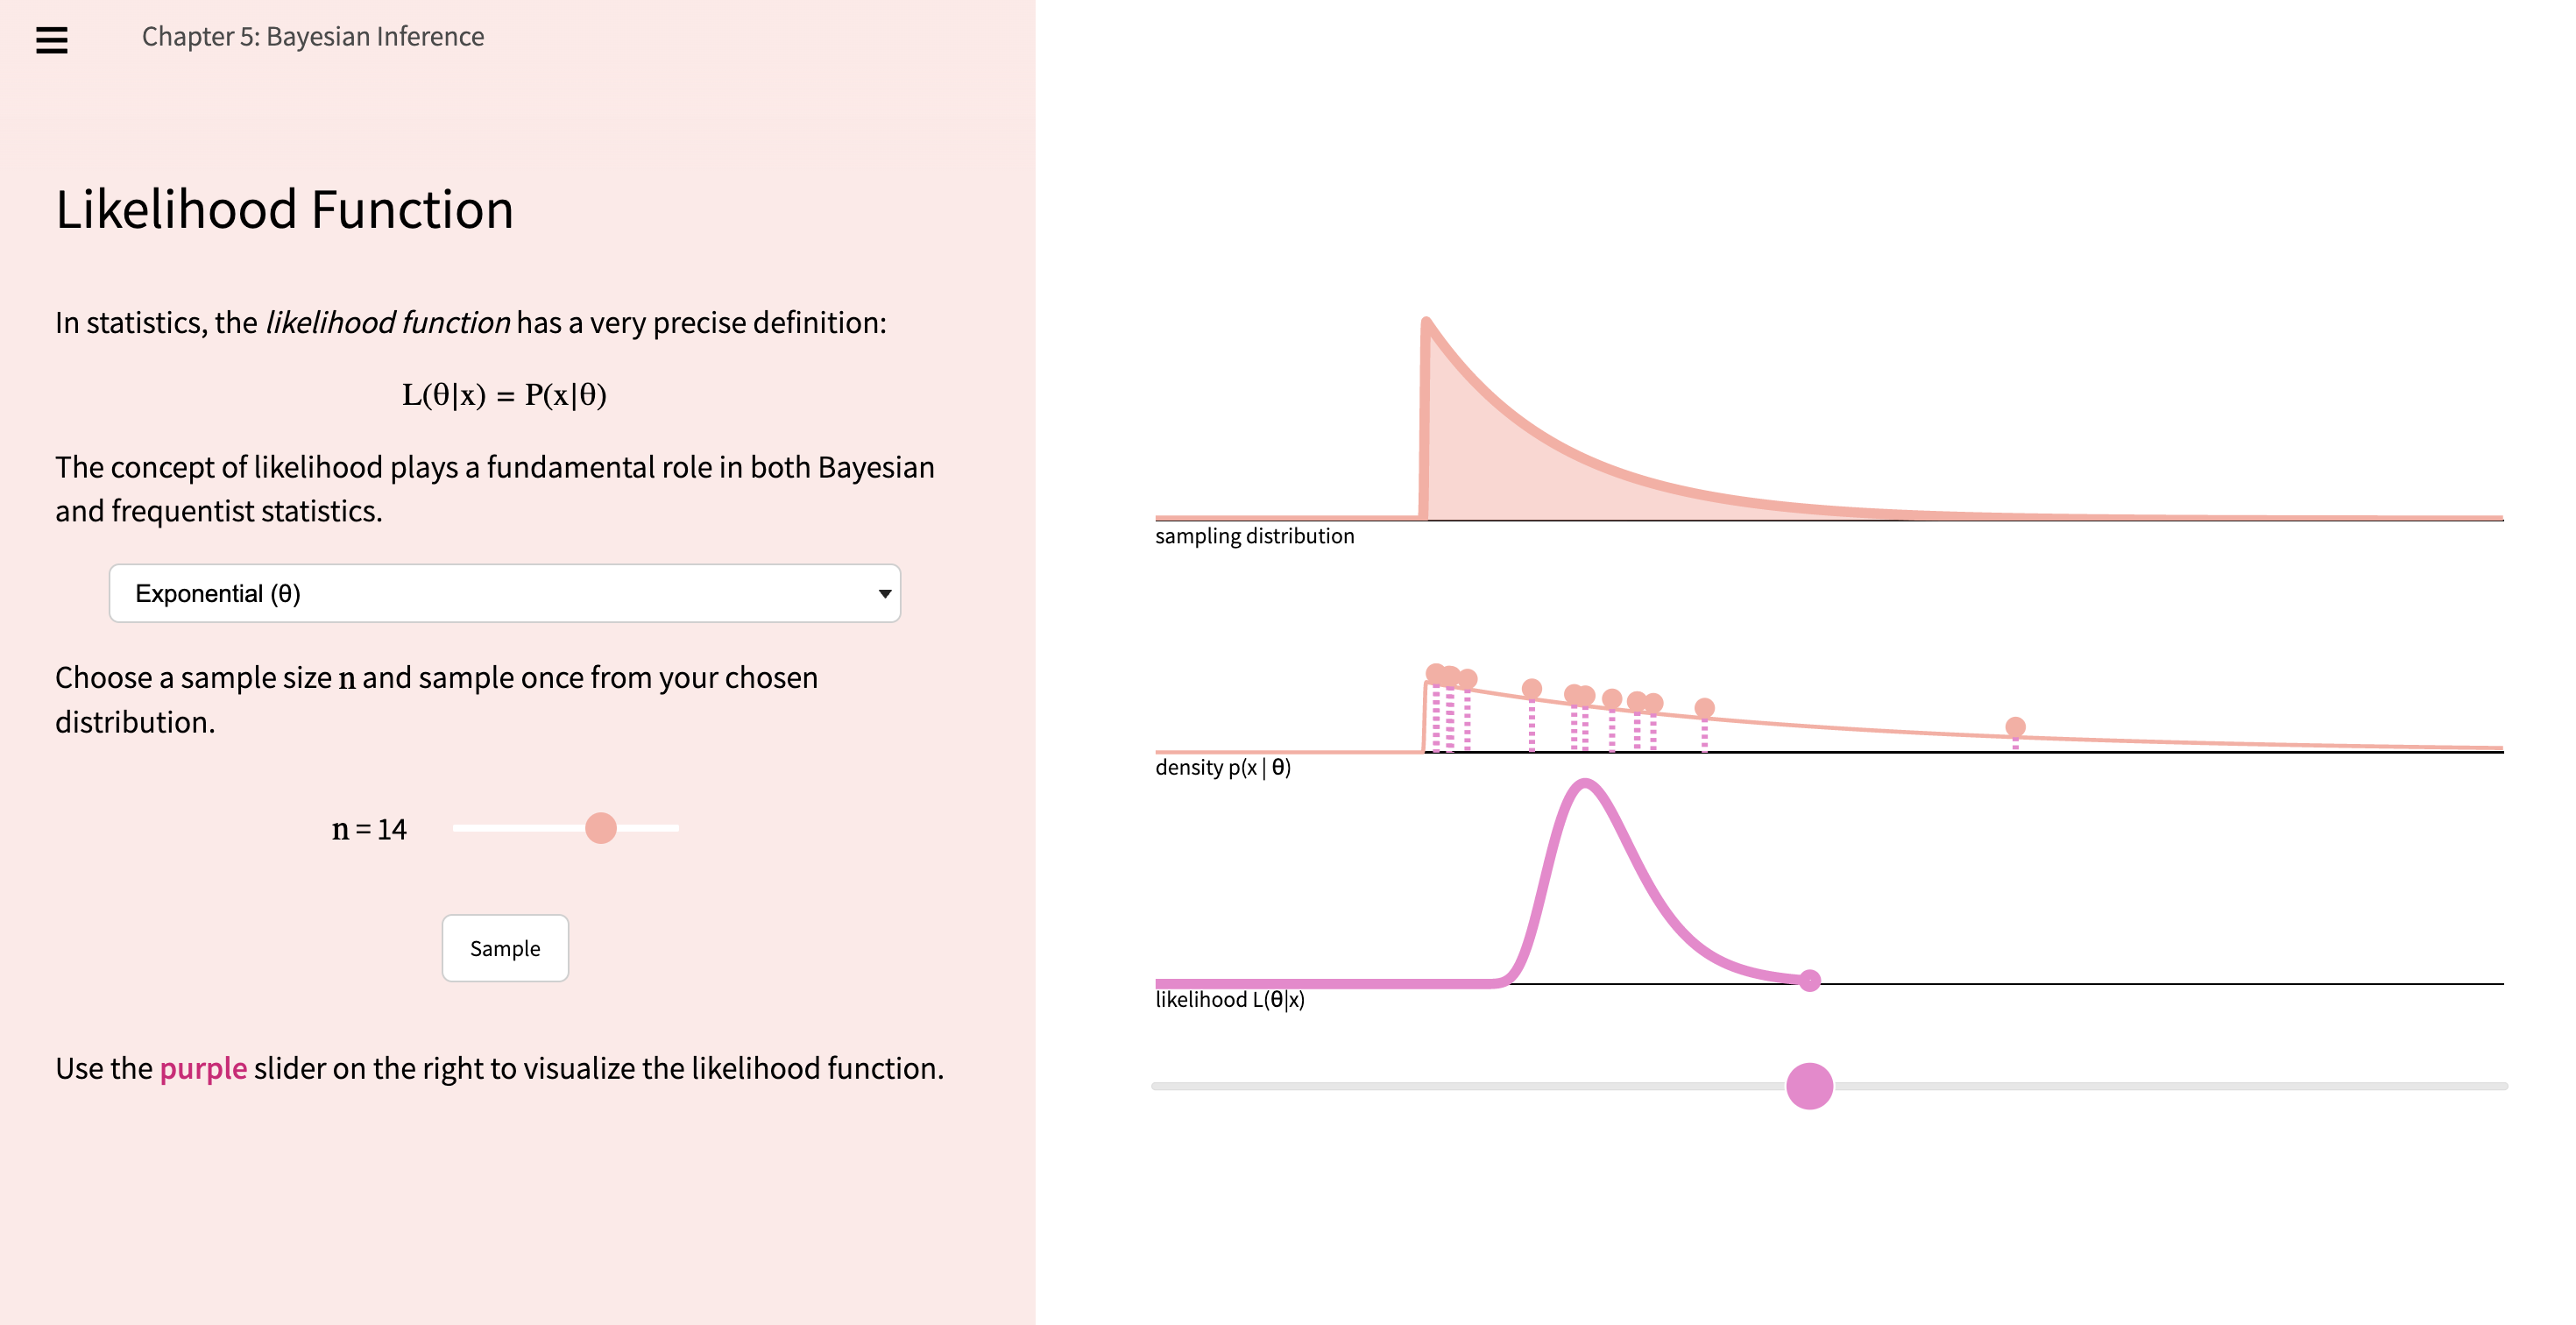
Bayesian Inference - Techniques specifying how one should update one’s beliefs upon observing data. Bayes’ Theorem, Likelihood, Prior to Posterior
-
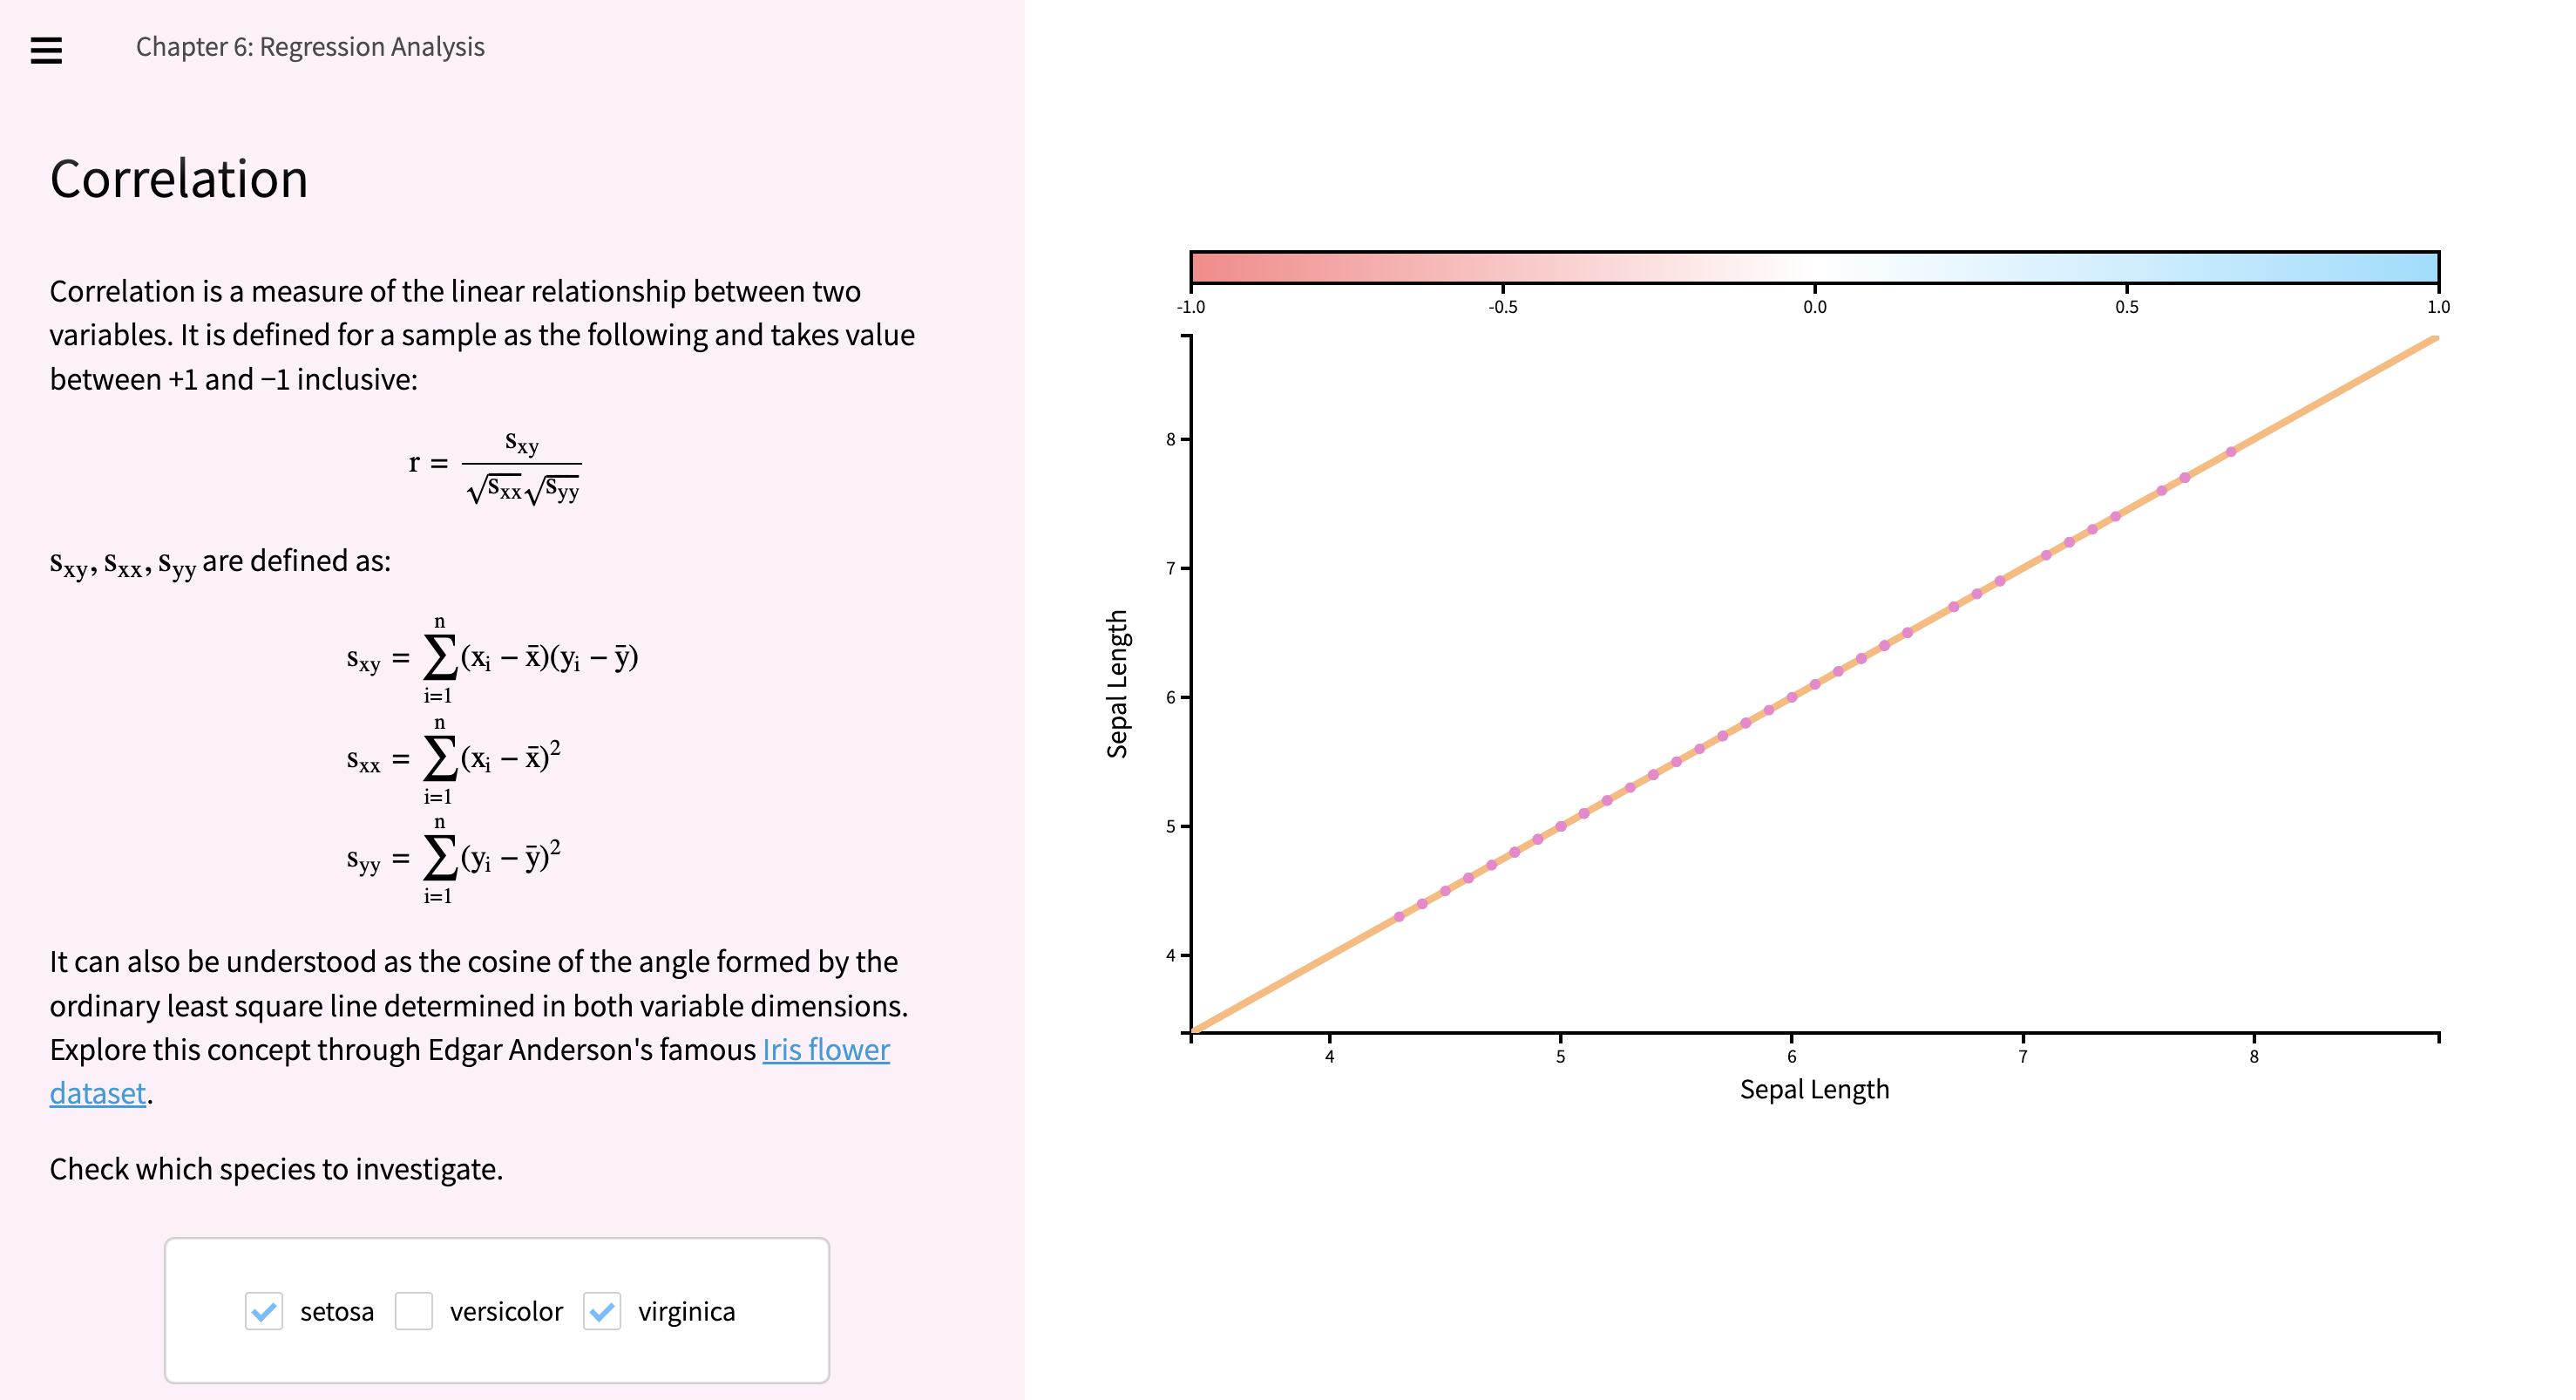
Regression Analysis - An approach for modeling the linear relationship between two variables.
Ordinary Least Squares, Correlation, Analysis of Variance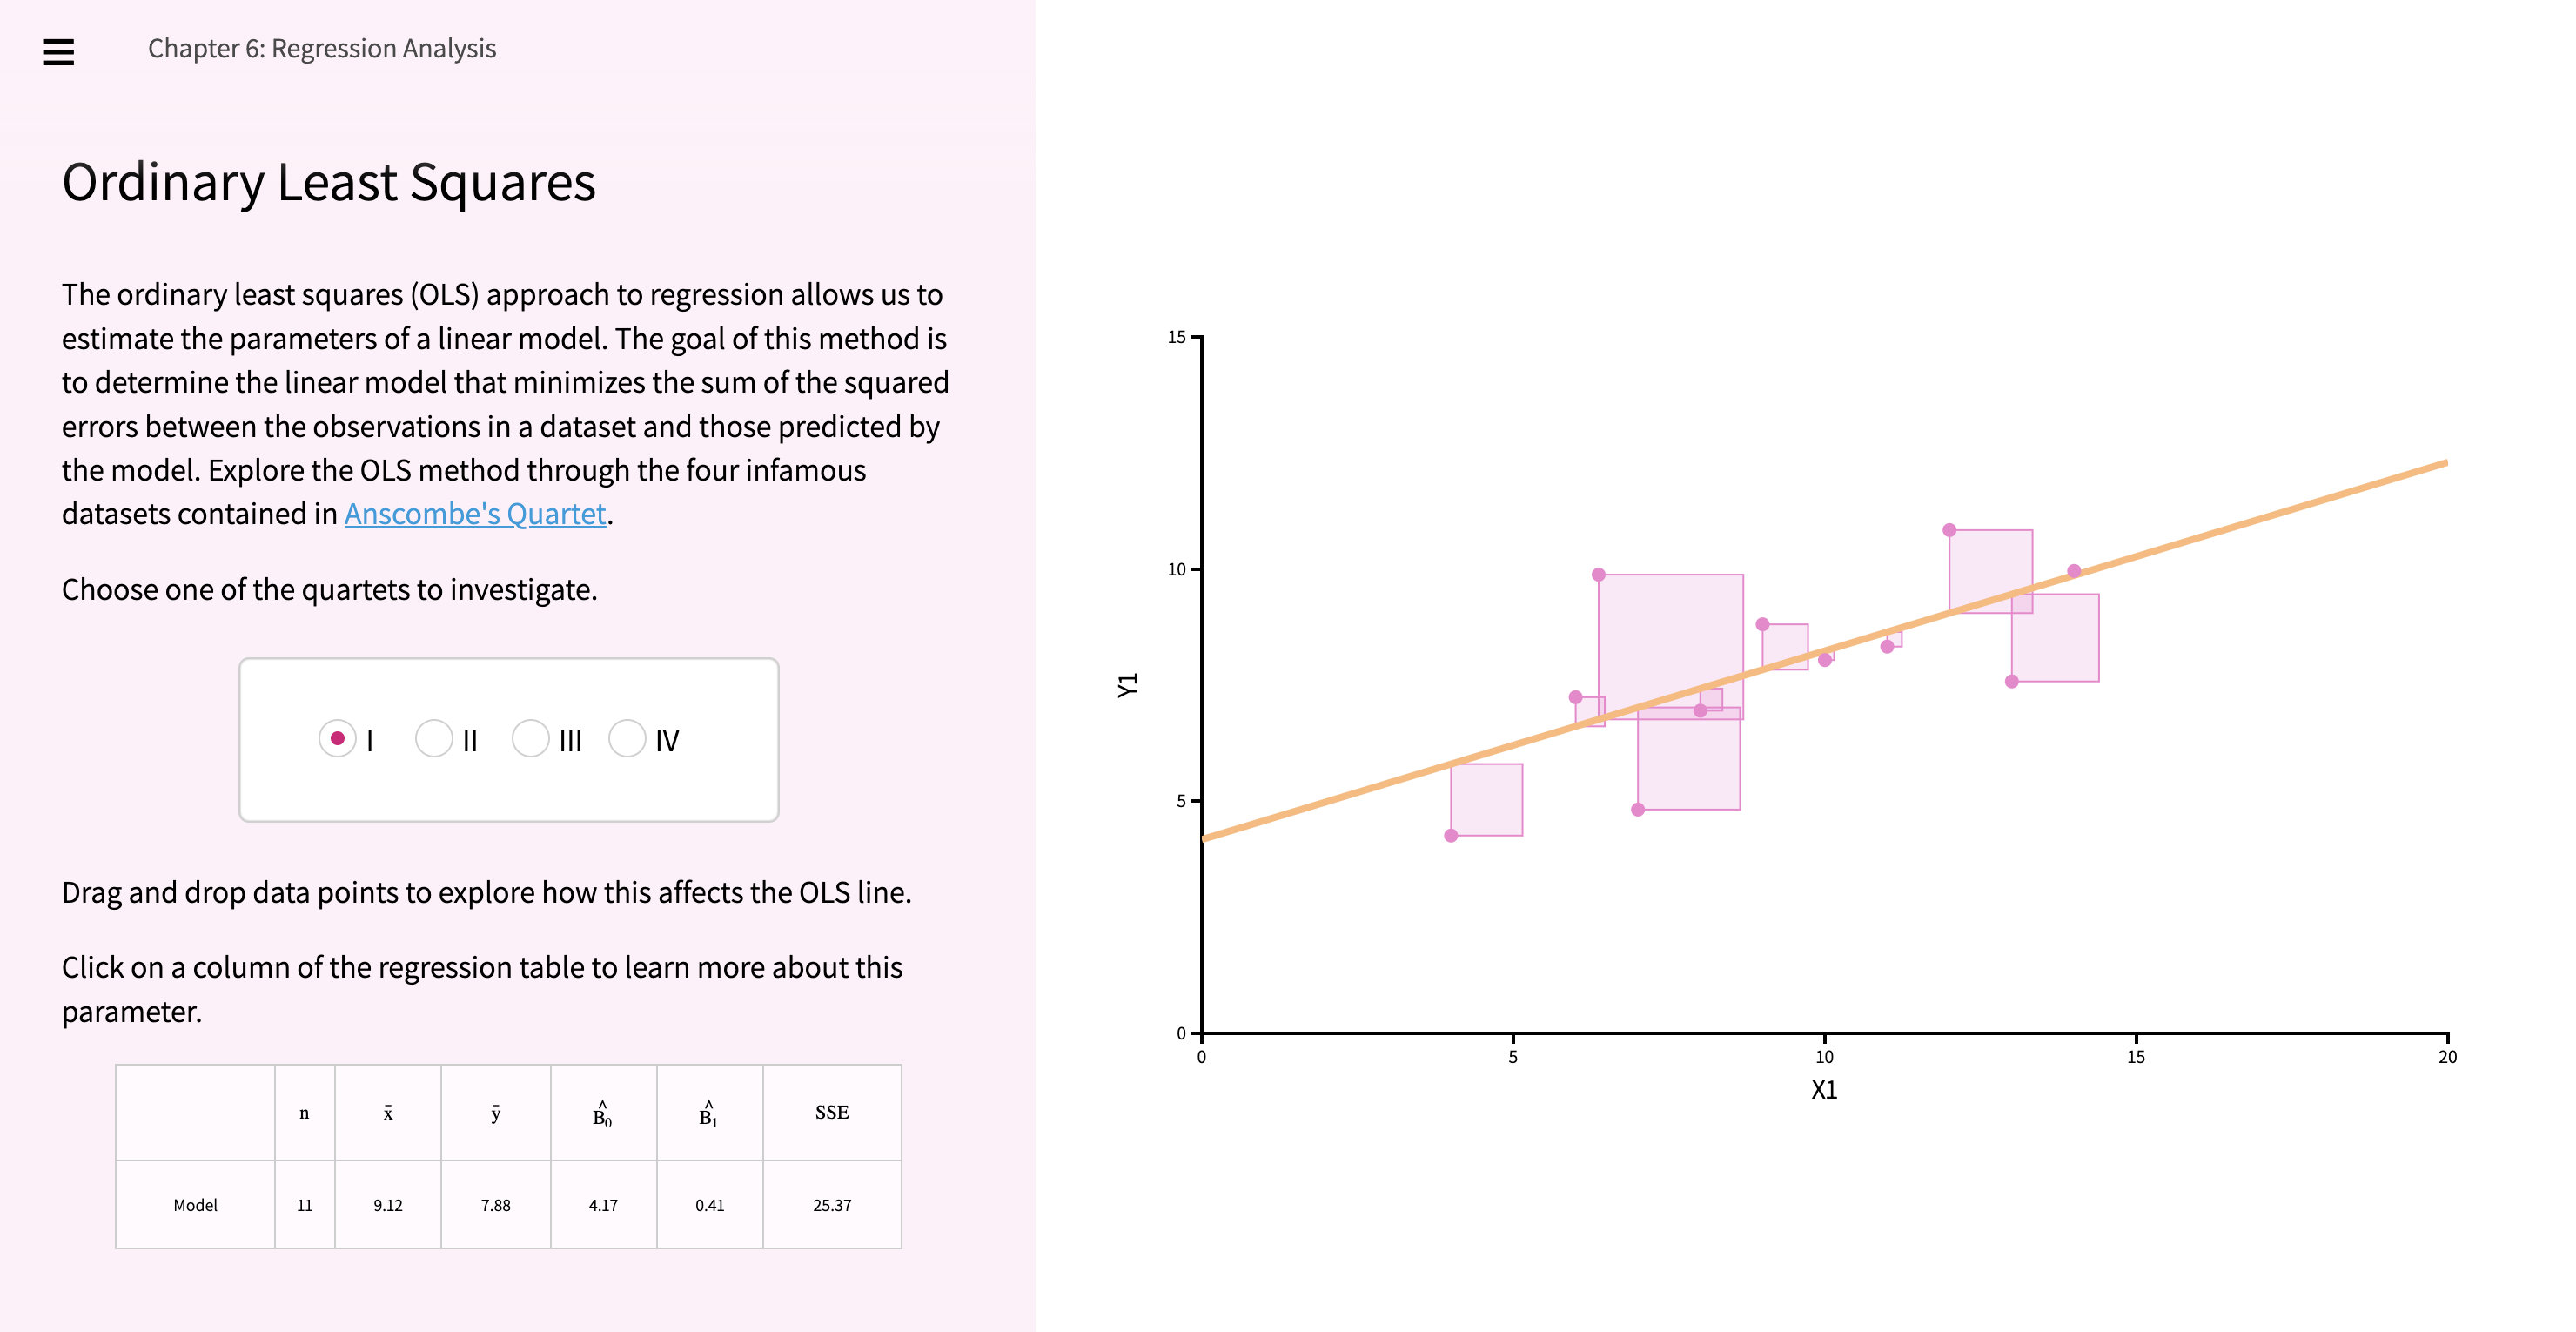
54.3 Linear Algebra
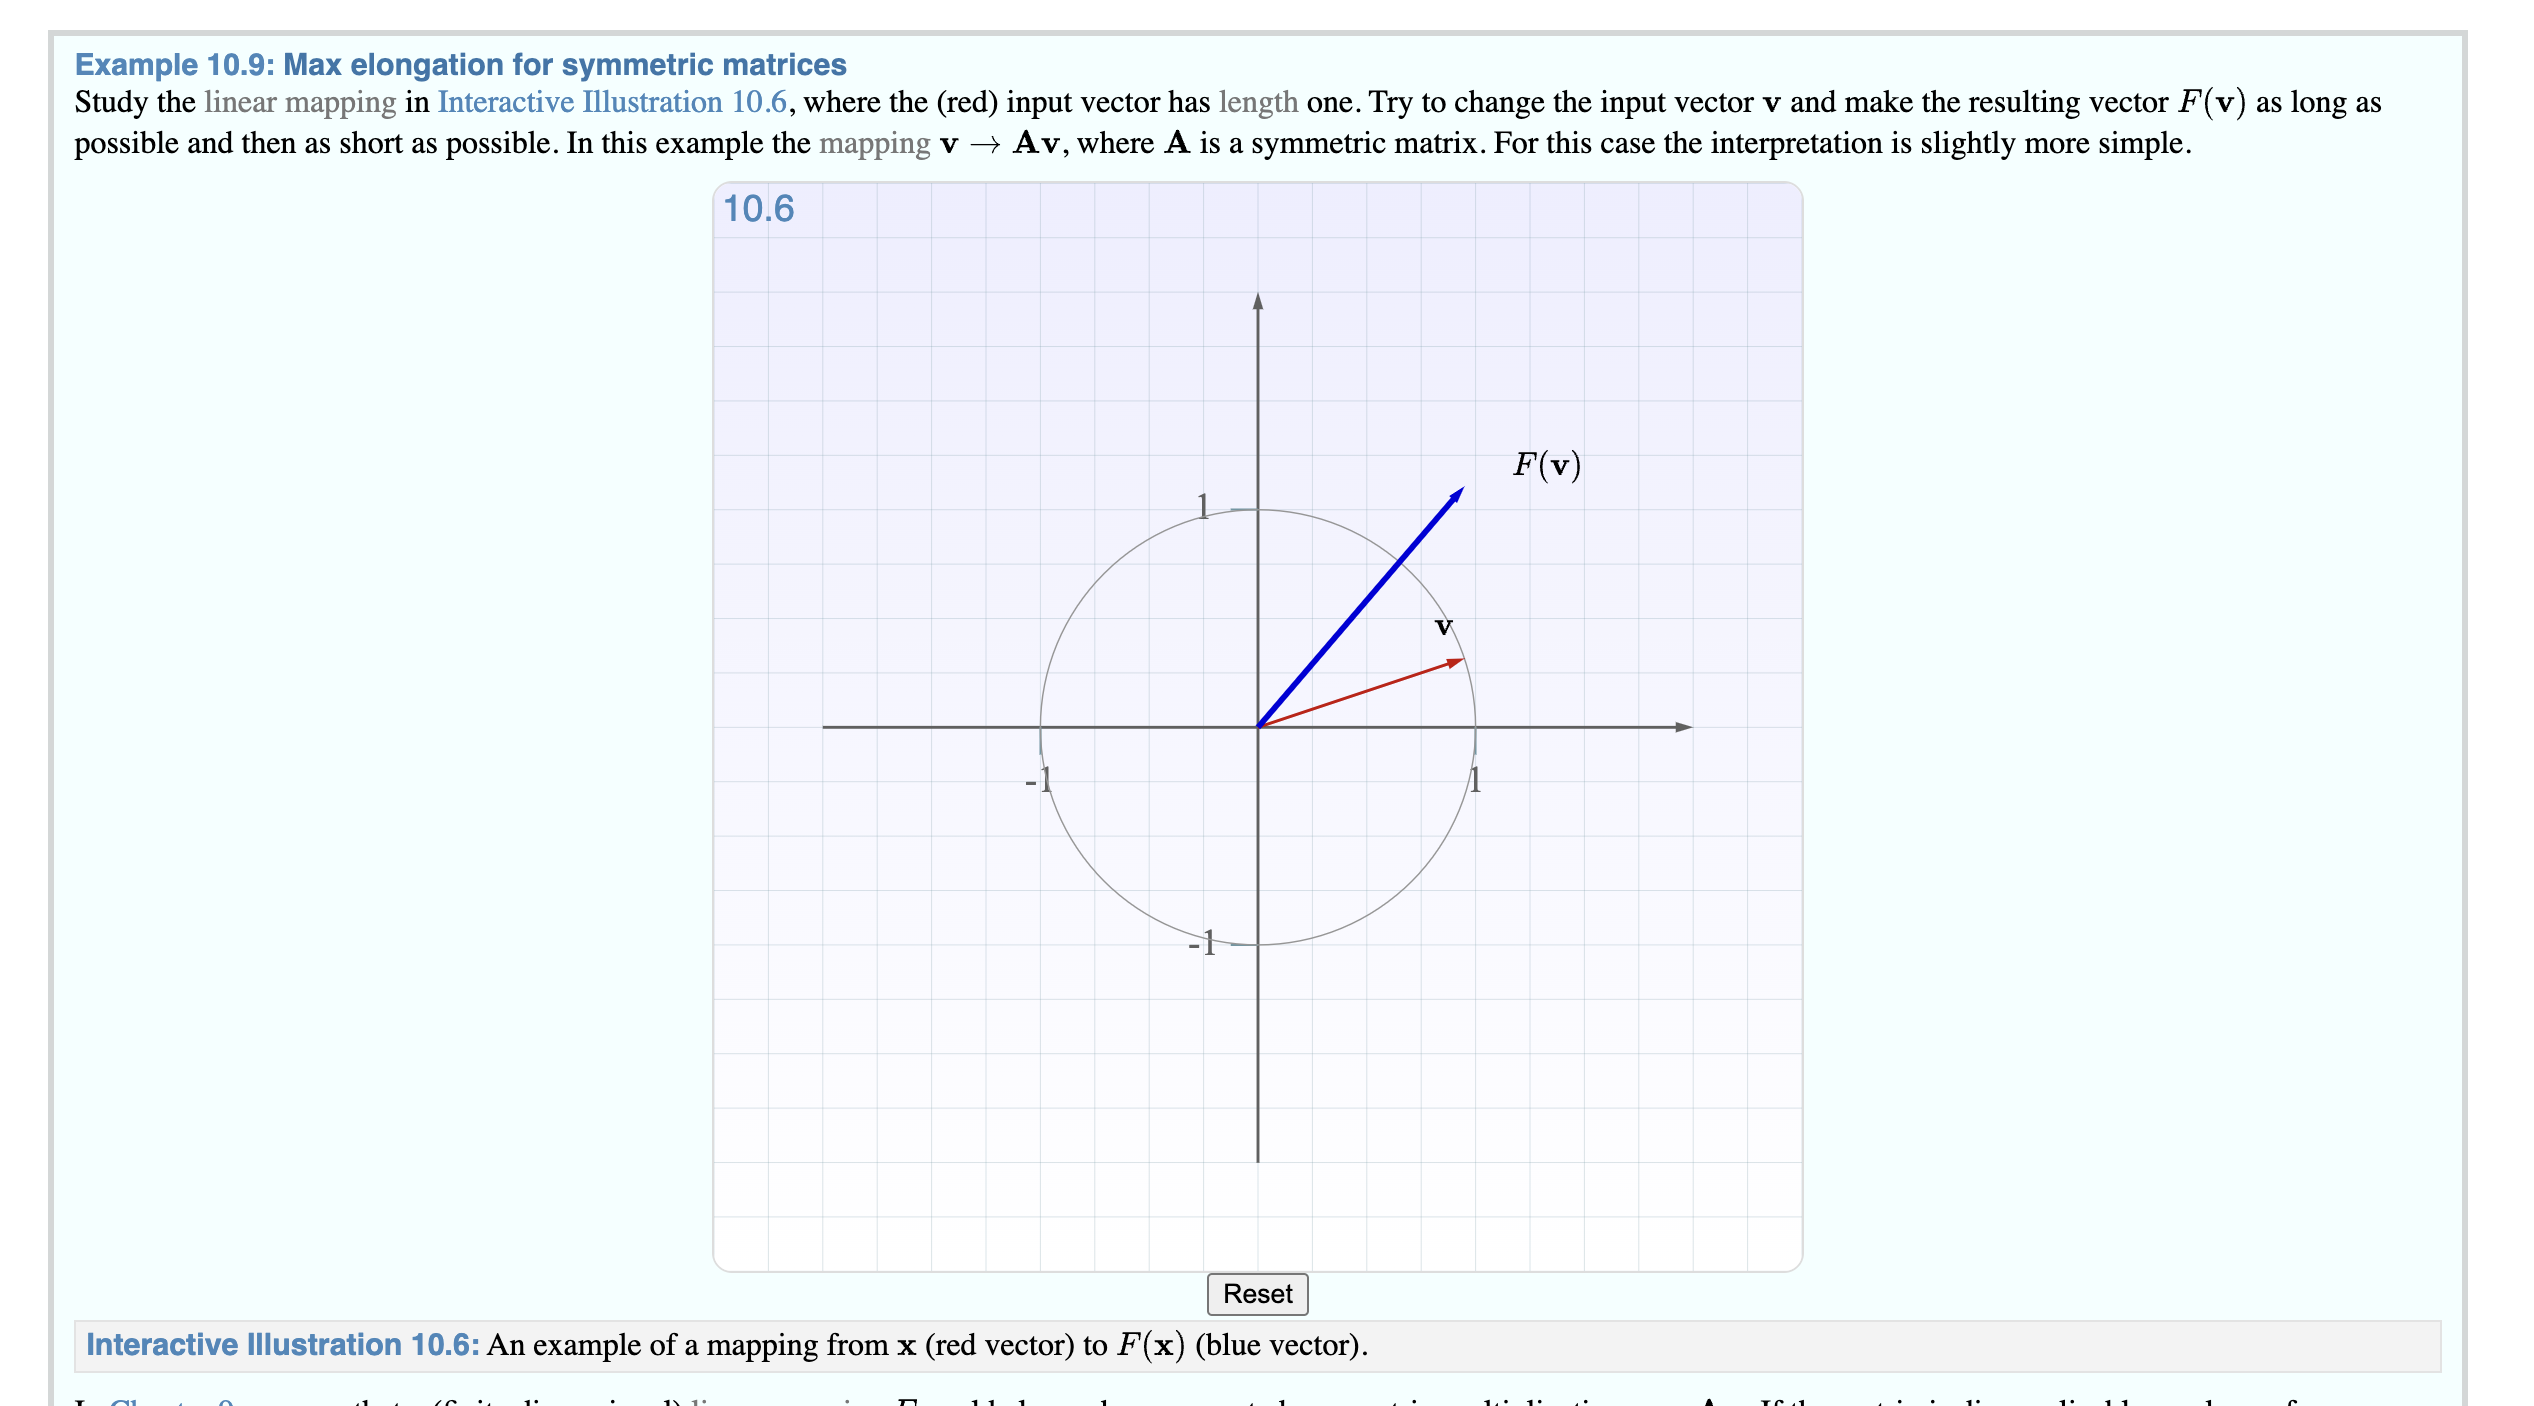
54.3.1 1. Immersive Linear Algebra
Link: http://immersivemath.com/ila/index.html
Linear Algebra is another important area of Data Science that is very abstract which makes it hard to understand at times. Immersive Linear Algebra uses interactive figures to explain and simplify the different concepts.
54.4 Machine Learning
54.4.1 1. R2D3
Link: http://www.r2d3.us/
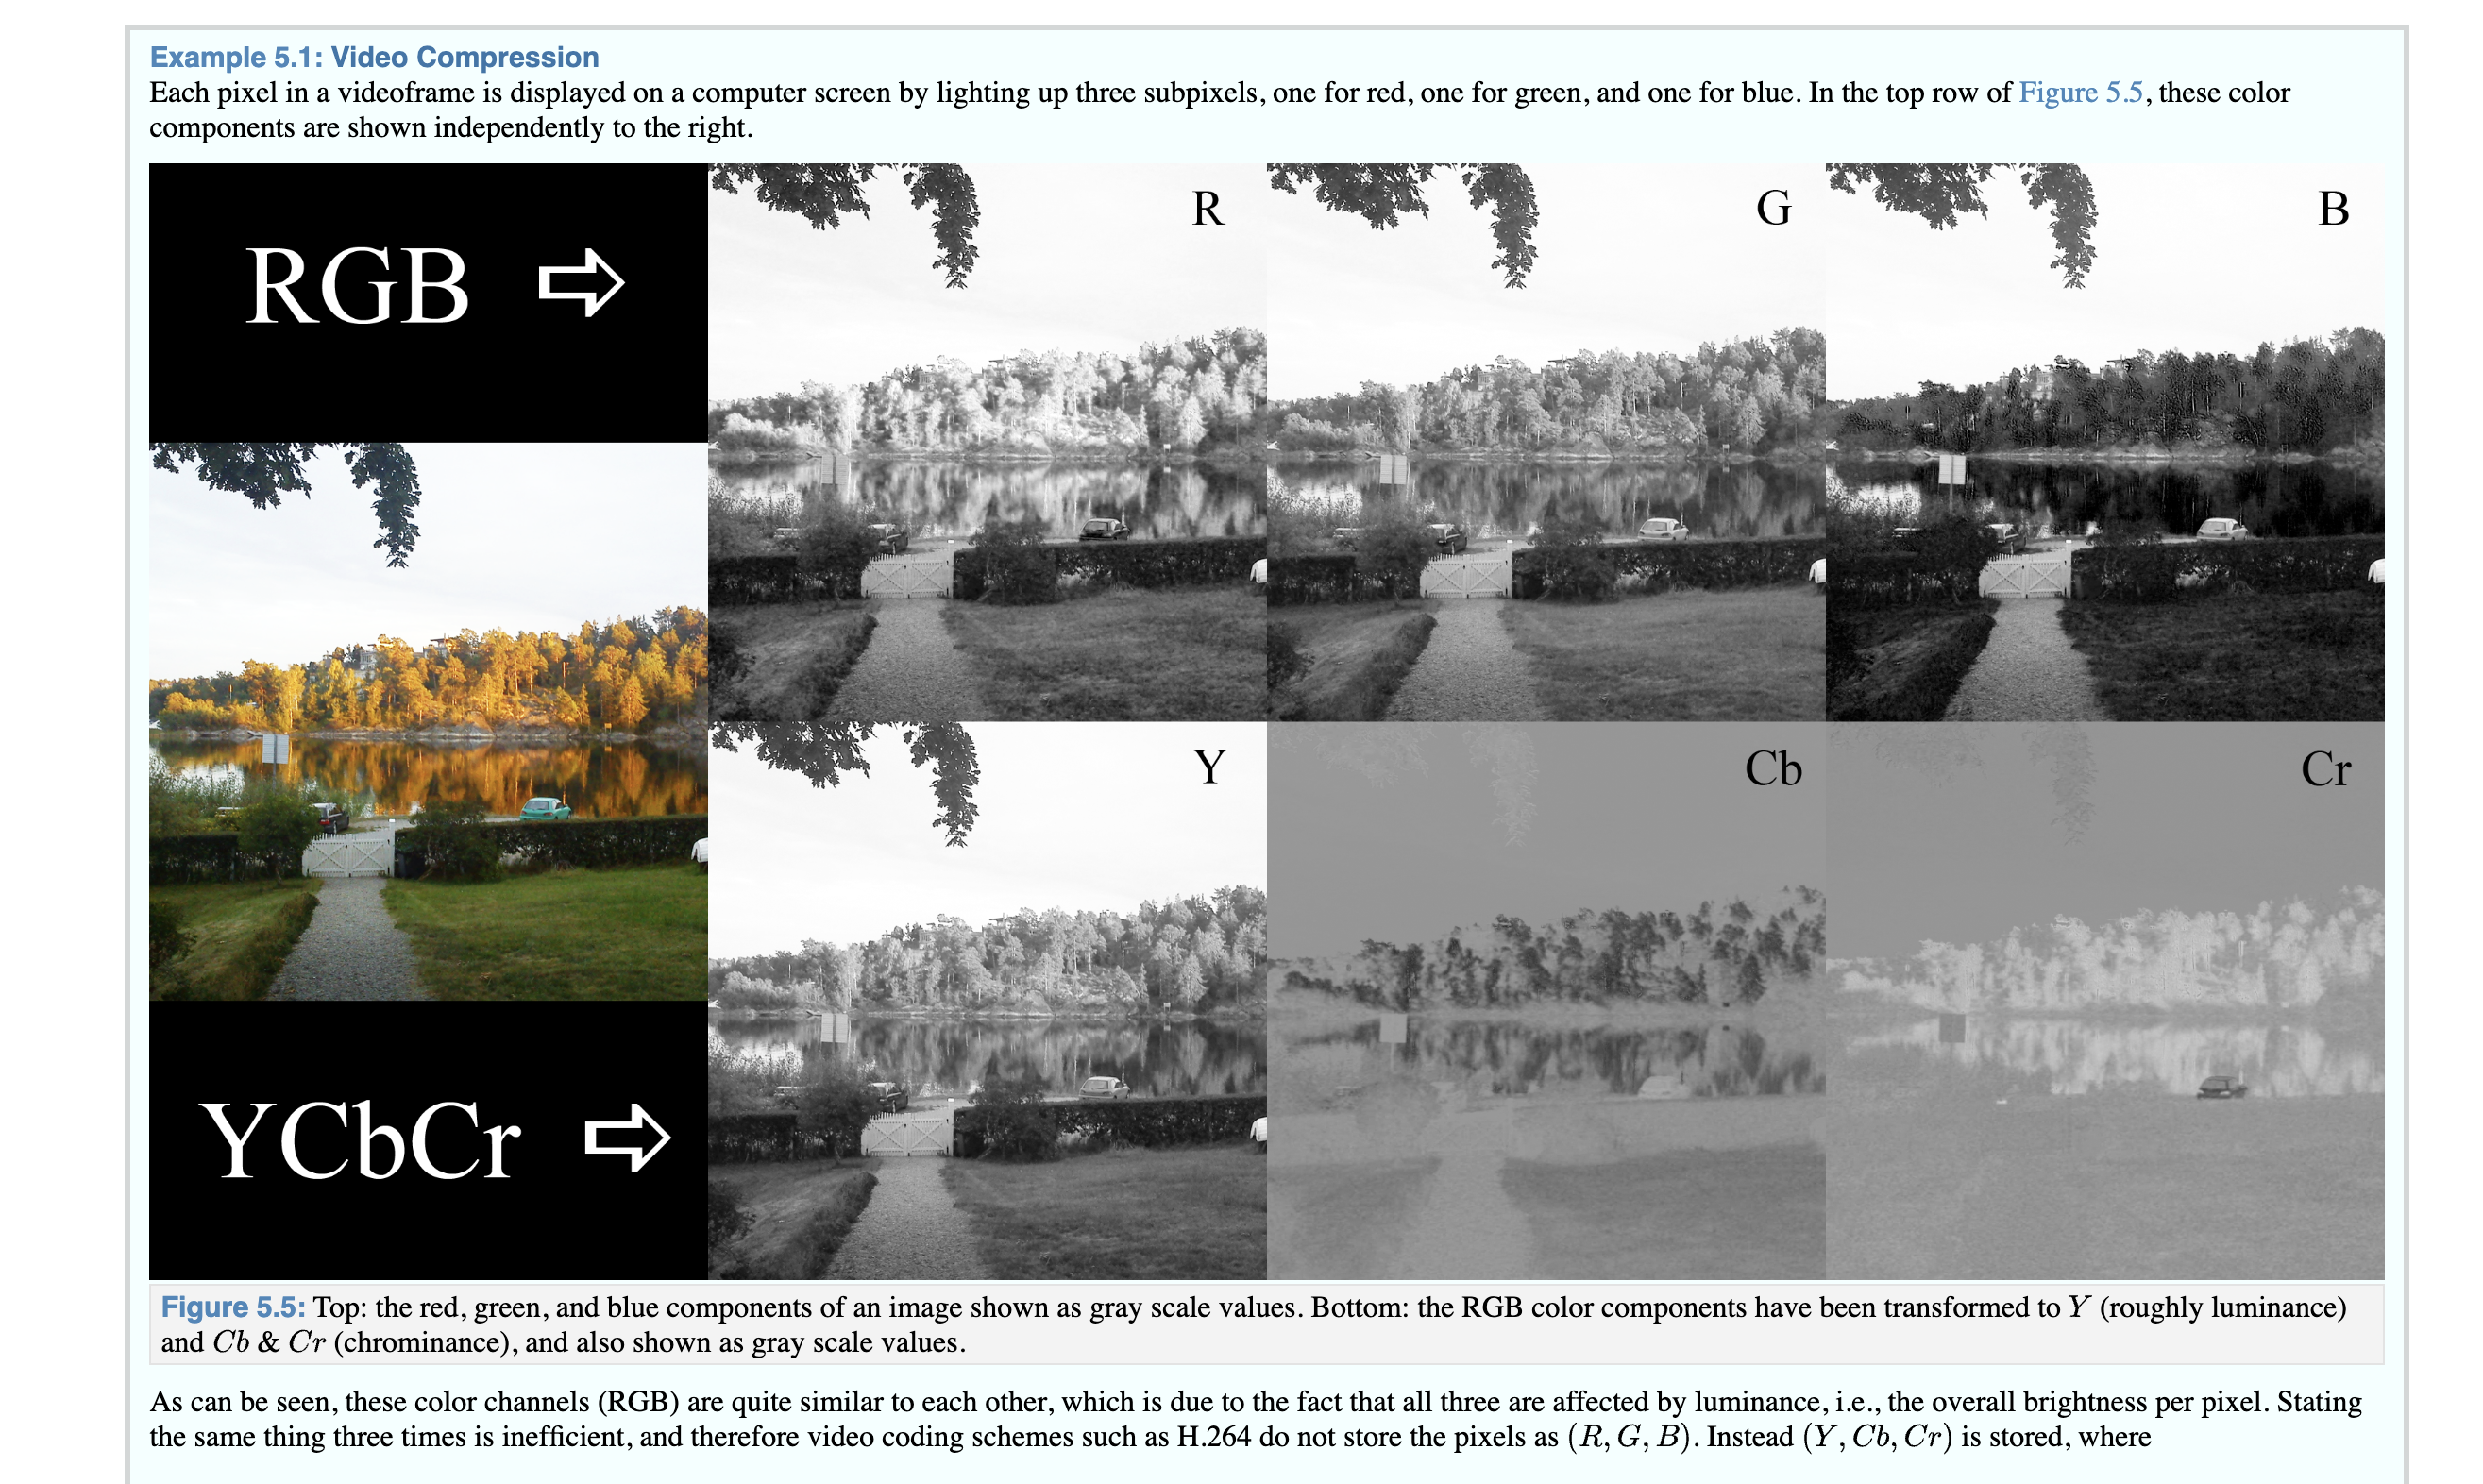
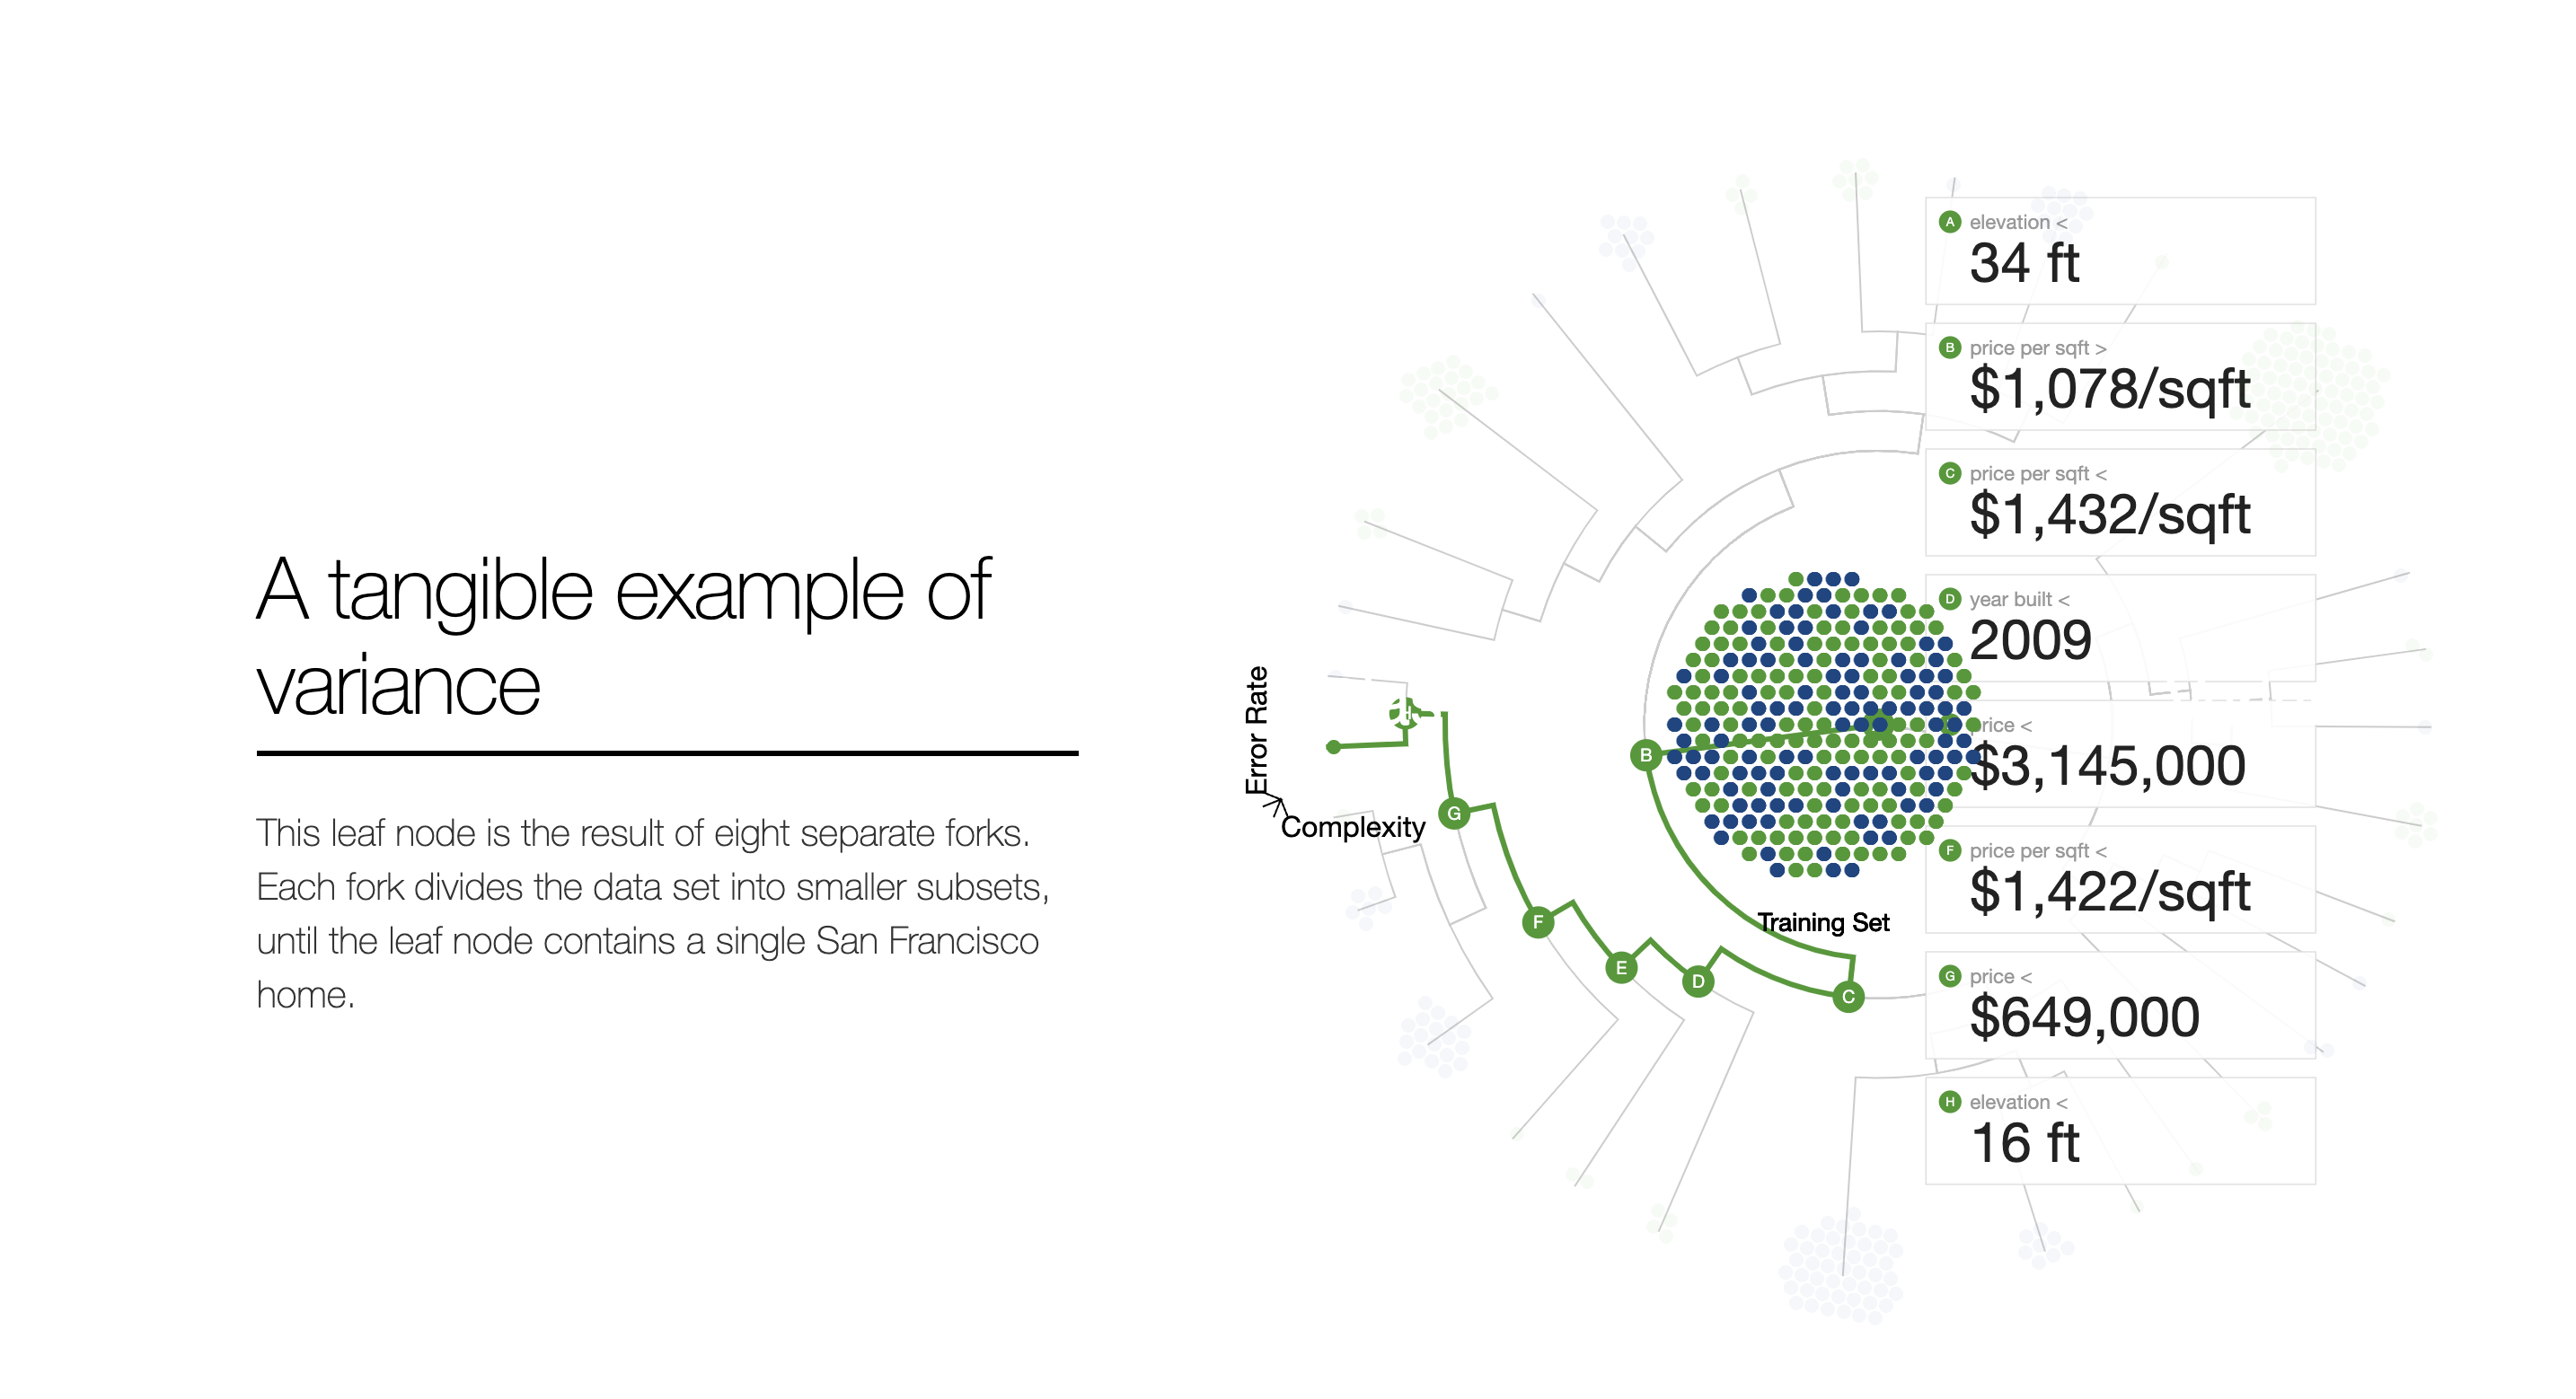
R2D3 describes itself as “an experiment in expressing statistical thinking with interactive design”. The website visually introduces Machine Learning by visualizing the steps of understanding the data, creating and tuning a model that helps distinguish homes in New York from homes in San Francisco. It is broken down into 2 parts:
-
A visual introduction to machine learning
(http://www.r2d3.us/visual-intro-to-machine-learning-part-1/)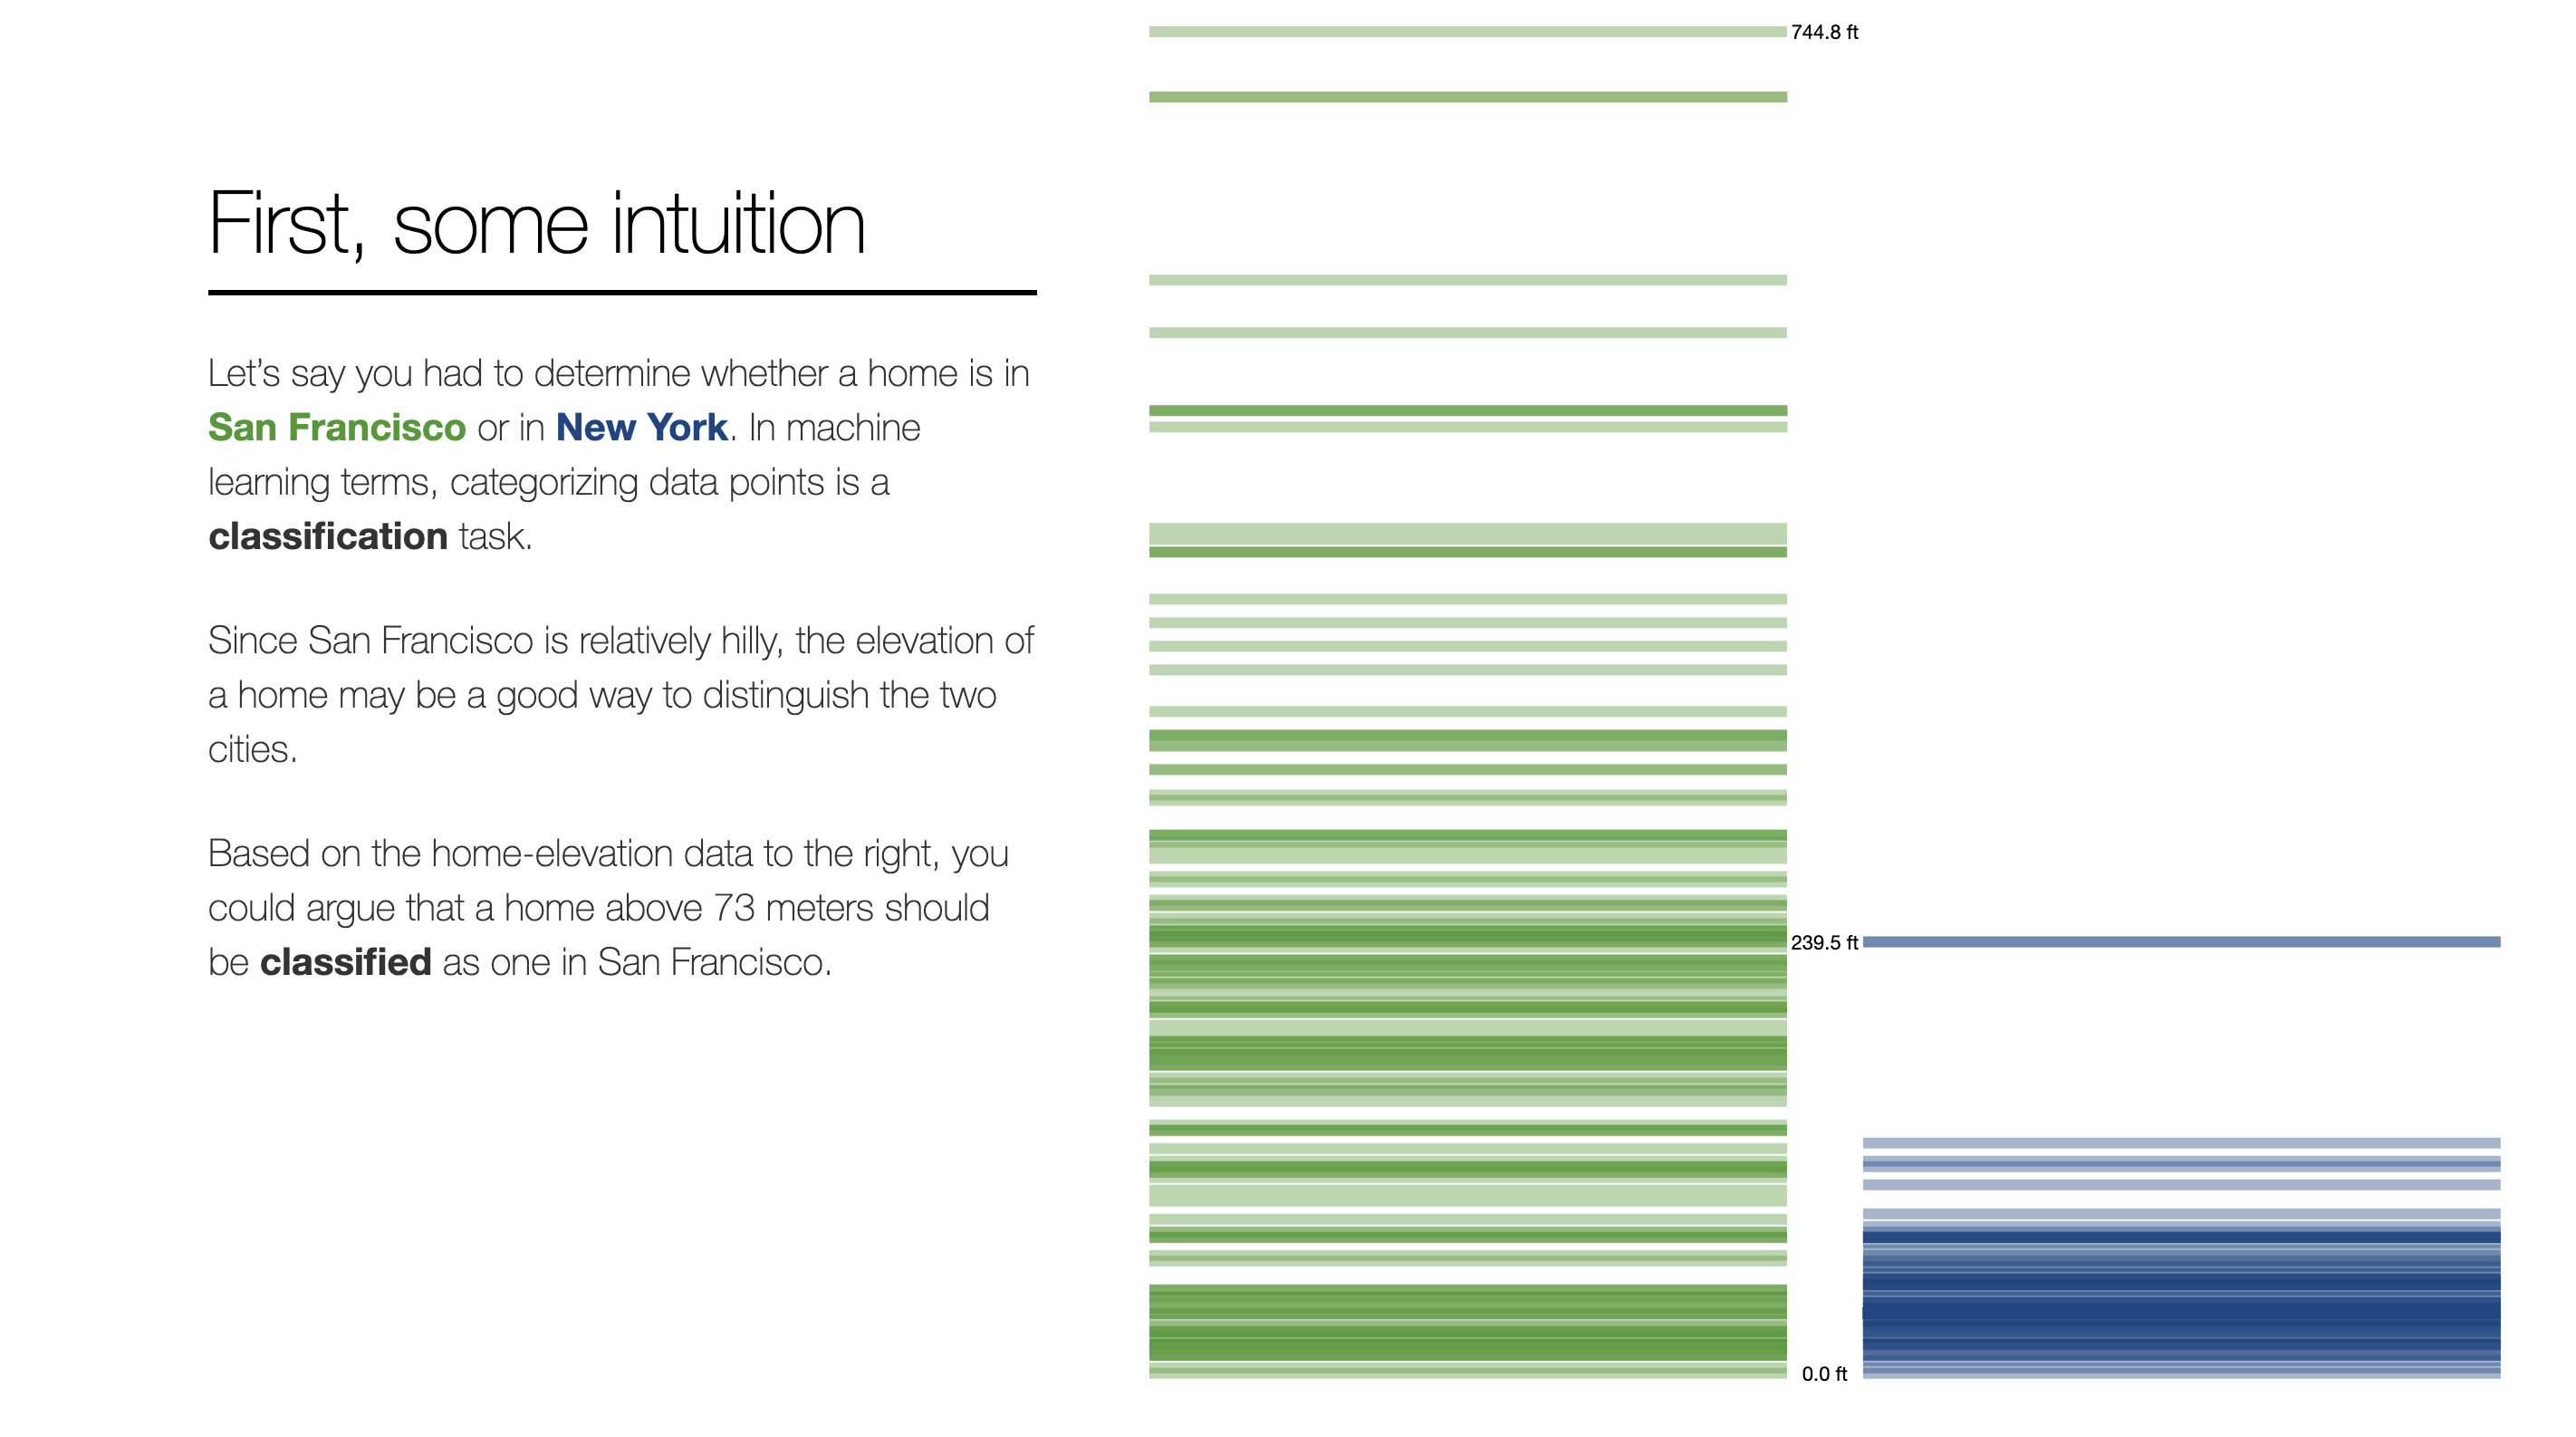
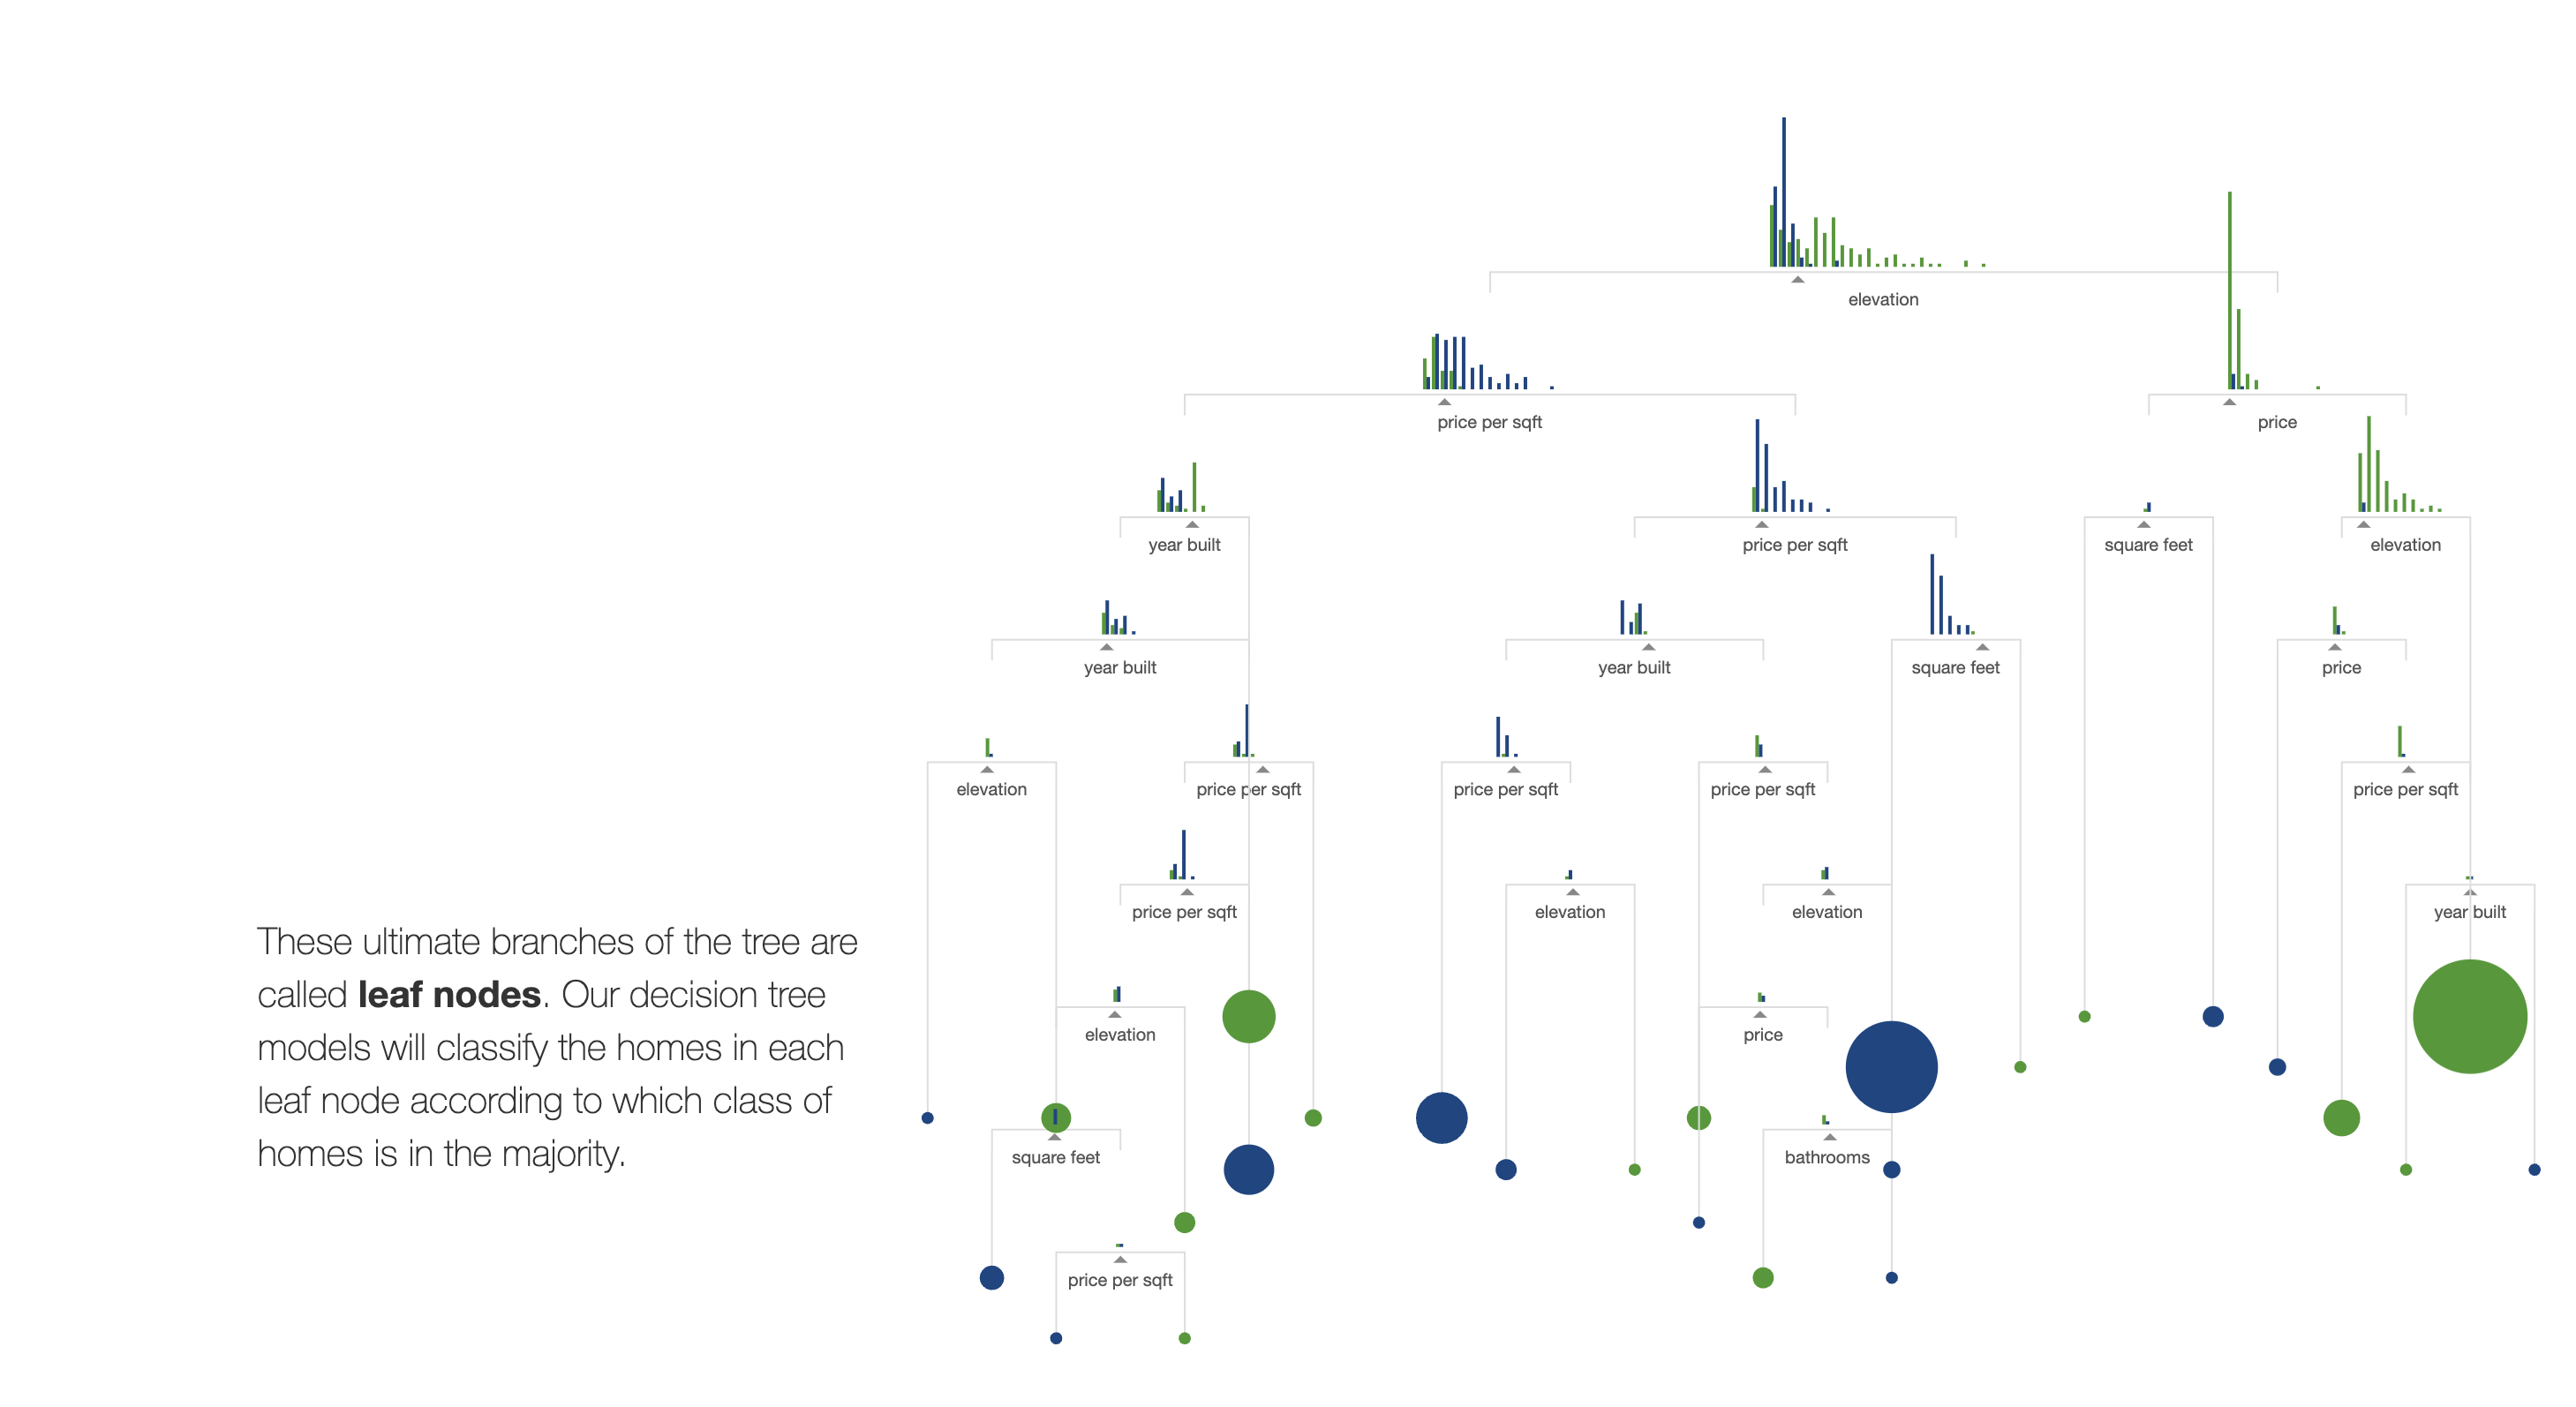
-
Model Tuning and the Bias-Variance Tradeoff
(http://www.r2d3.us/visual-intro-to-machine-learning-part-2/)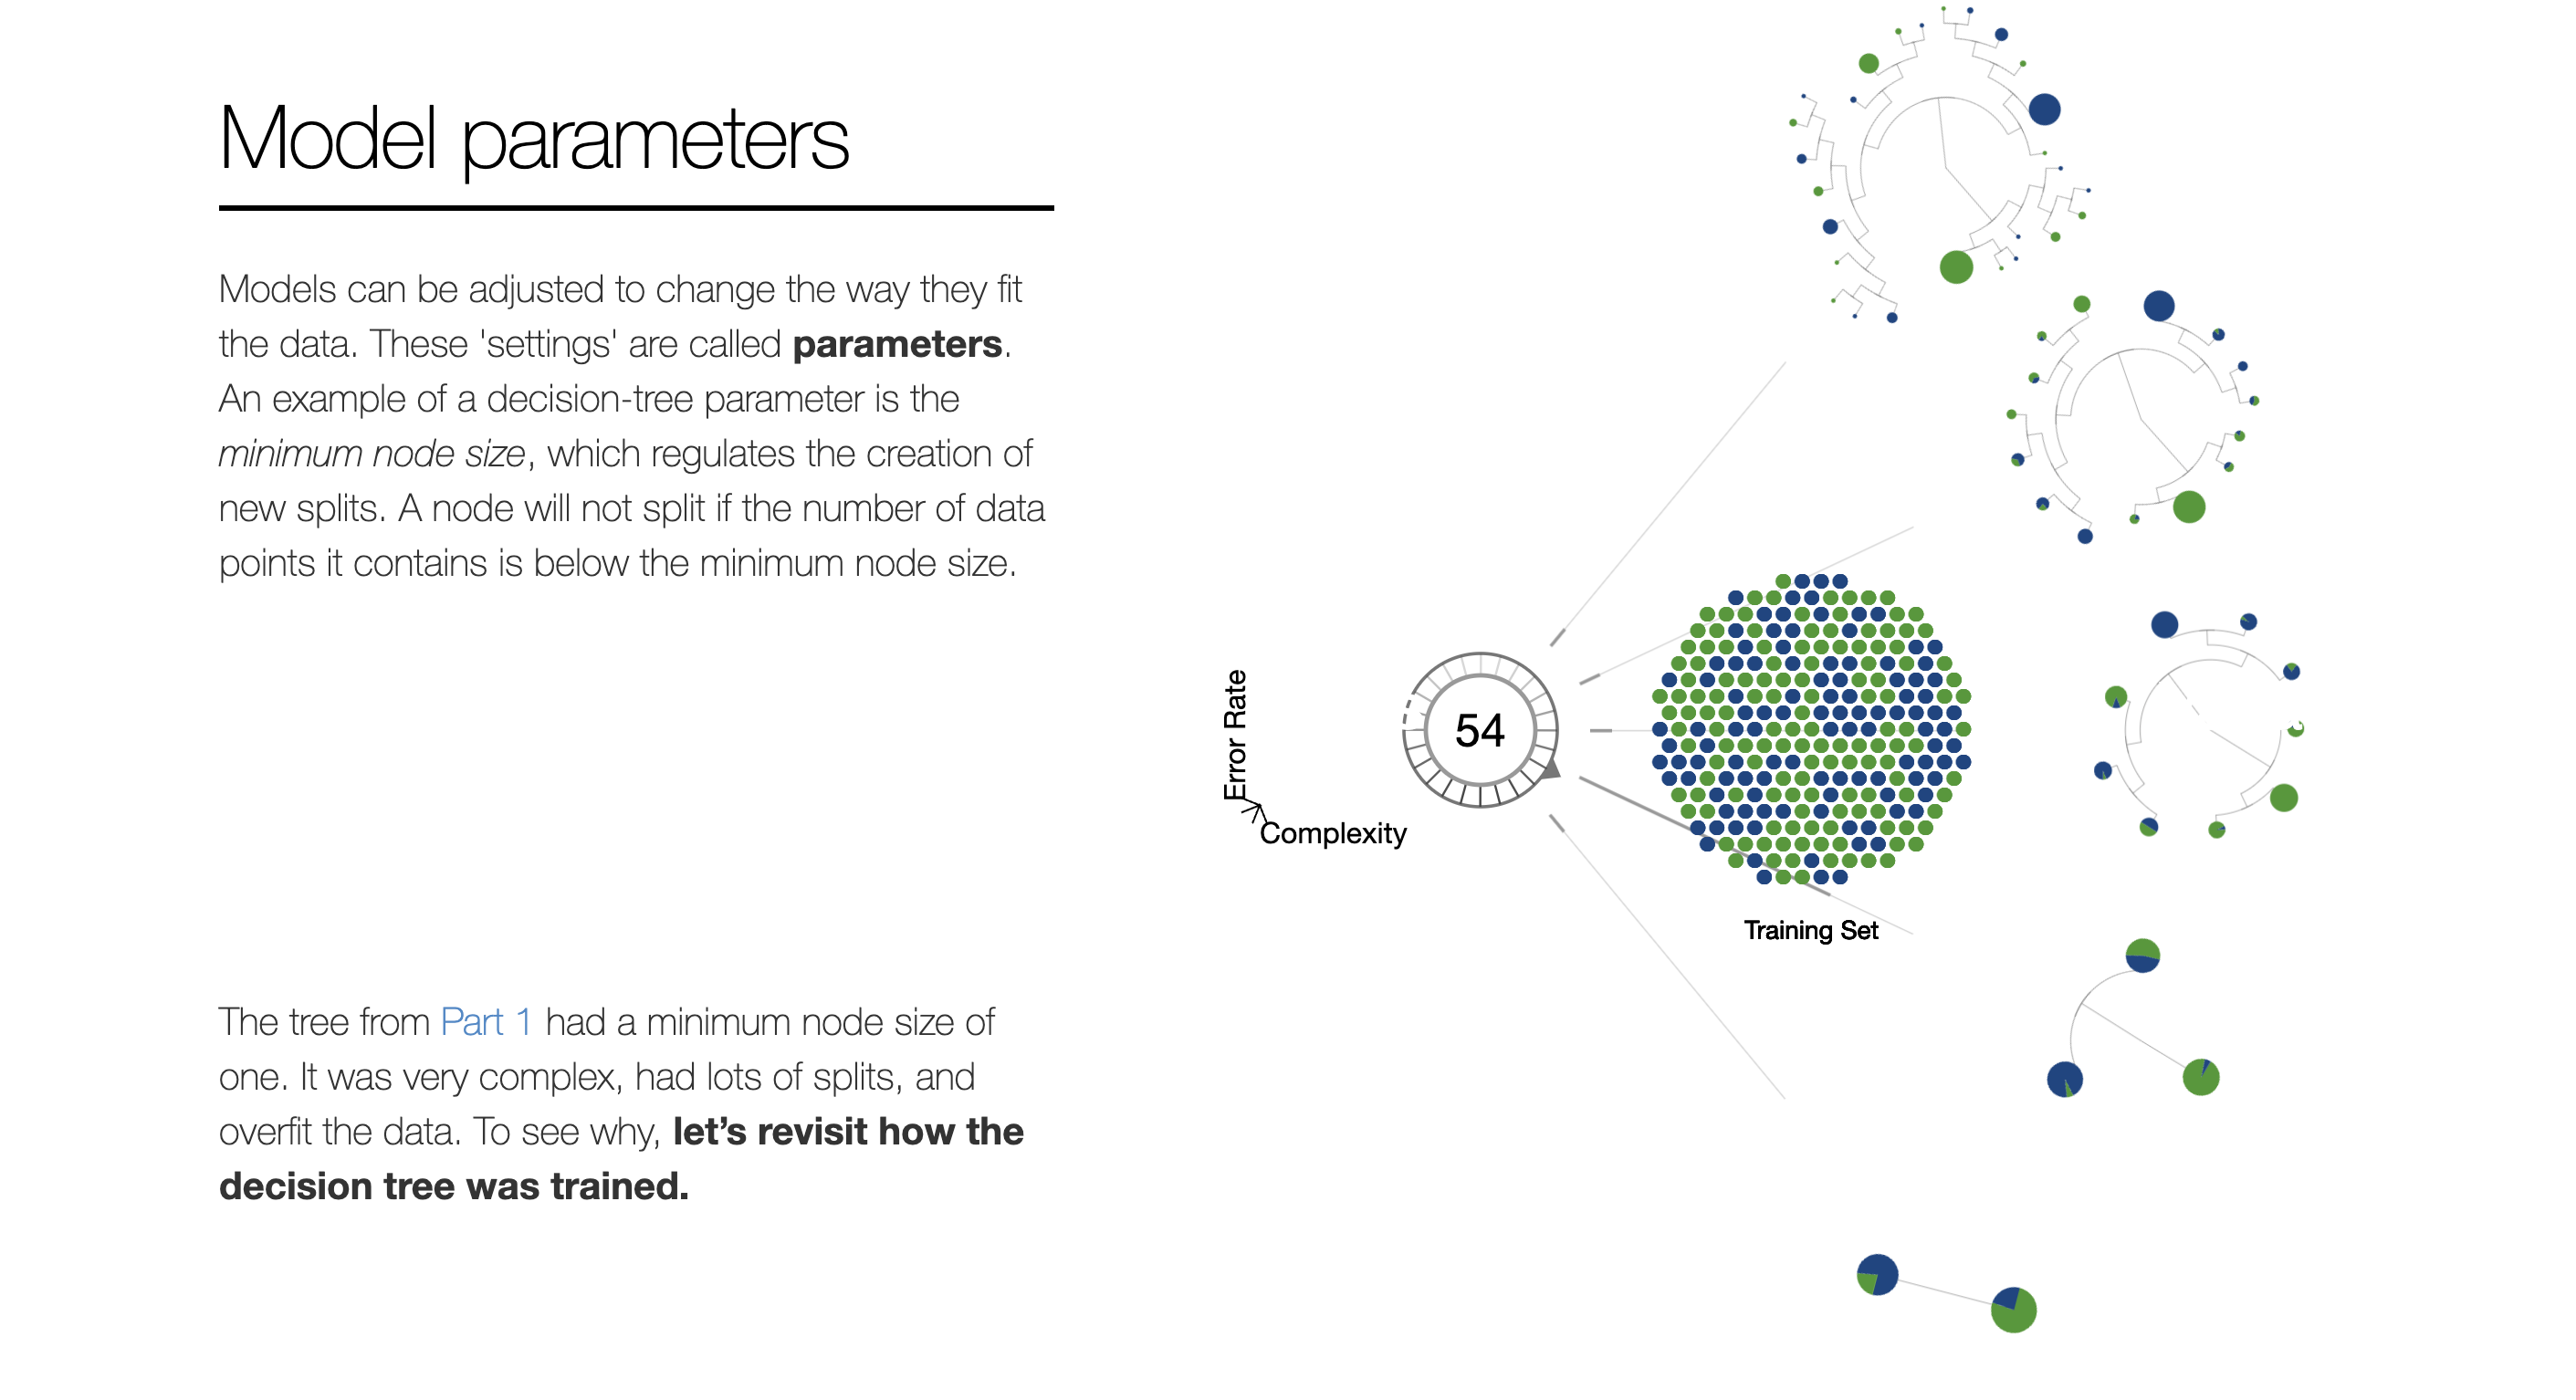
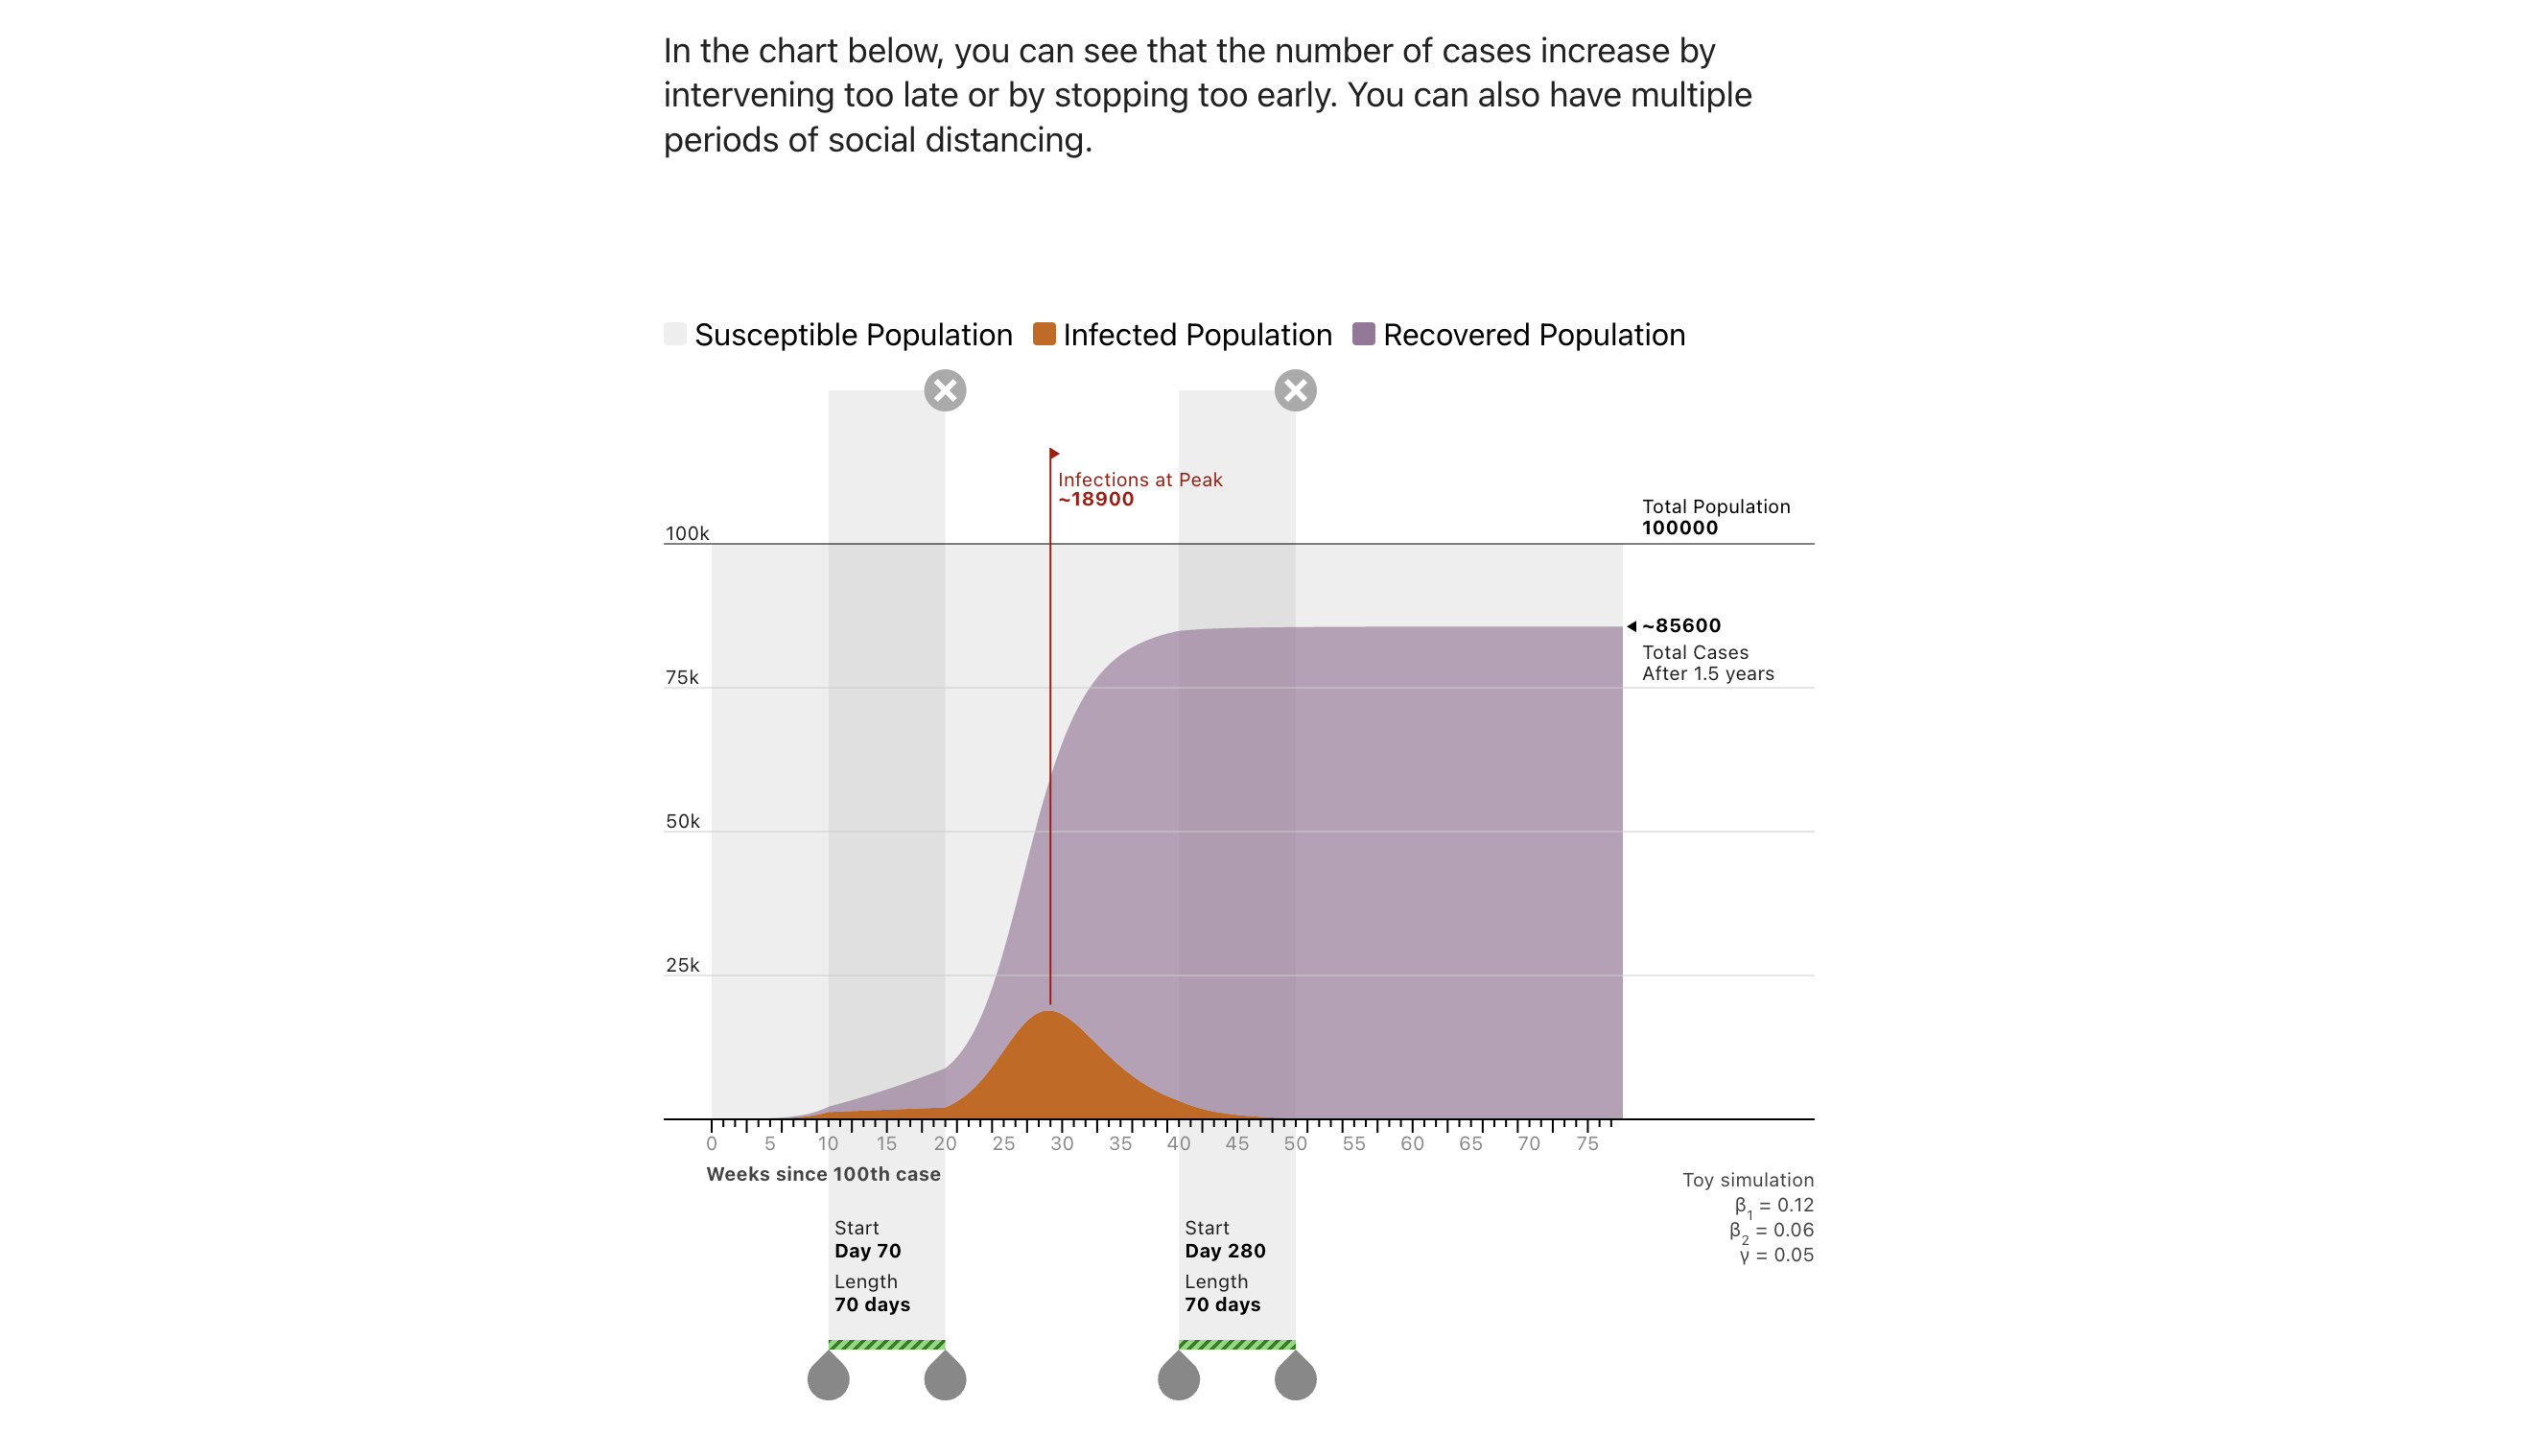
R2D3 also has a miscellaneous visualization piece on COVID-19.
-
Making sense of COVID19 through simulations
(http://www.r2d3.us/covid-19/)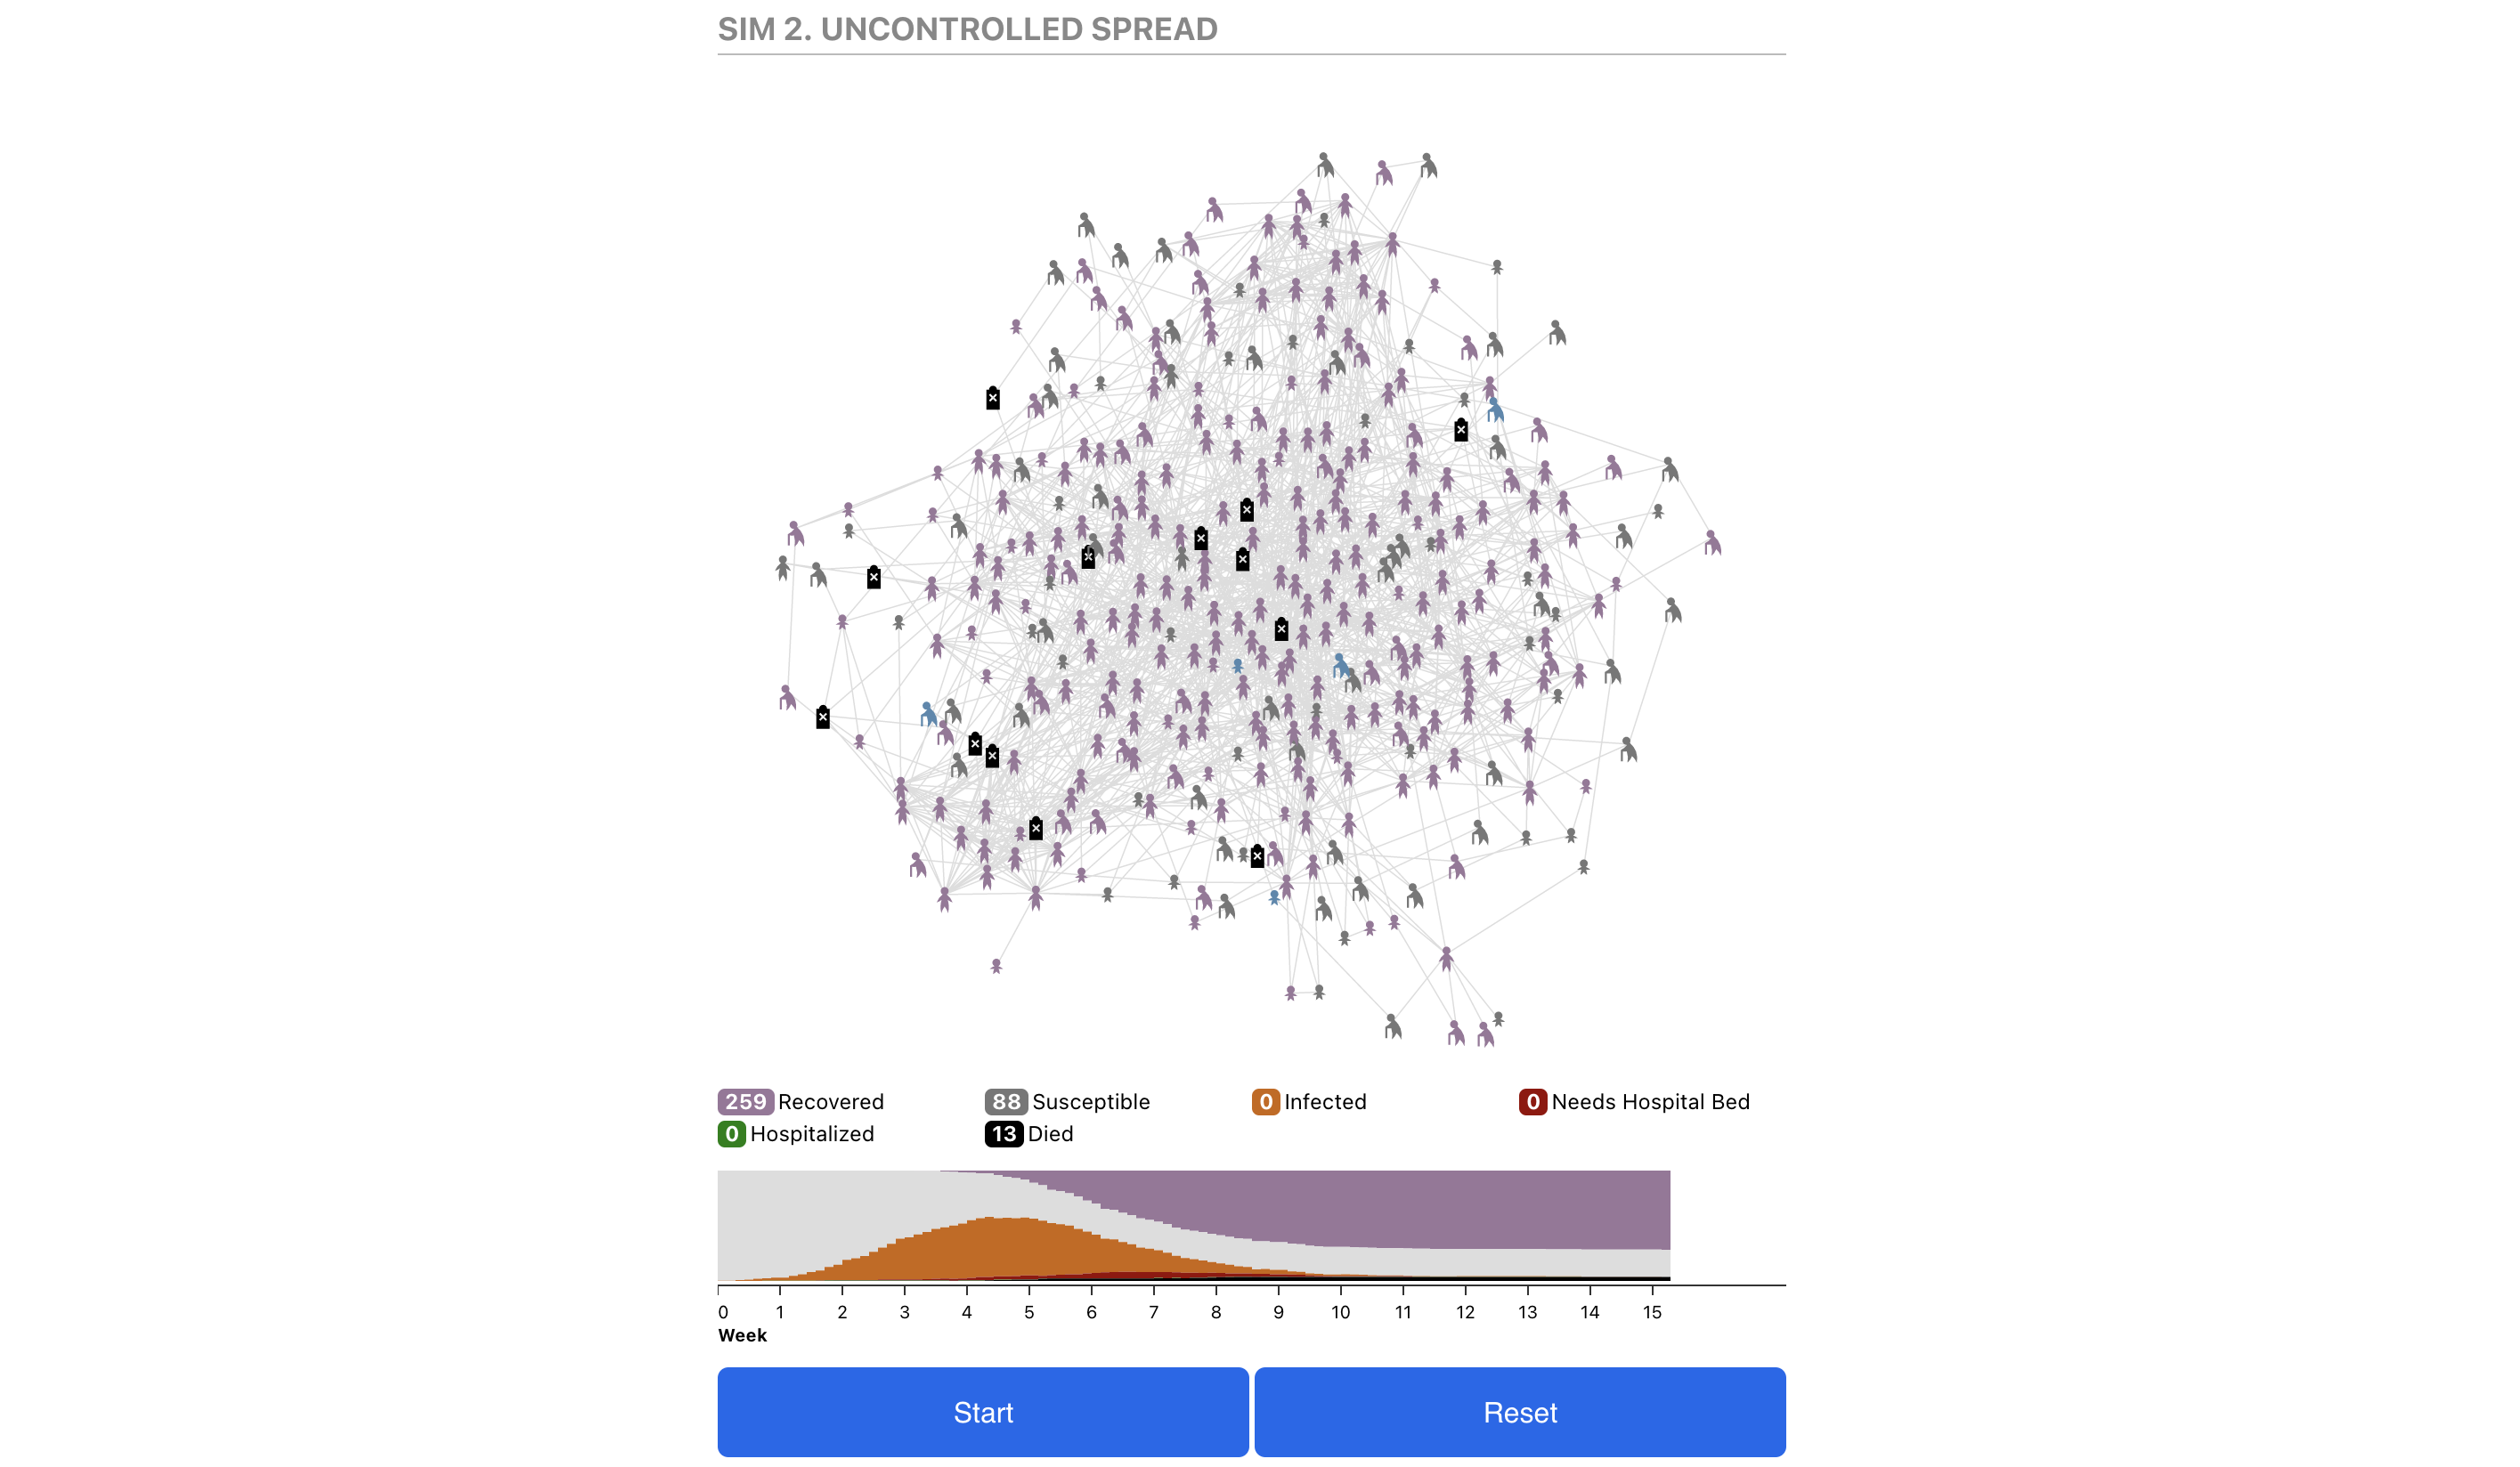
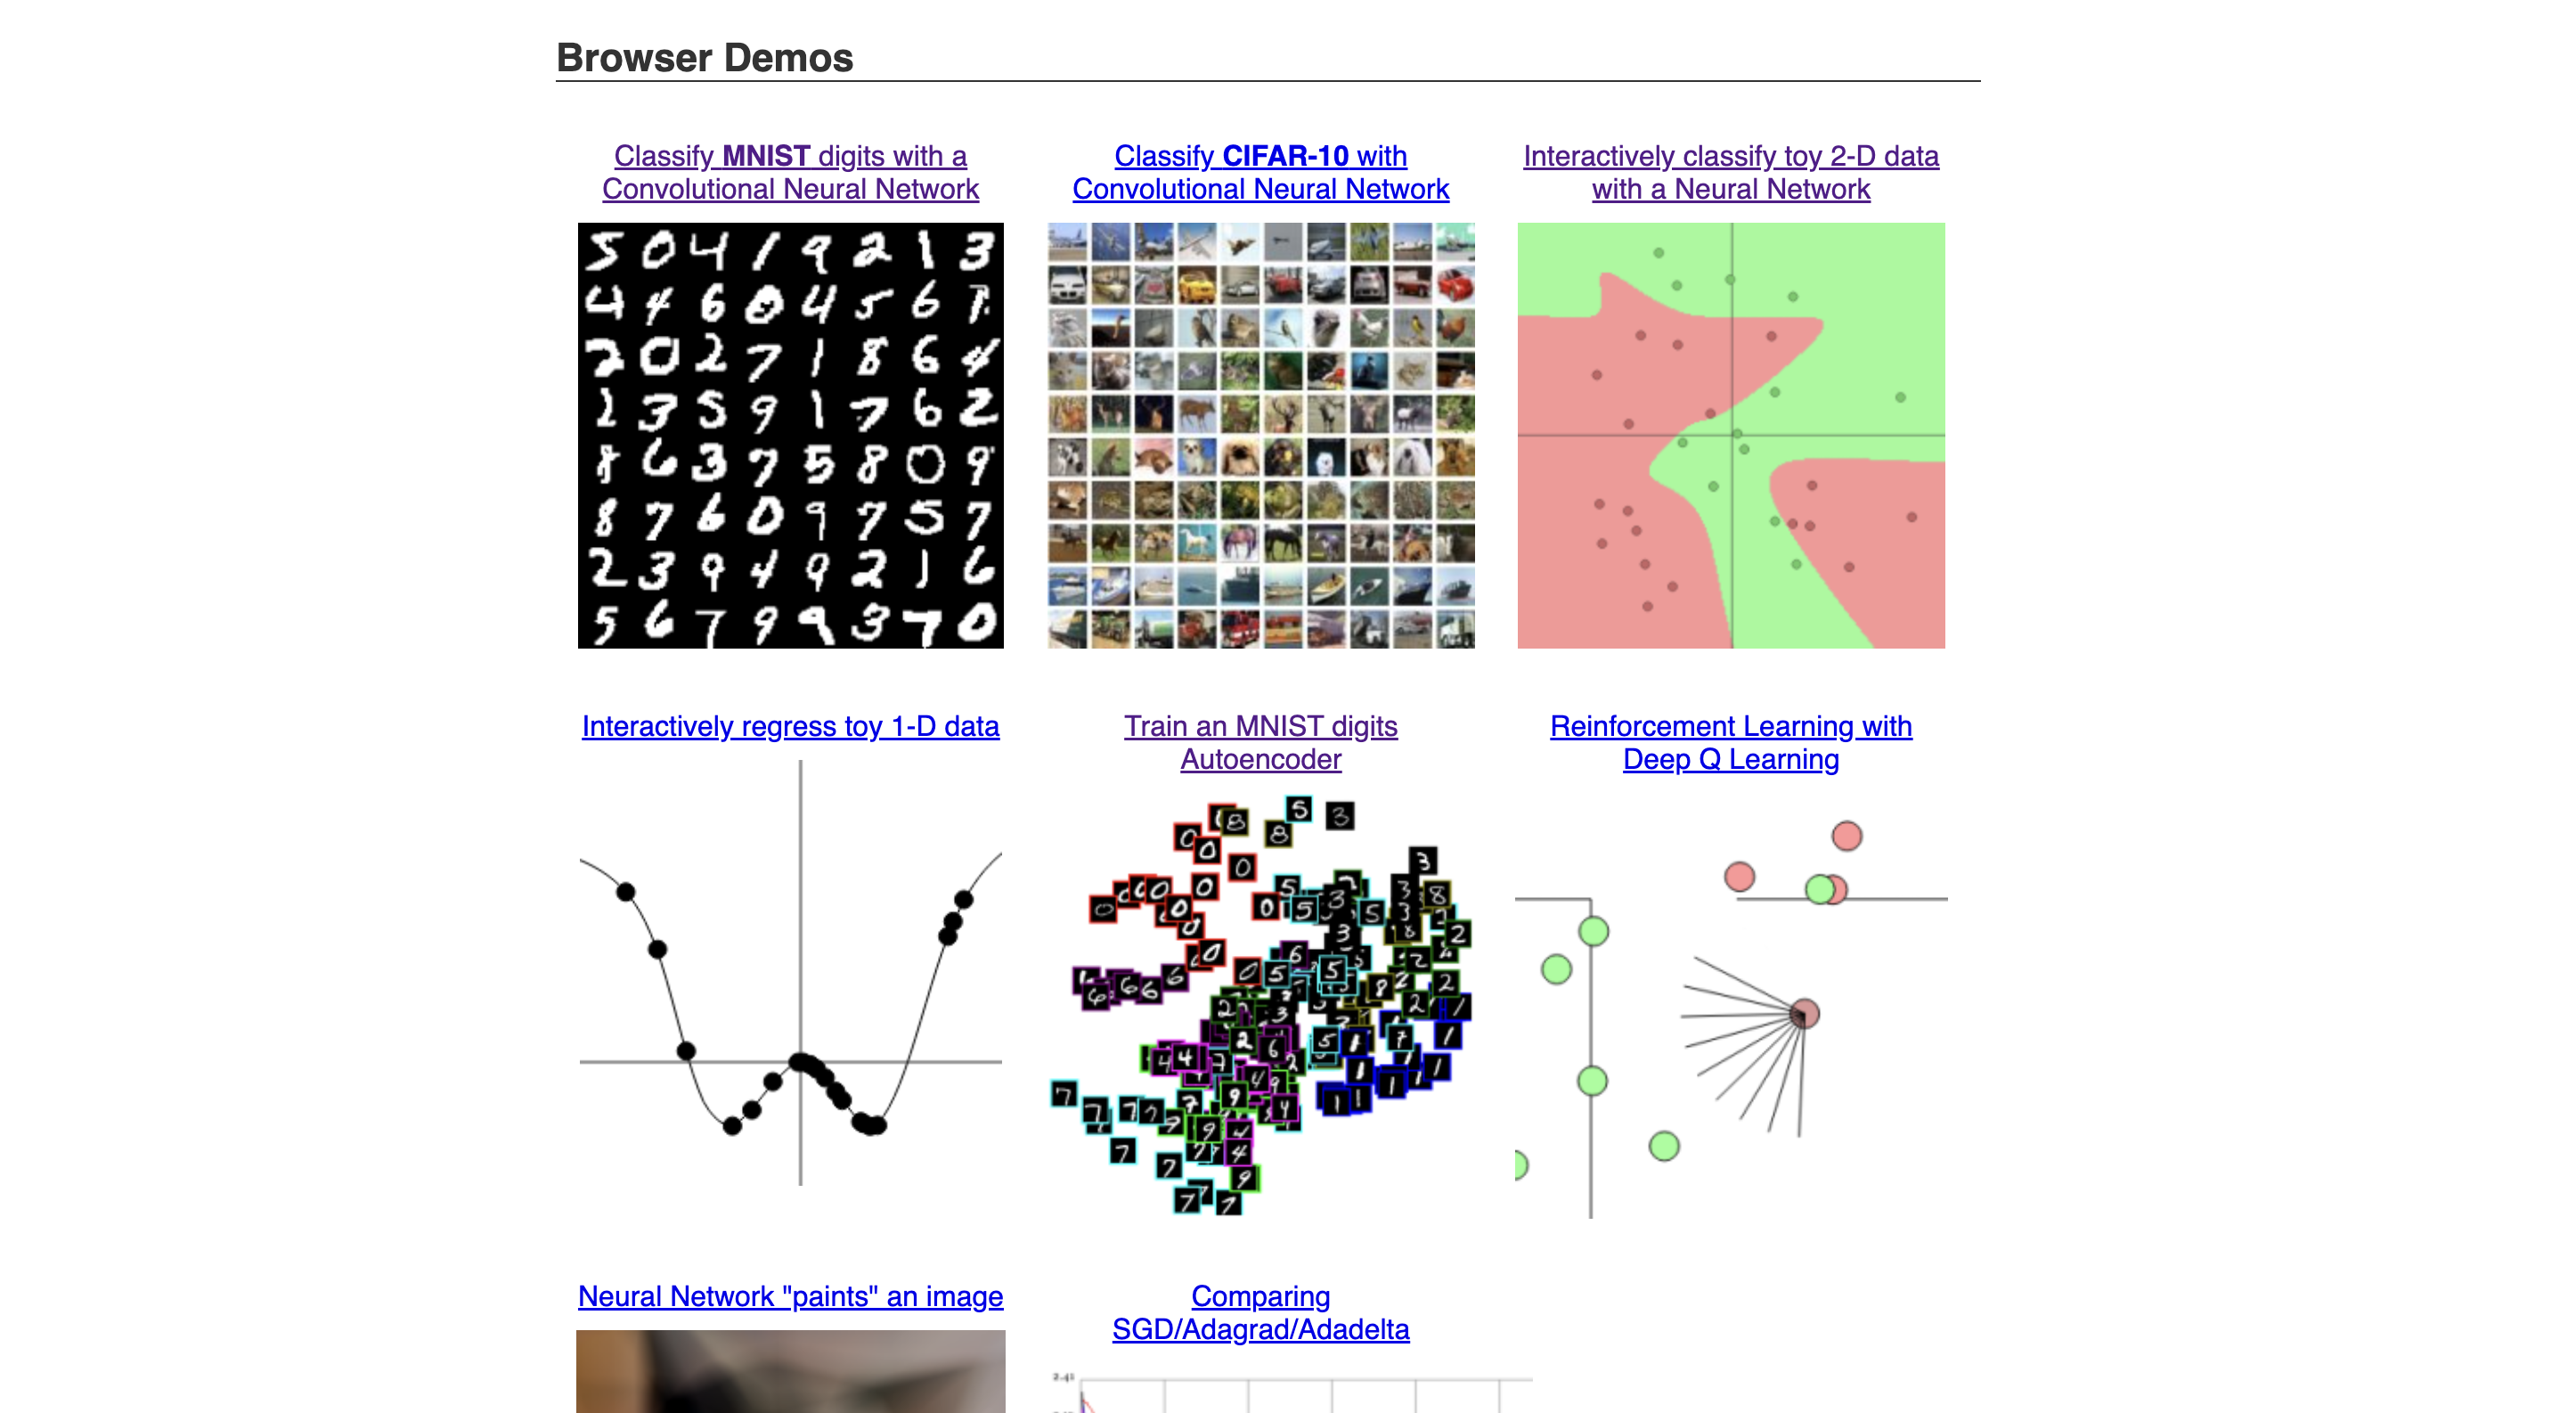
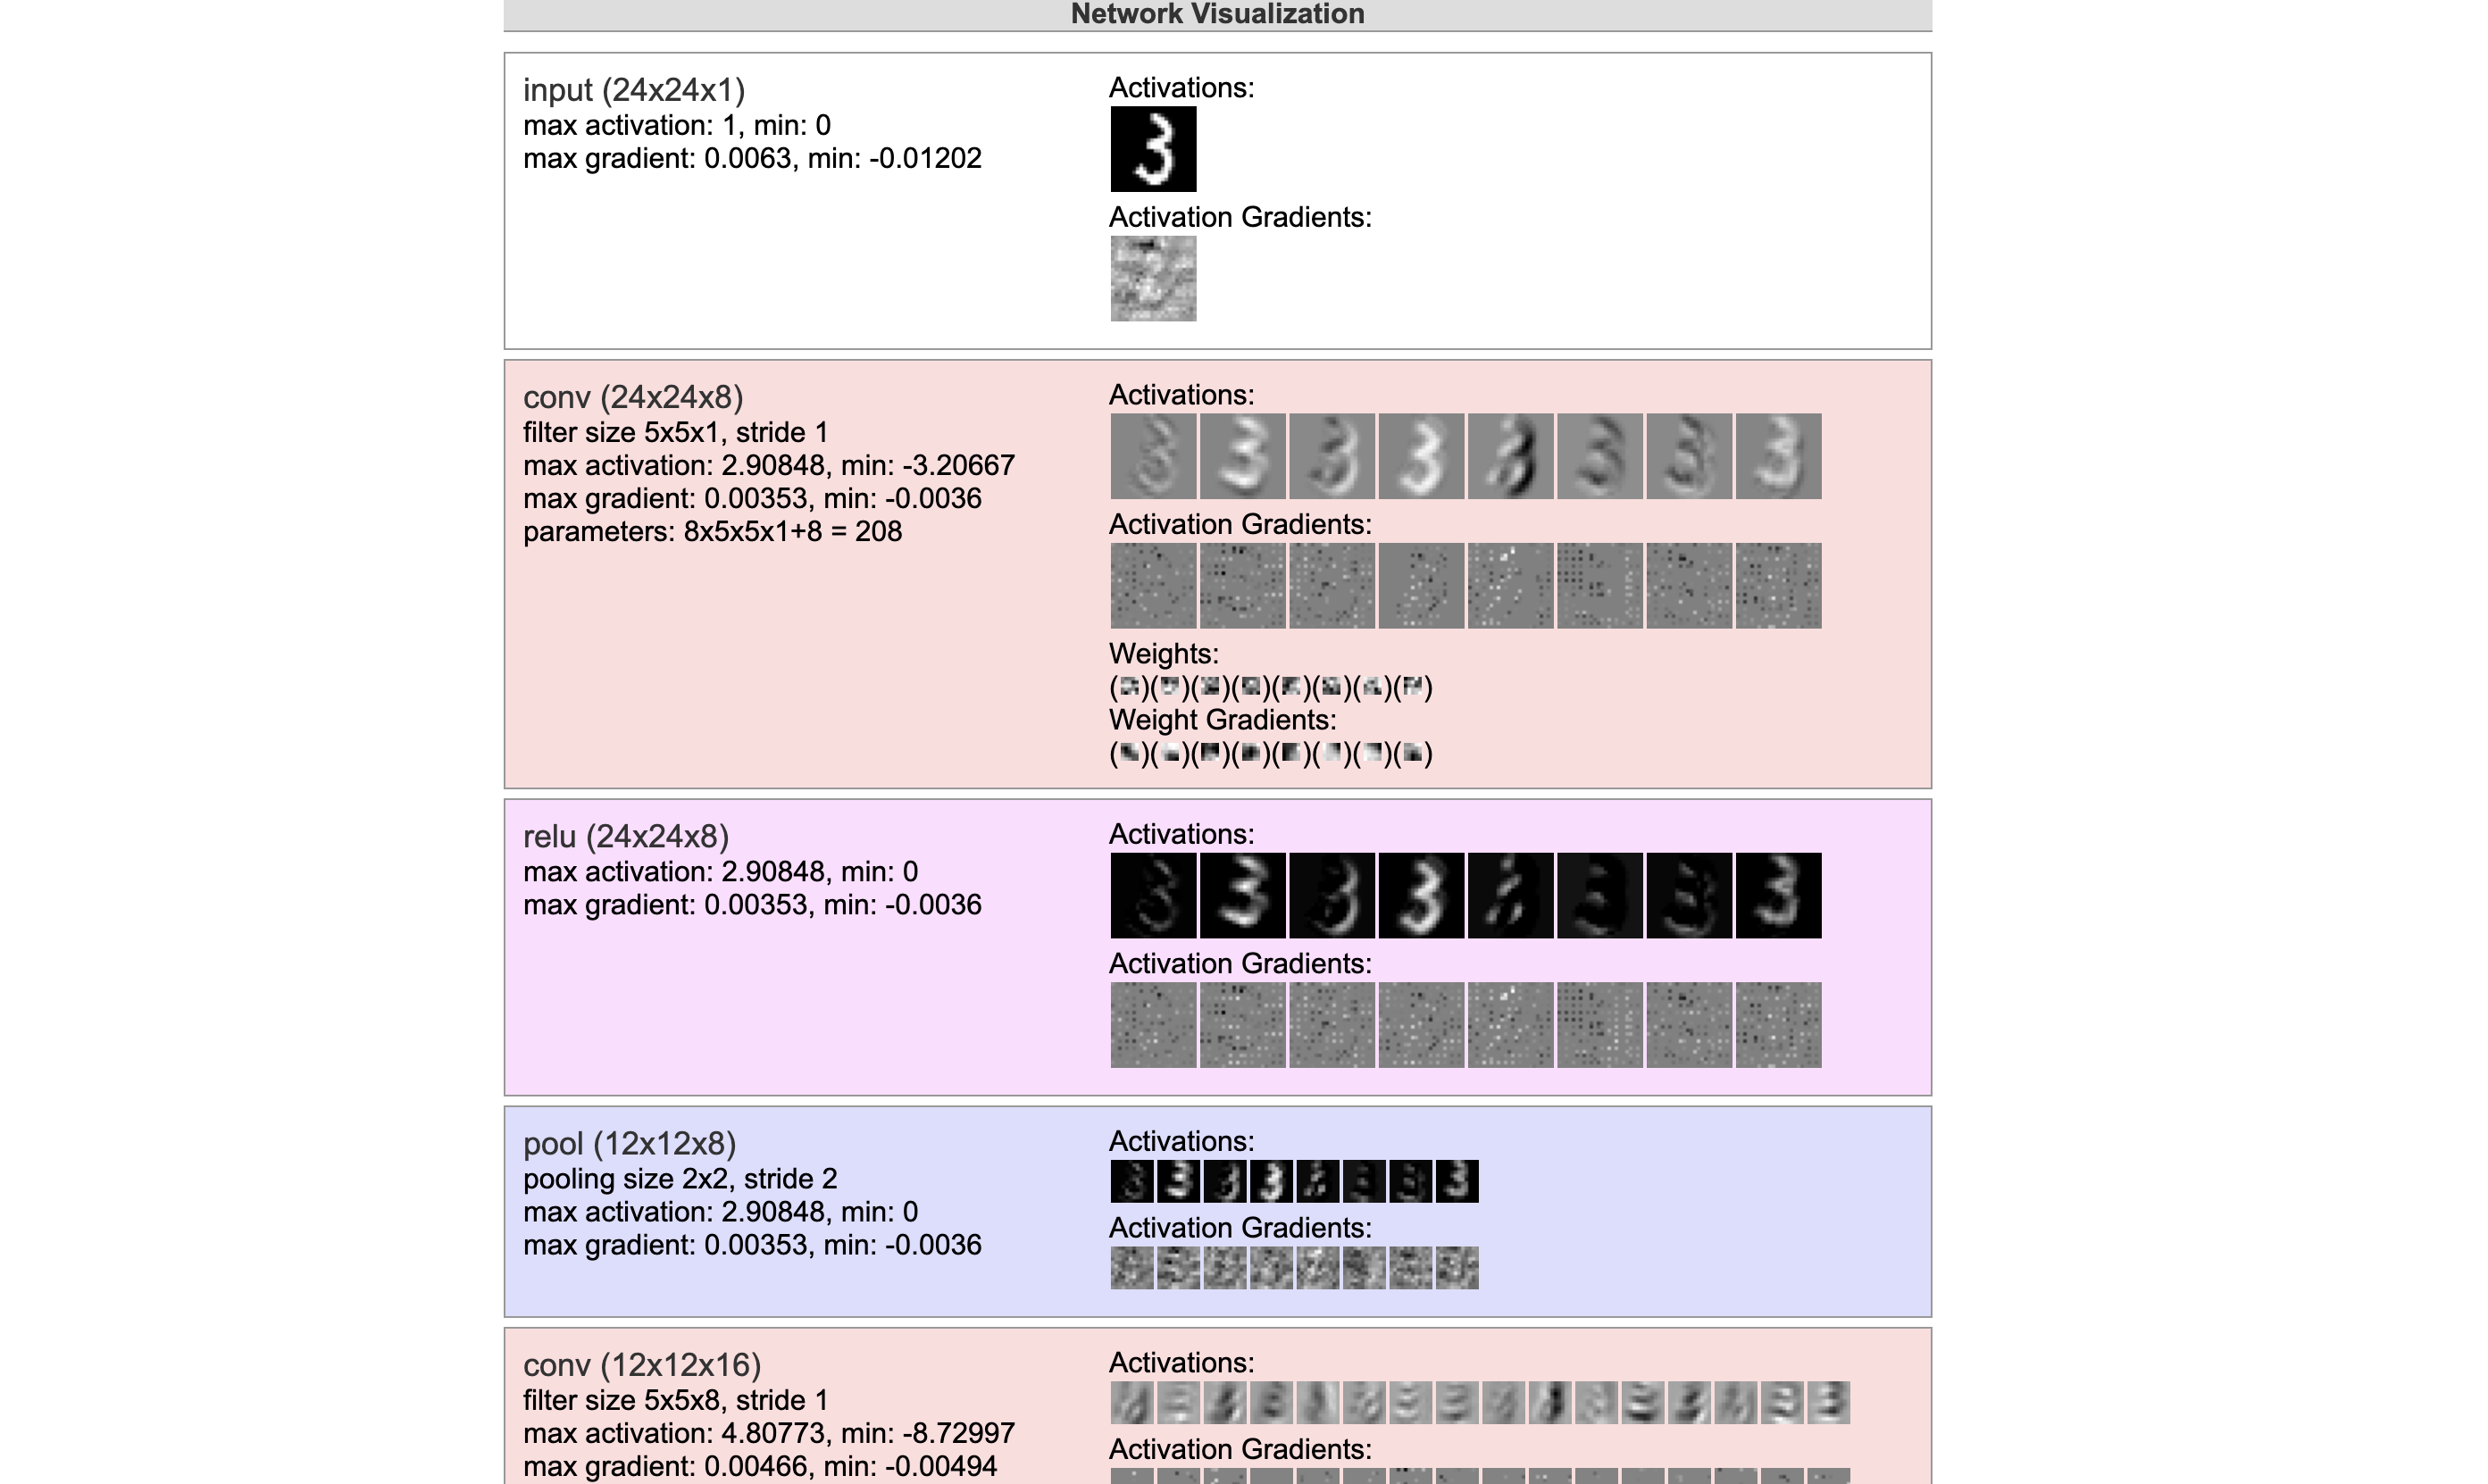
54.4.2 2. ConvNetJS
Link: https://cs.stanford.edu/people/karpathy/convnetjs/index.html
ConvNetJS is a Javascript library for training Deep Learning models (Neural Networks) entirely in your browser. It has an additional functionality of visualizing the models and the outputs at various layers. It’s a great resource to explore some frequently used data sets and models.
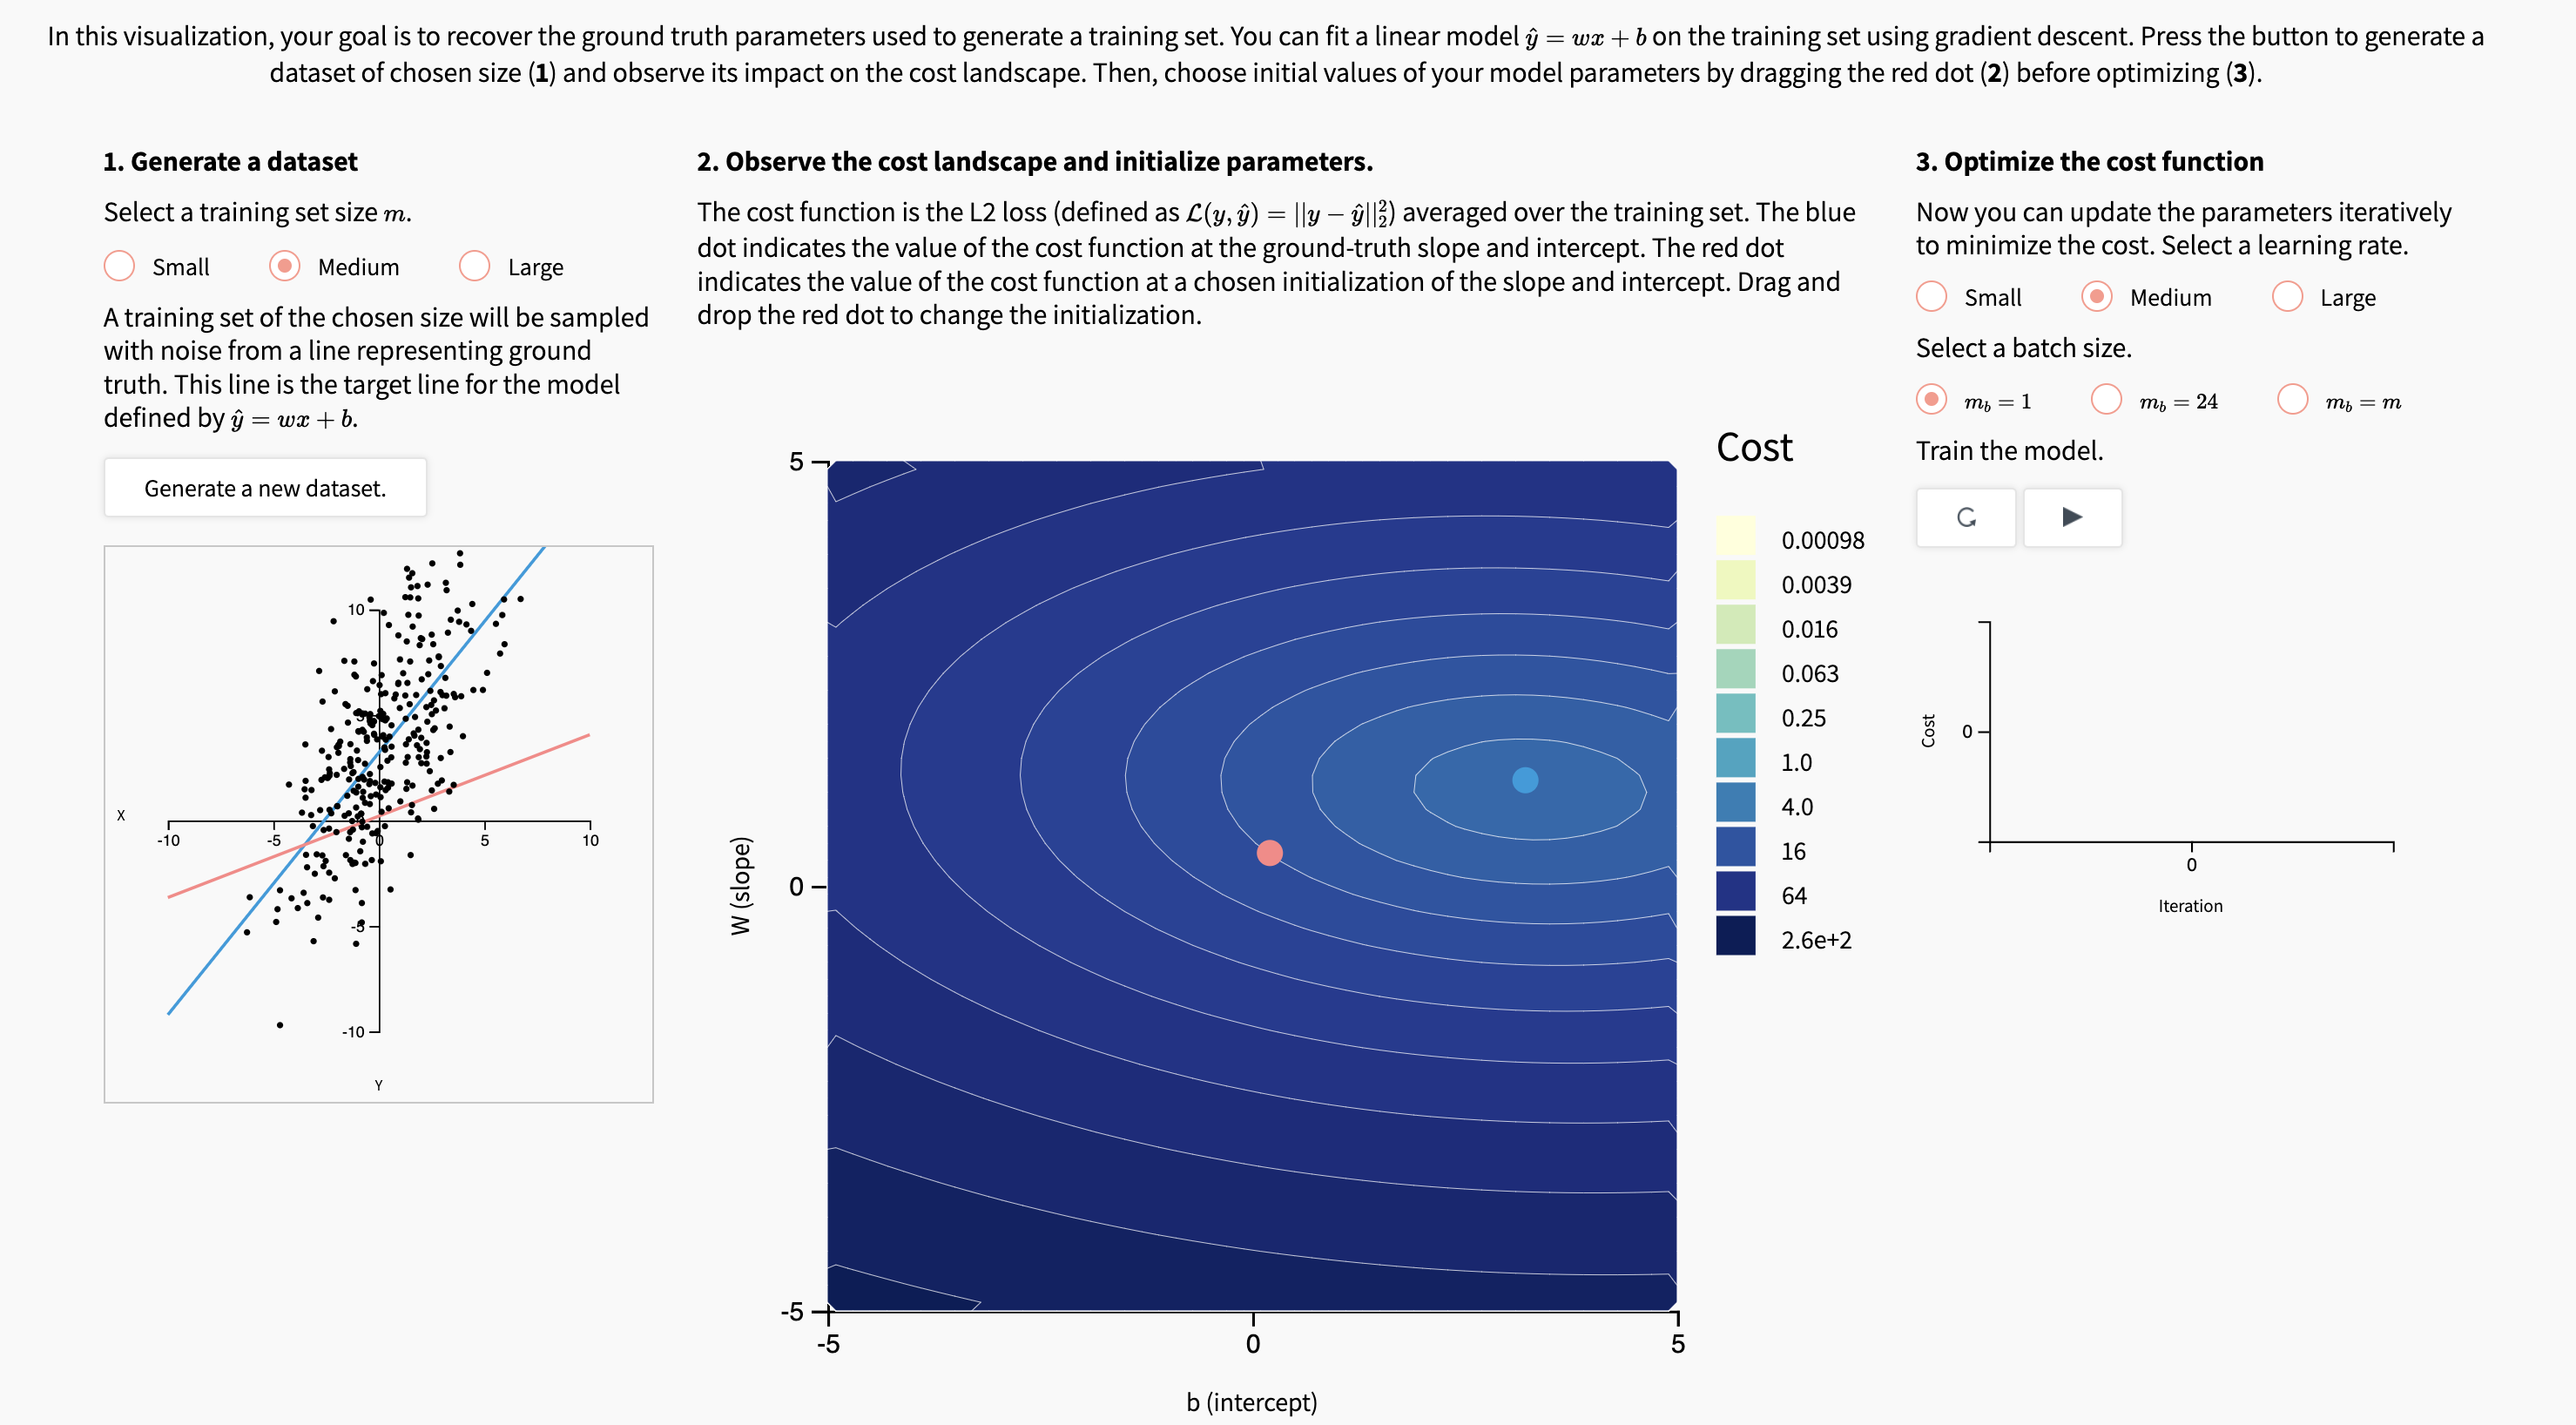
54.4.3 3. AI Notes by DeepLearning.AI
Link: https://www.deeplearning.ai/ai-notes/index.html
AI Notes is a series of long-form tutorials with interactive visualizations that help build intuition about foundational deep learning concepts. It is broken down into 2 parts:
-
Initializing neural networks
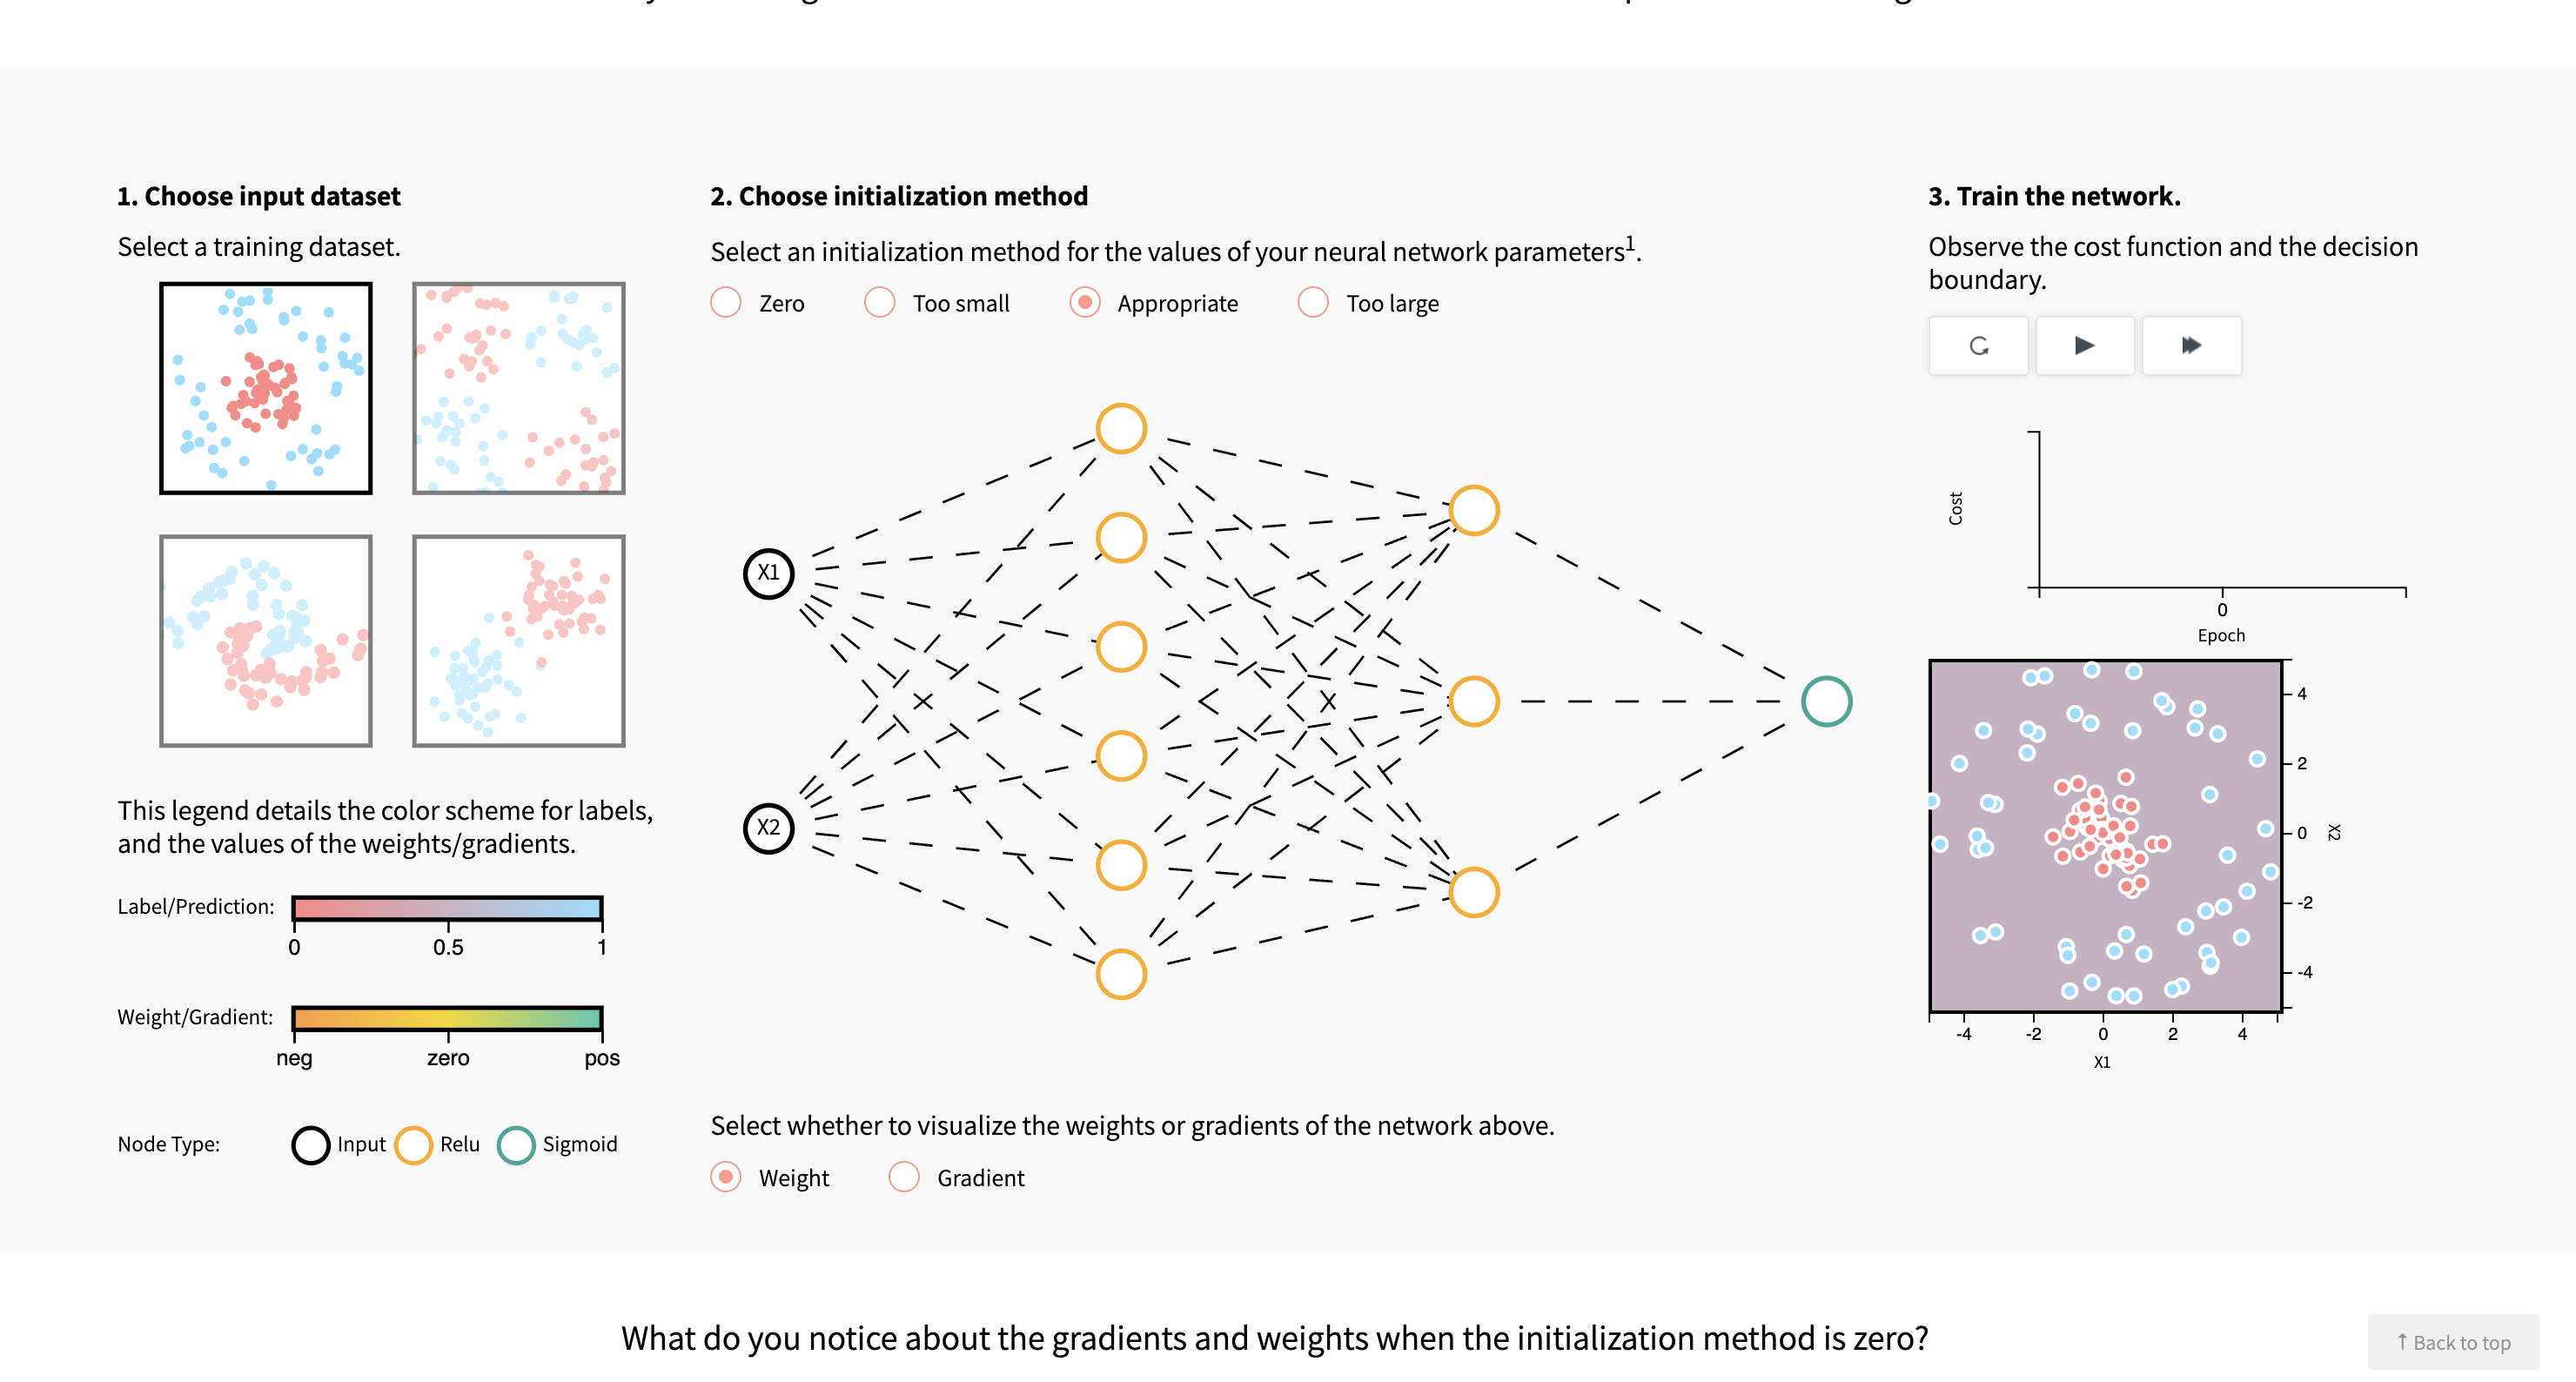
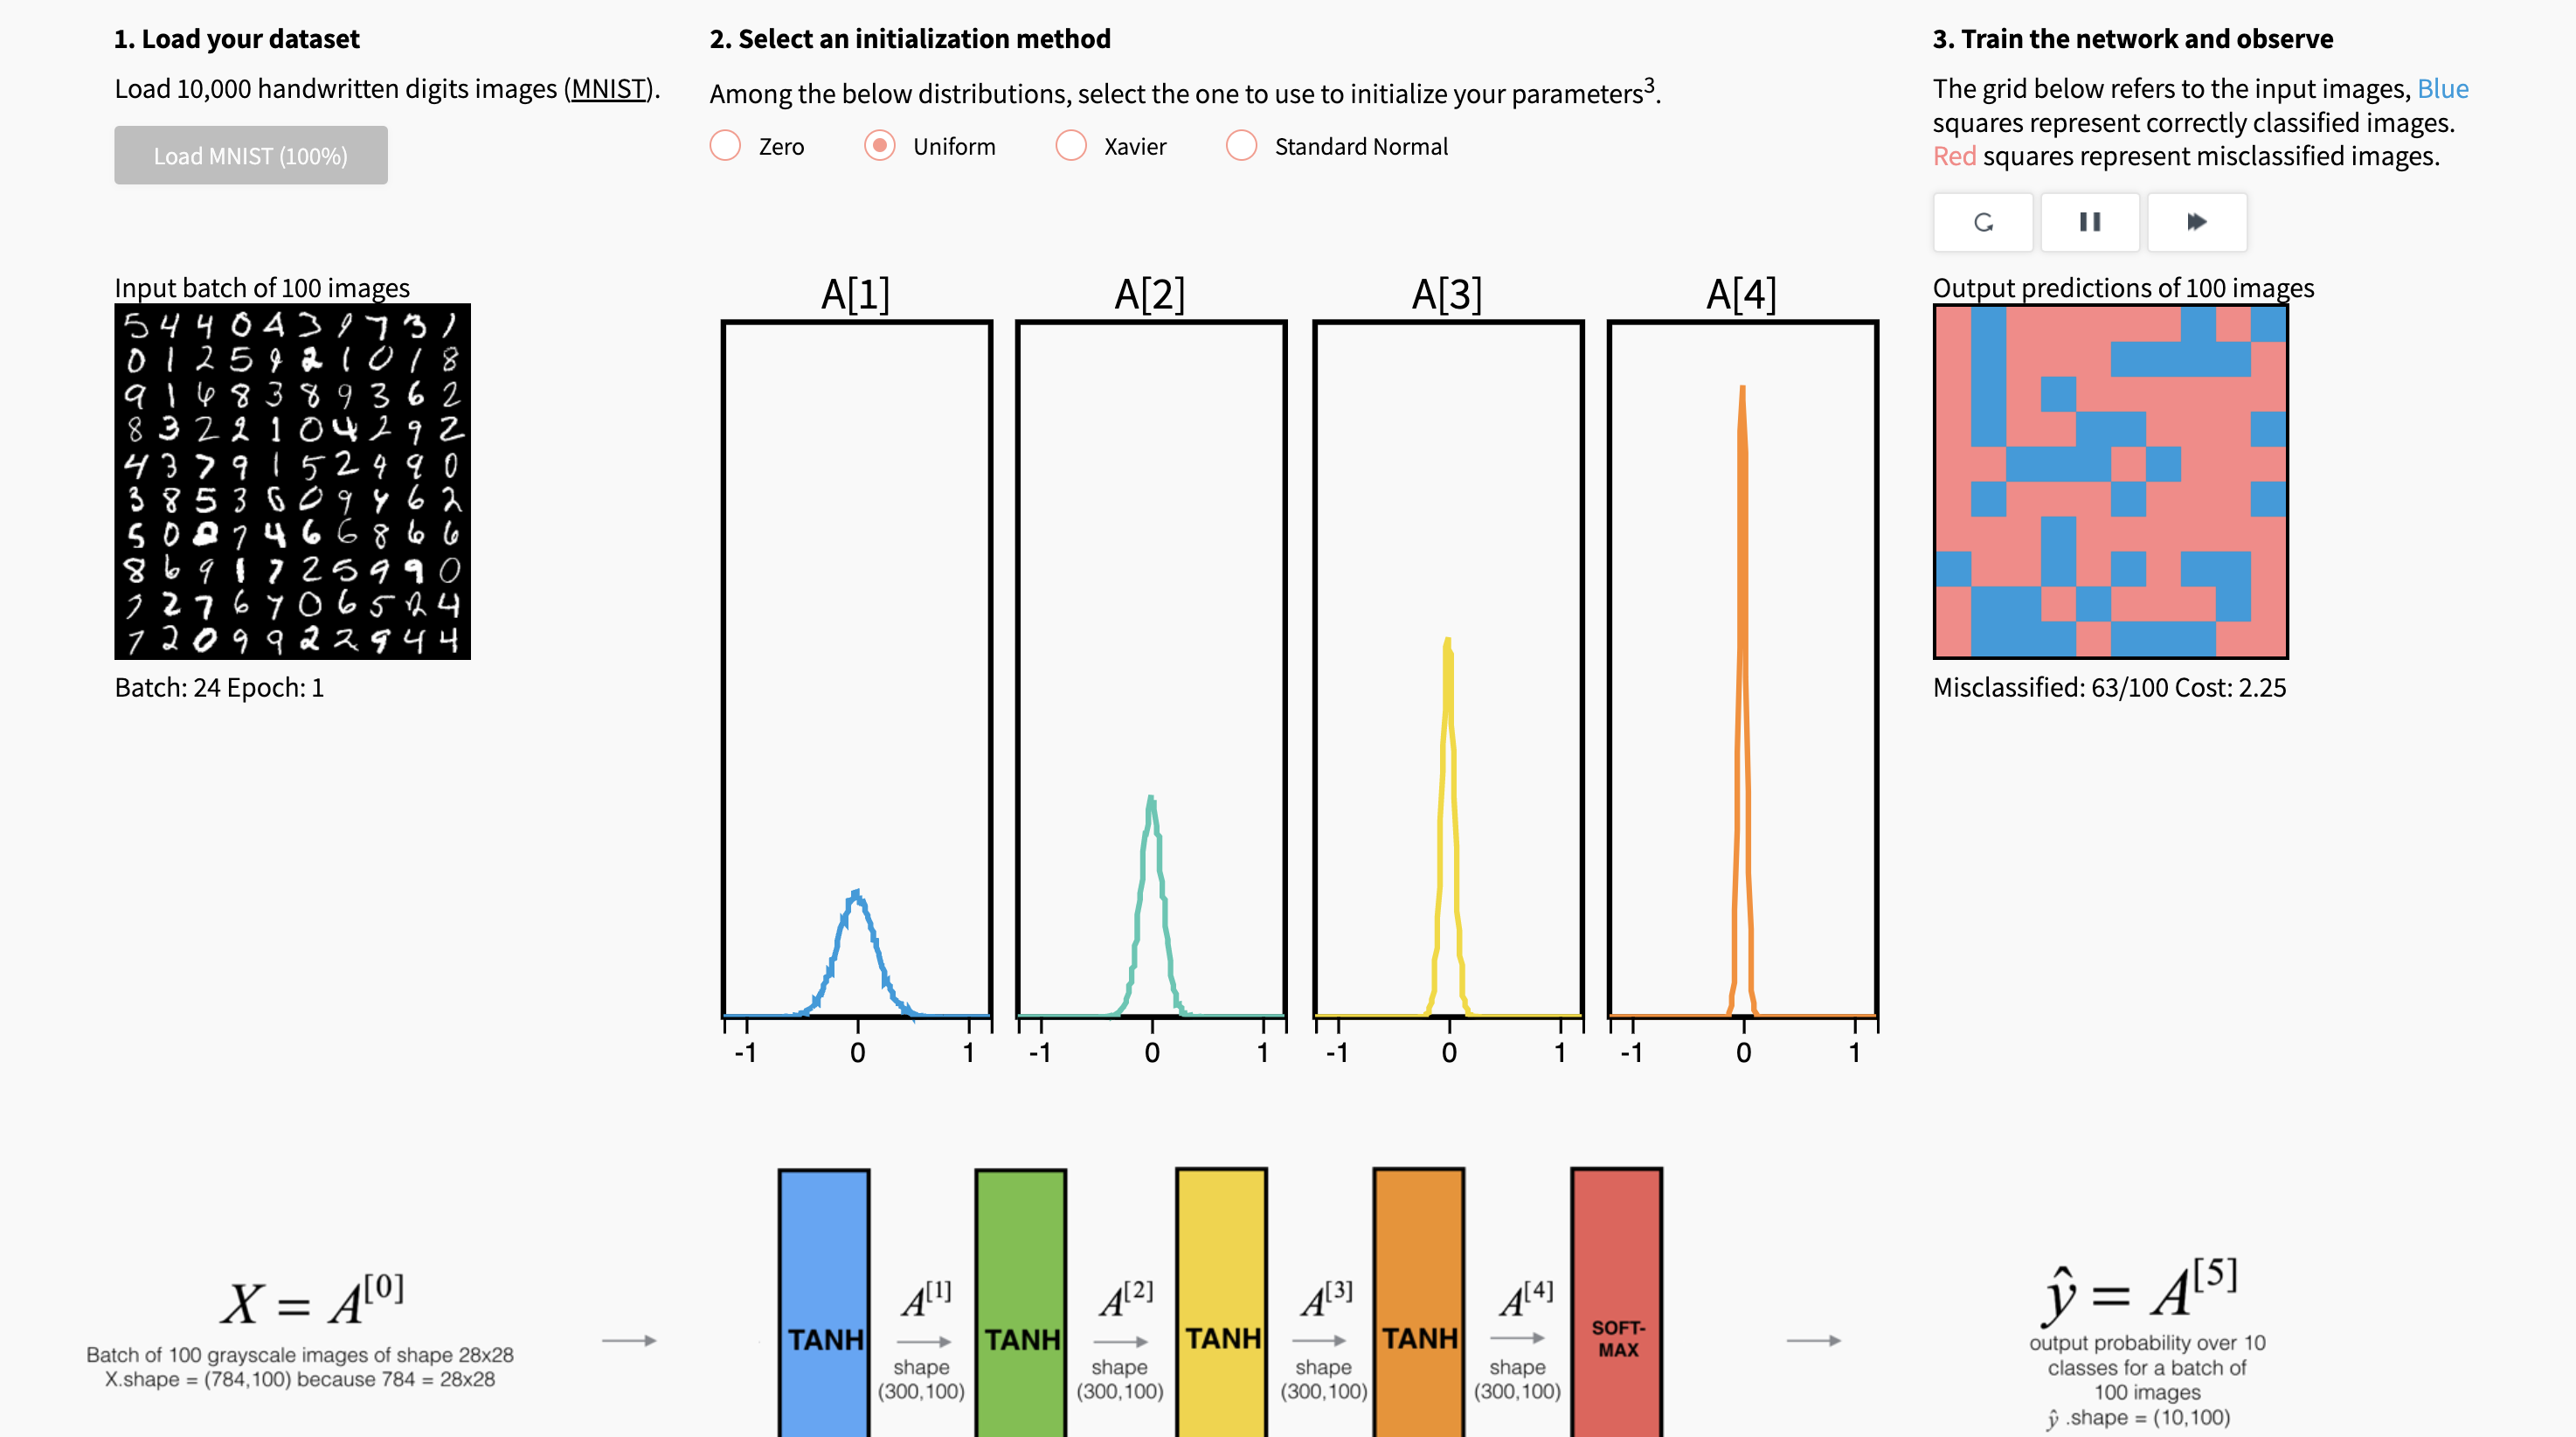
-
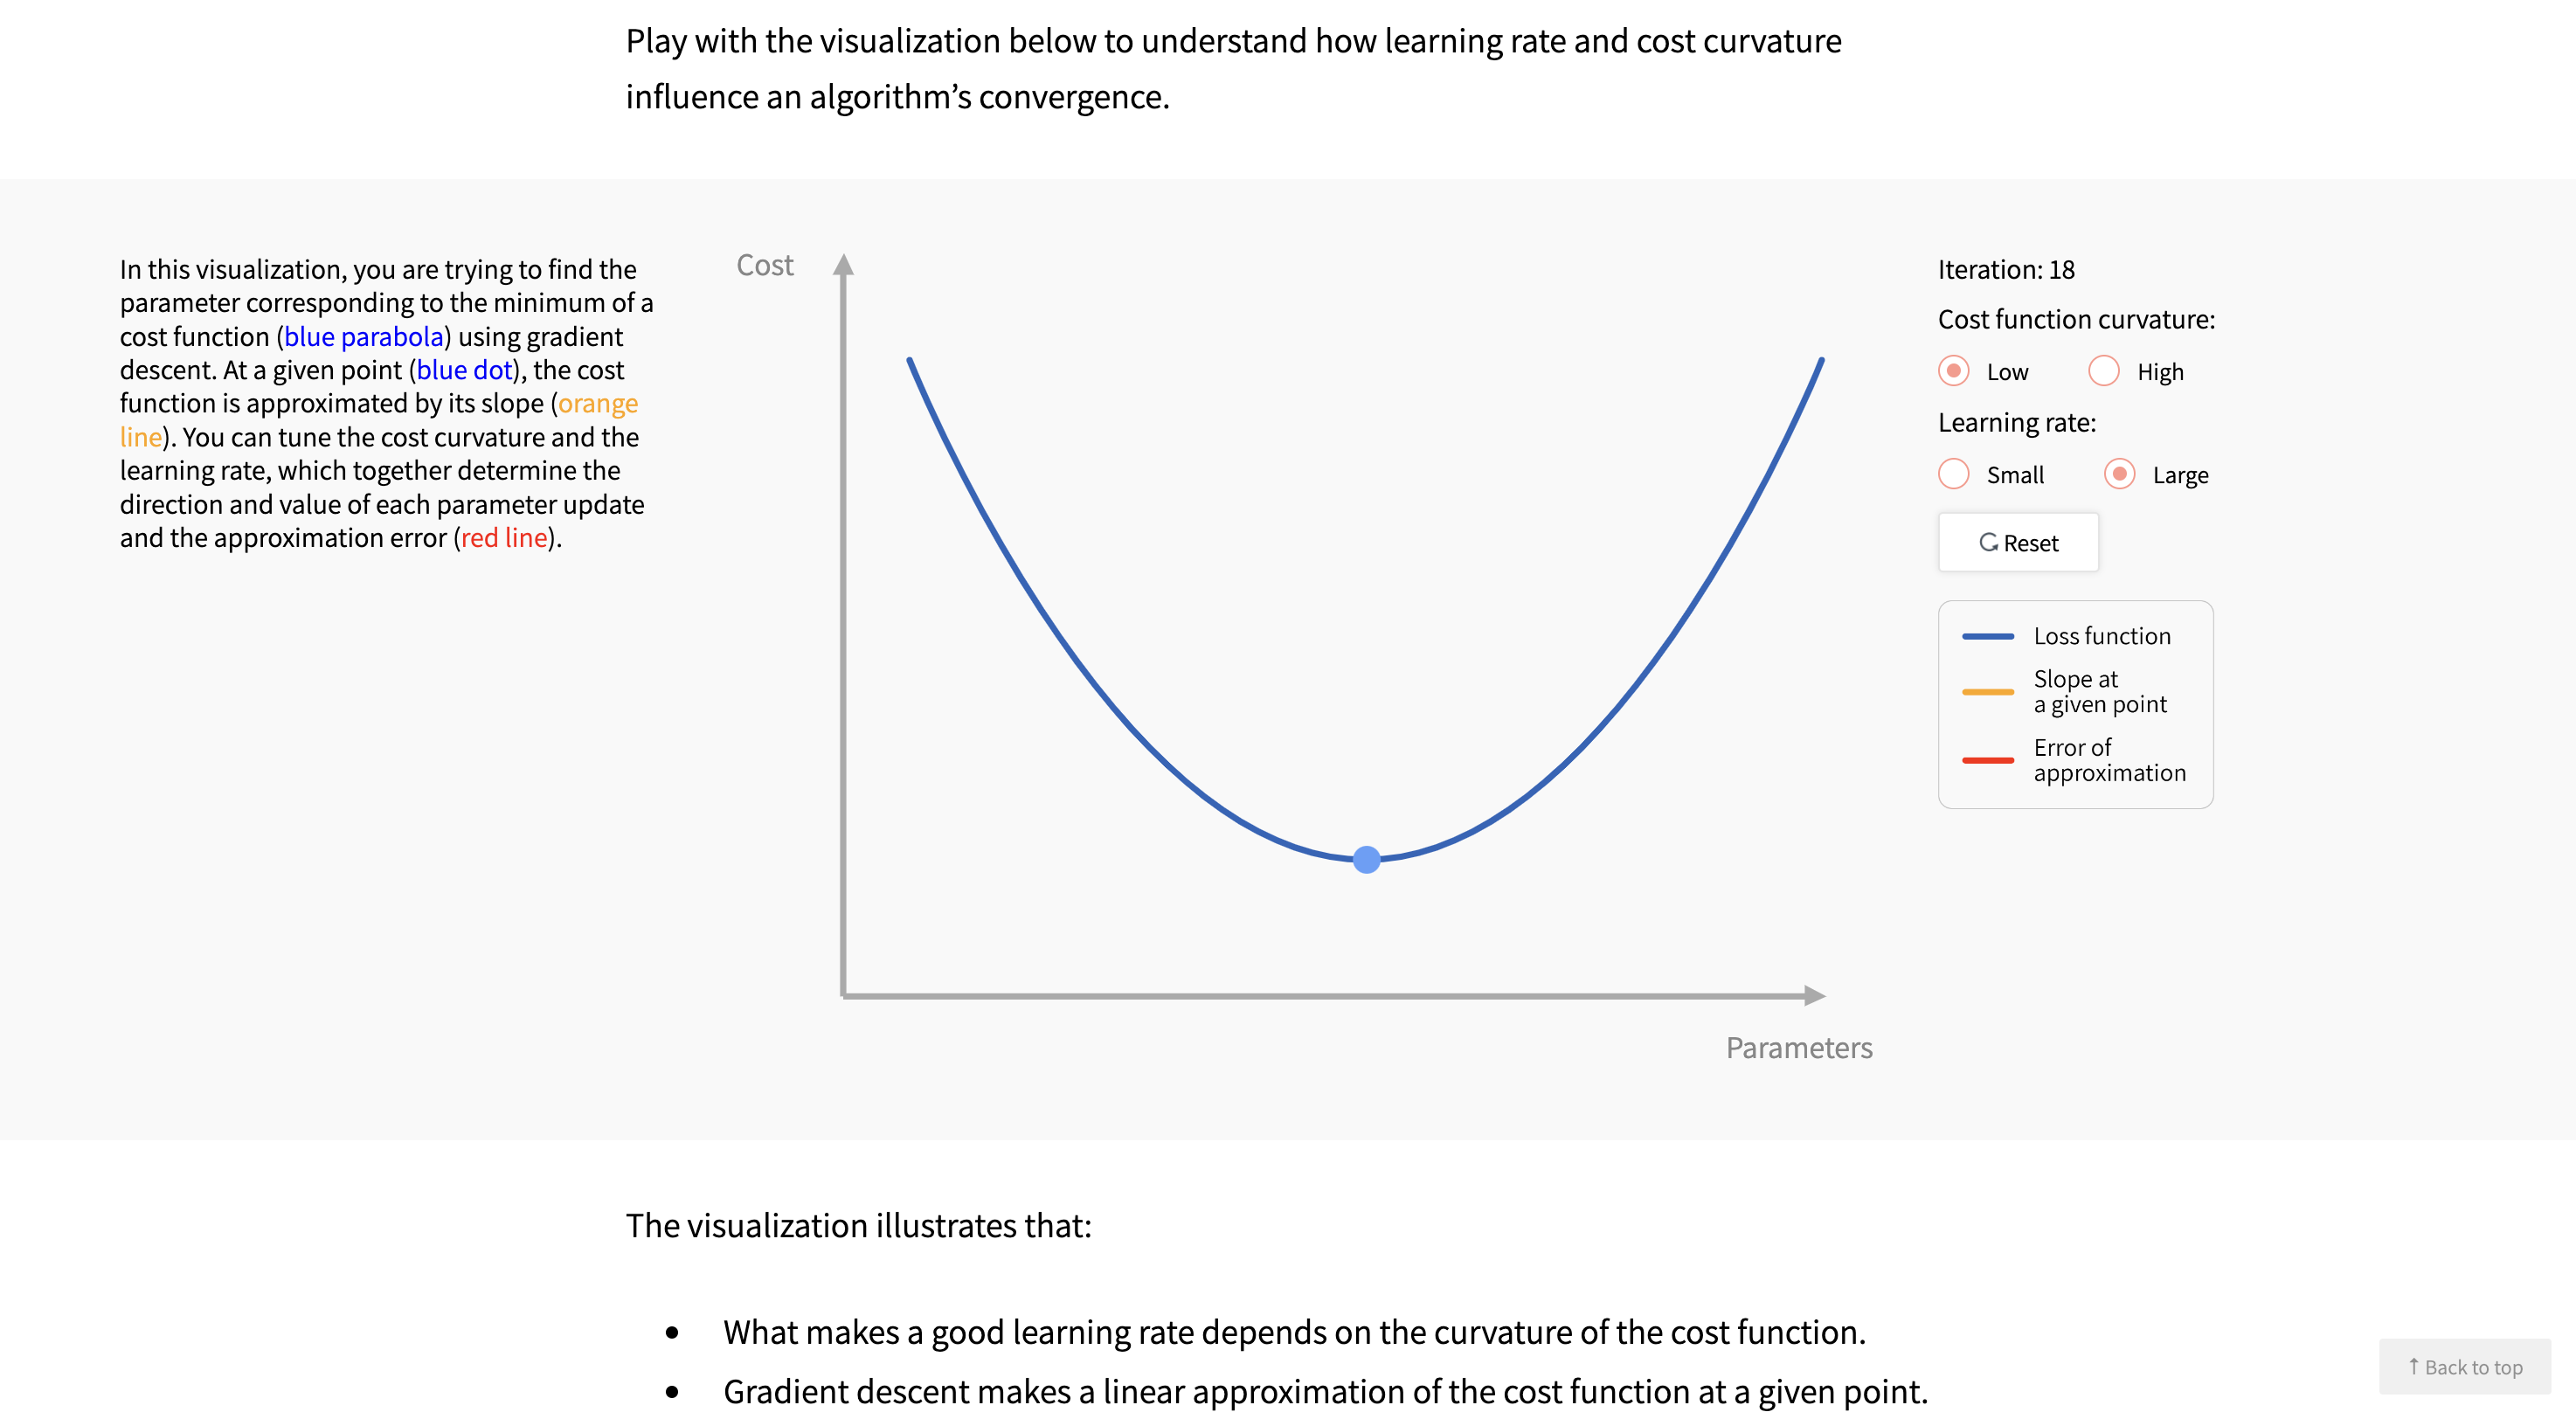
Parameter optimization in neural networks
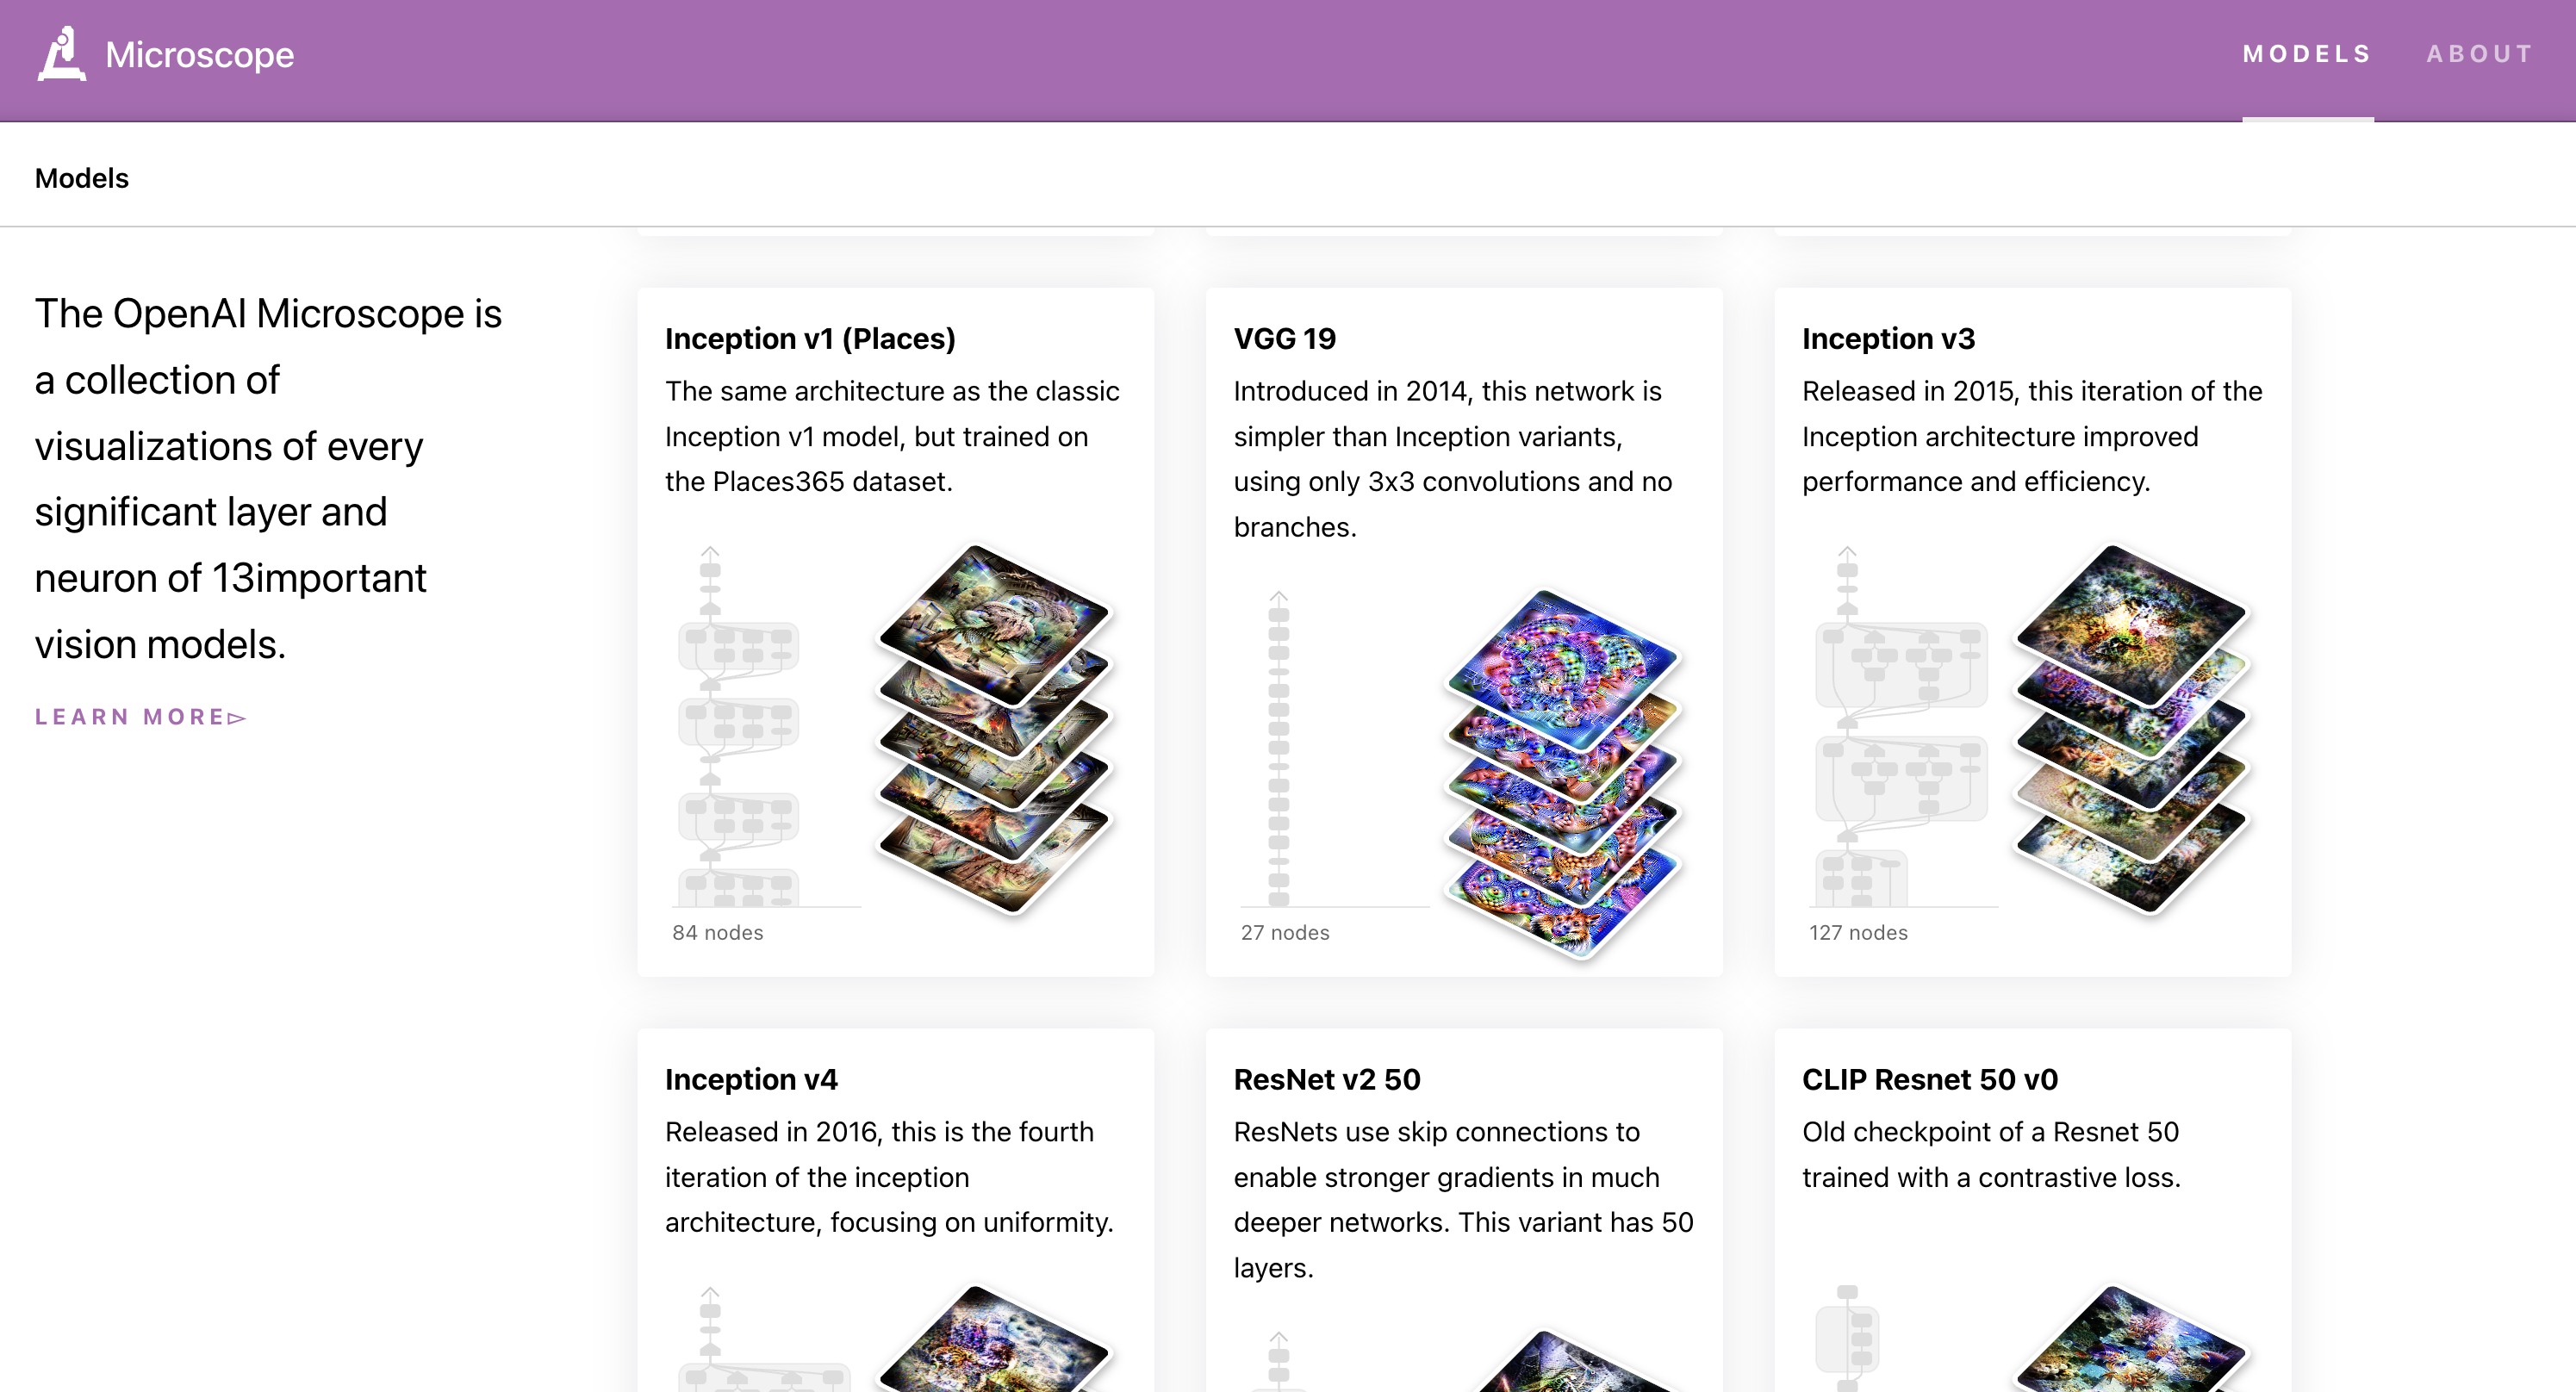
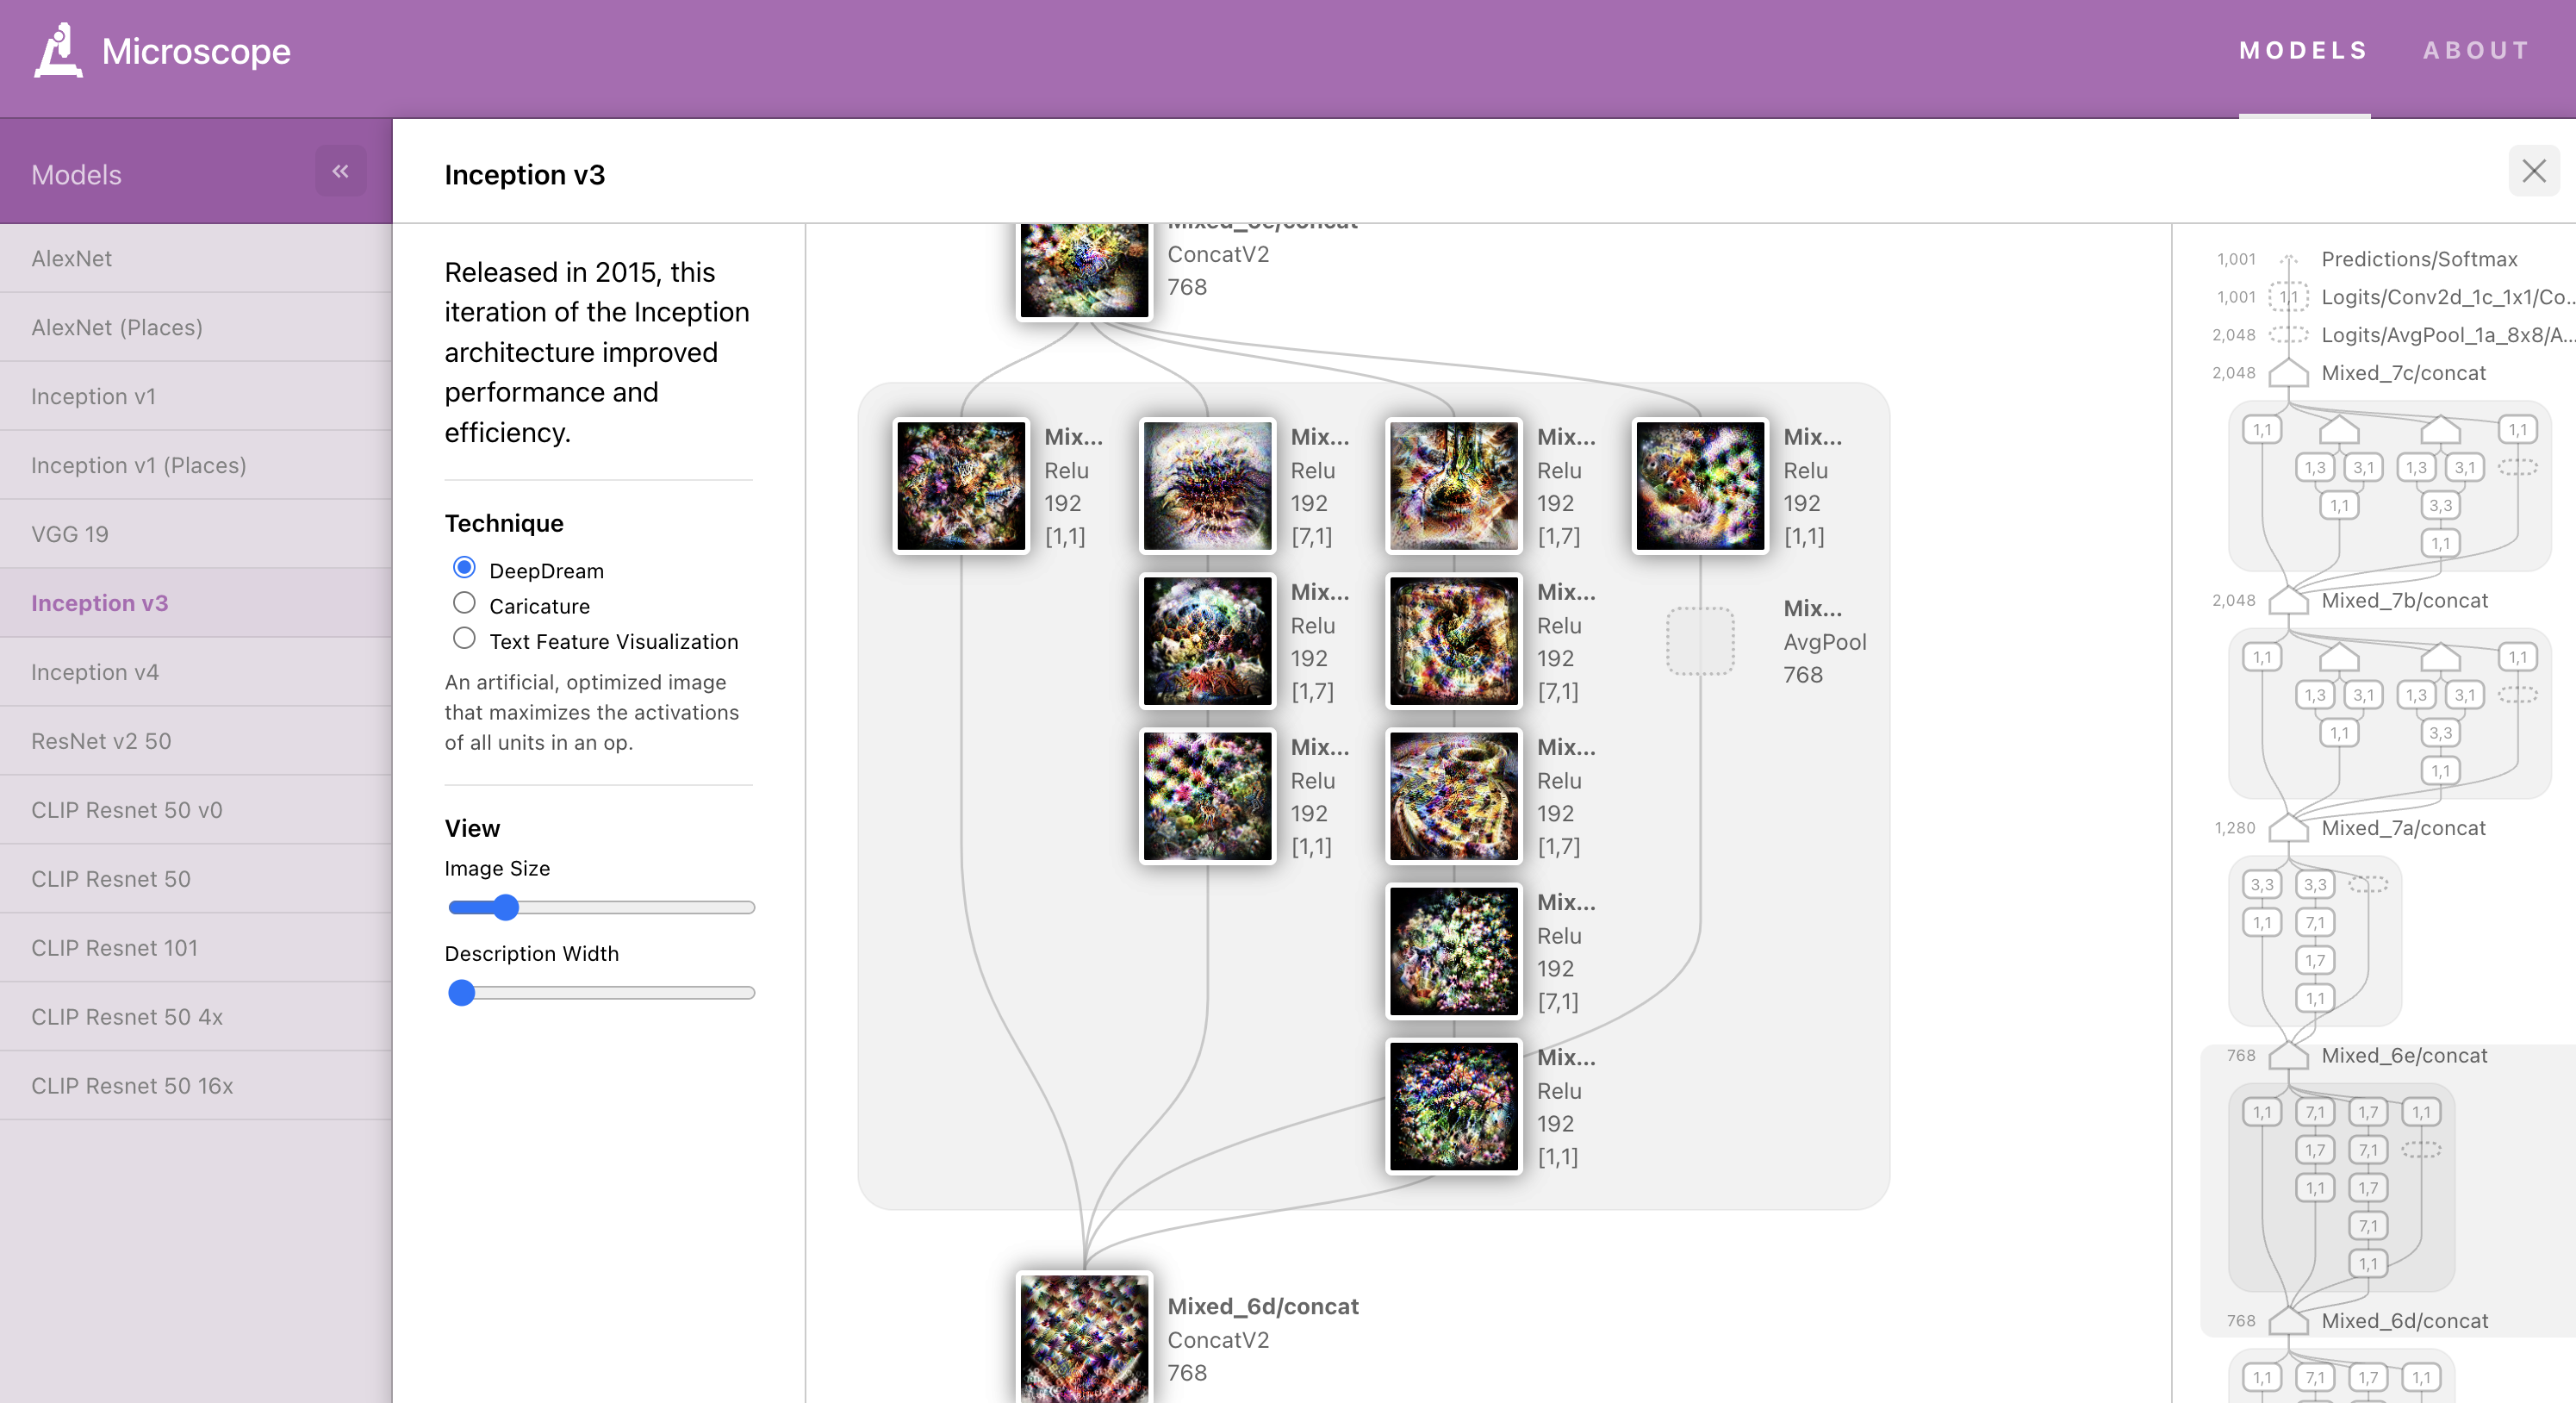
54.4.4 4. OpenAI Microscope
Link: https://microscope.openai.com/models
OpenAI Microscope is a collection of visualizations of every significant layer and neuron of several common “model organisms” which are often studied in interpretability. Microscope makes it easier to analyze the features that form inside these neural networks, and move towards understanding these complicated systems.
54.4.5 5. MLU-Explain
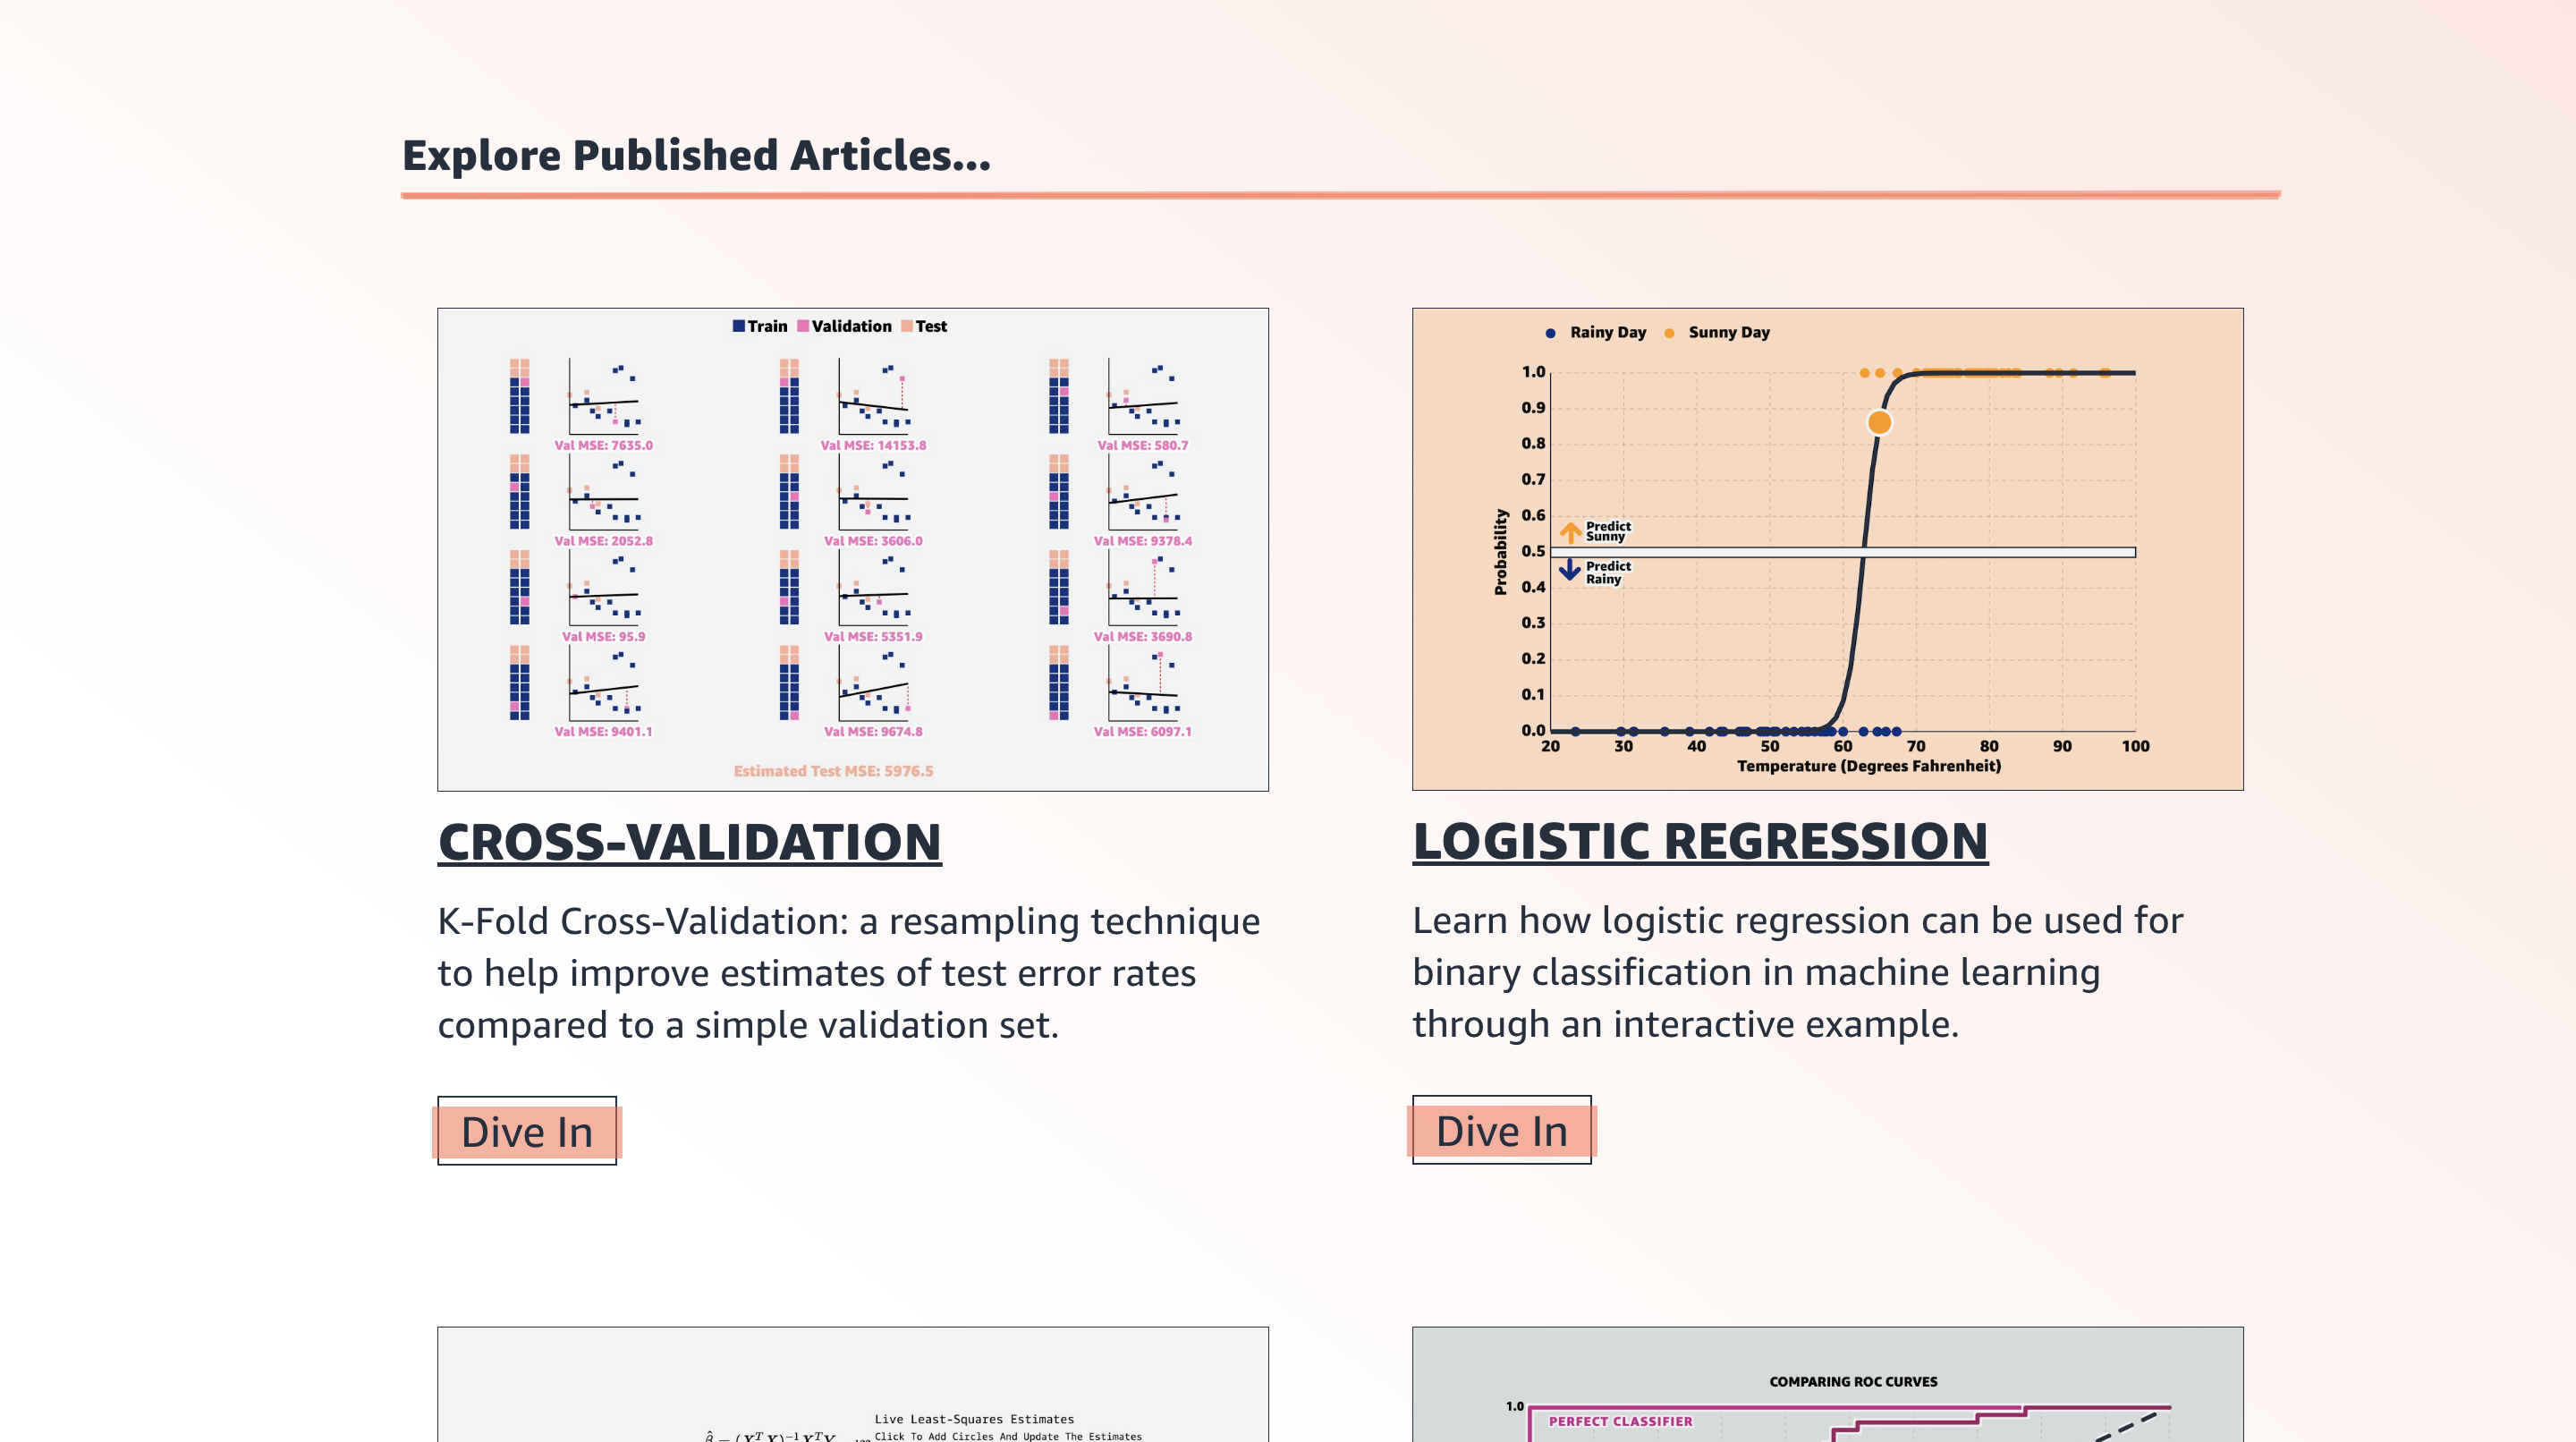
Link: https://mlu-explain.github.io/
MLU-Explain exists to teach important machine learning concepts through visual essays in a fun, informative, and accessible manner.
It includes topics like: Cross-Validation, Linear and Logistic Regression, ROC & AUC, Train, test and validation sets, Precision & Recall, Decision Trees & Random Forests, etc.

54.5 Journals and Publications
54.5.1 1. Distill
Link: https://distill.pub/
Distill is a scientific journal that operated between 2016 and 2021. However, most of the research papers and articles on the website are very engaging and remain highly relevant for Data Scientists. Distill shares Machine Learning Research in interactive and new ways to facilitate learning and thinking.
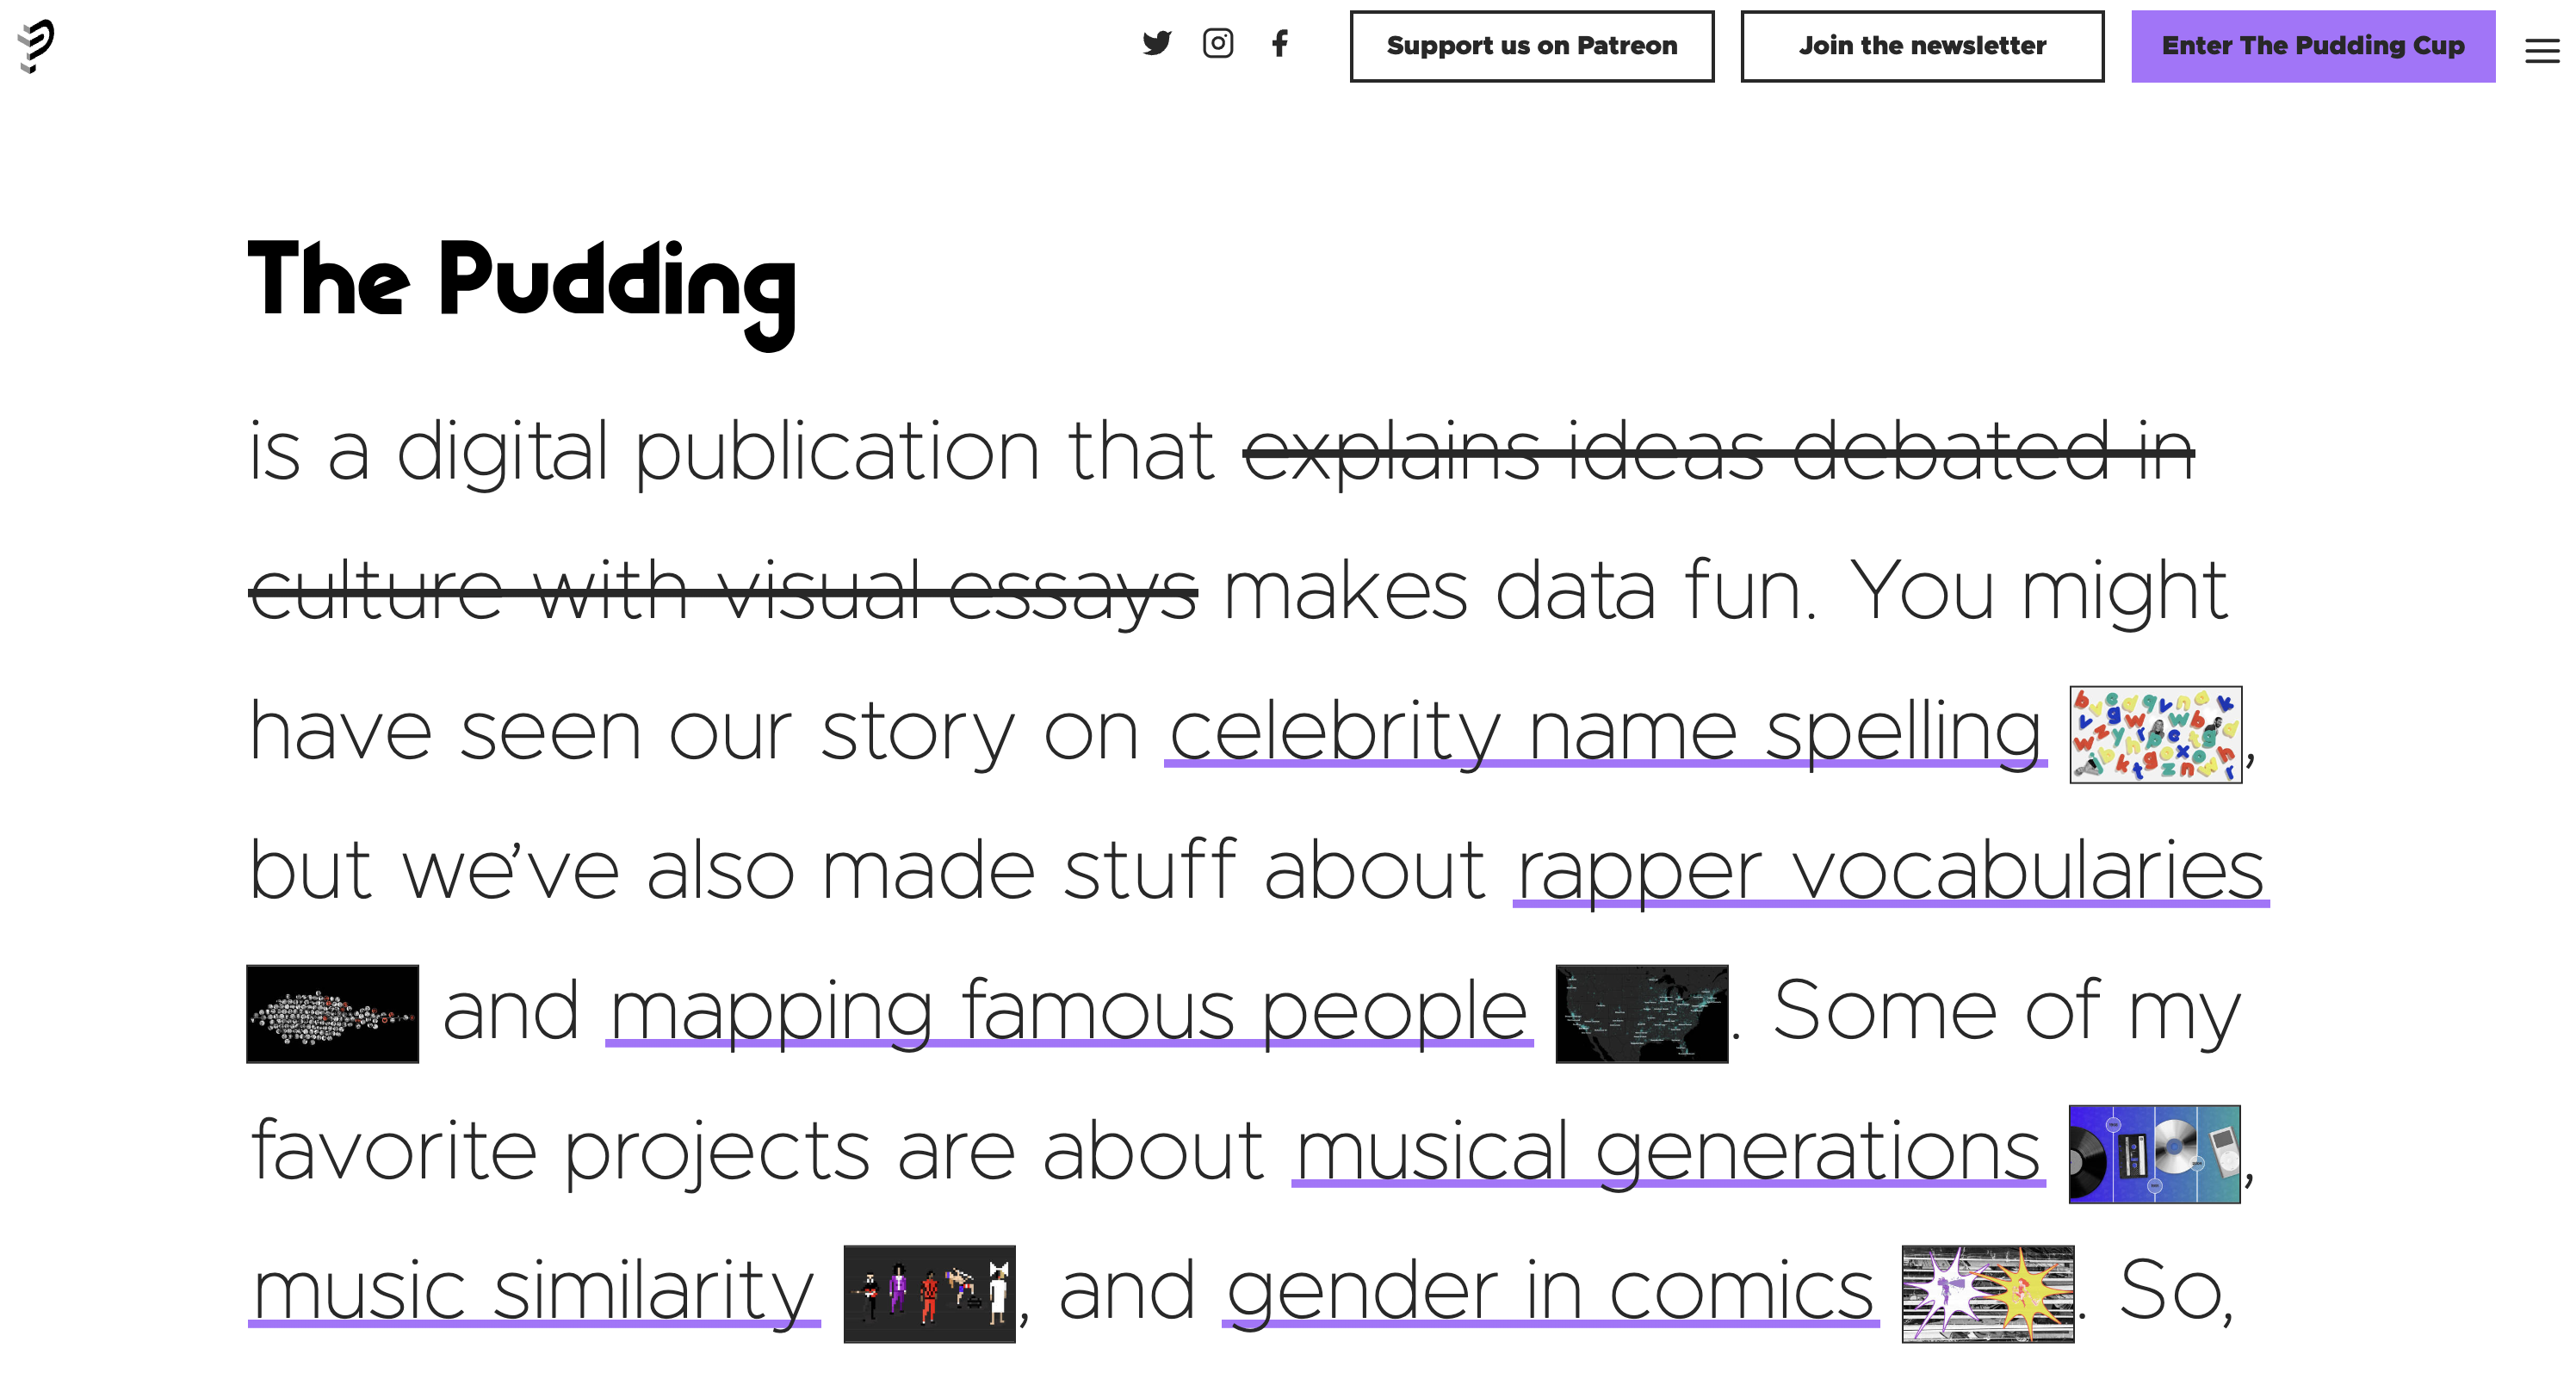
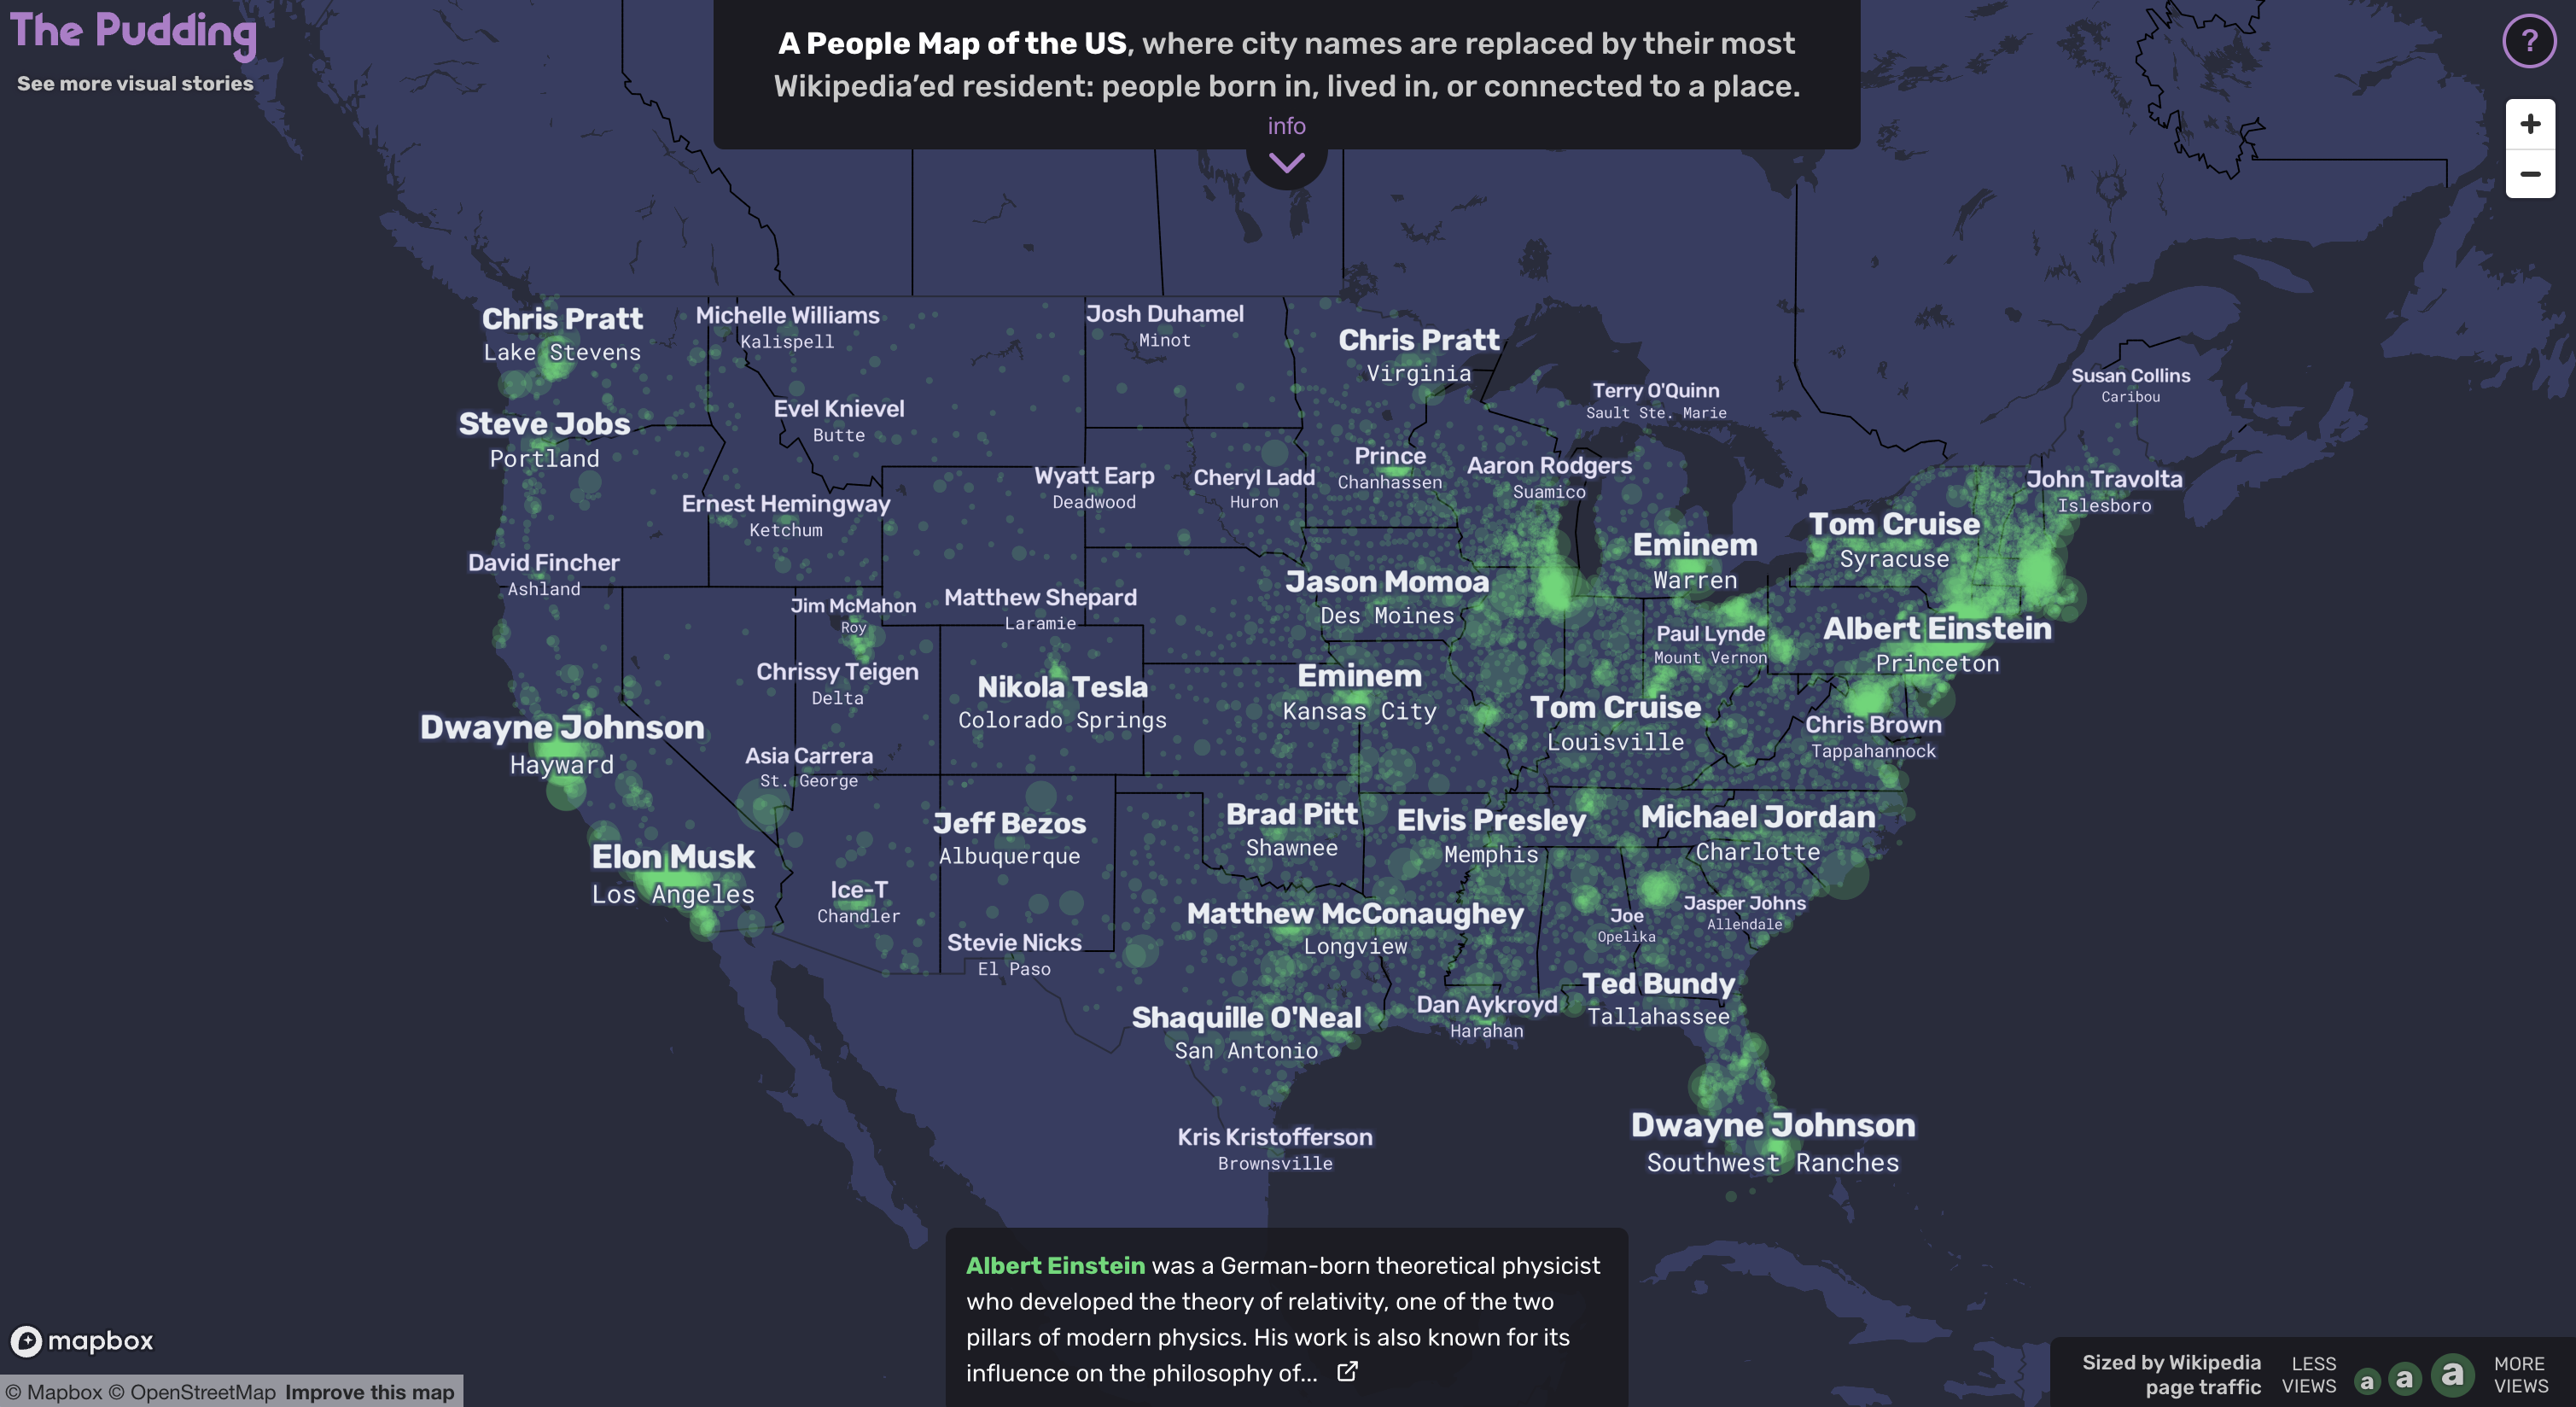
54.5.2 2. The Pudding
Link: https://pudding.cool/
The Pudding is a digital publication with the aim of making data fun through their various visual essay on contemporary topics. While Pudding does not explicitly teach Data Science concepts, it’s a great resource to see the fun ways of visualizing projects.