Chapter 41 Different Ways of Plotting U.S. Map in R
Zhiyi Guo and Fan Wu
41.1 Introduction
When dealing with national data/geographical data, i.e., election results, it is often useful to visualize the data onto a map as it could help draw conclusion geographycally. Hence, in this tutorial, we will explore different packages that could help with mapping geographical data, specifically for the U.S.
41.2 Using usmap package
This is probabily the most convinent package to plot a U.S. map along with some data. usmap provides very helpful functions to select certain regions within the U.S.. Another feature of this package is that it creates a ggplot object and hence we could use all the nice functions that come with ggplot2 package.
Package(s) we need:
#install.packages("usmap")
library(usmap) #import the package
library(ggplot2) #use ggplot2 to add layer for visualization
Plot all states of the U.S. to create an empty map.
plot_usmap(regions = "states") +
  labs(title = "U.S. States",
       subtitle = "This is a blank map of the United States.") +
  theme(panel.background=element_blank())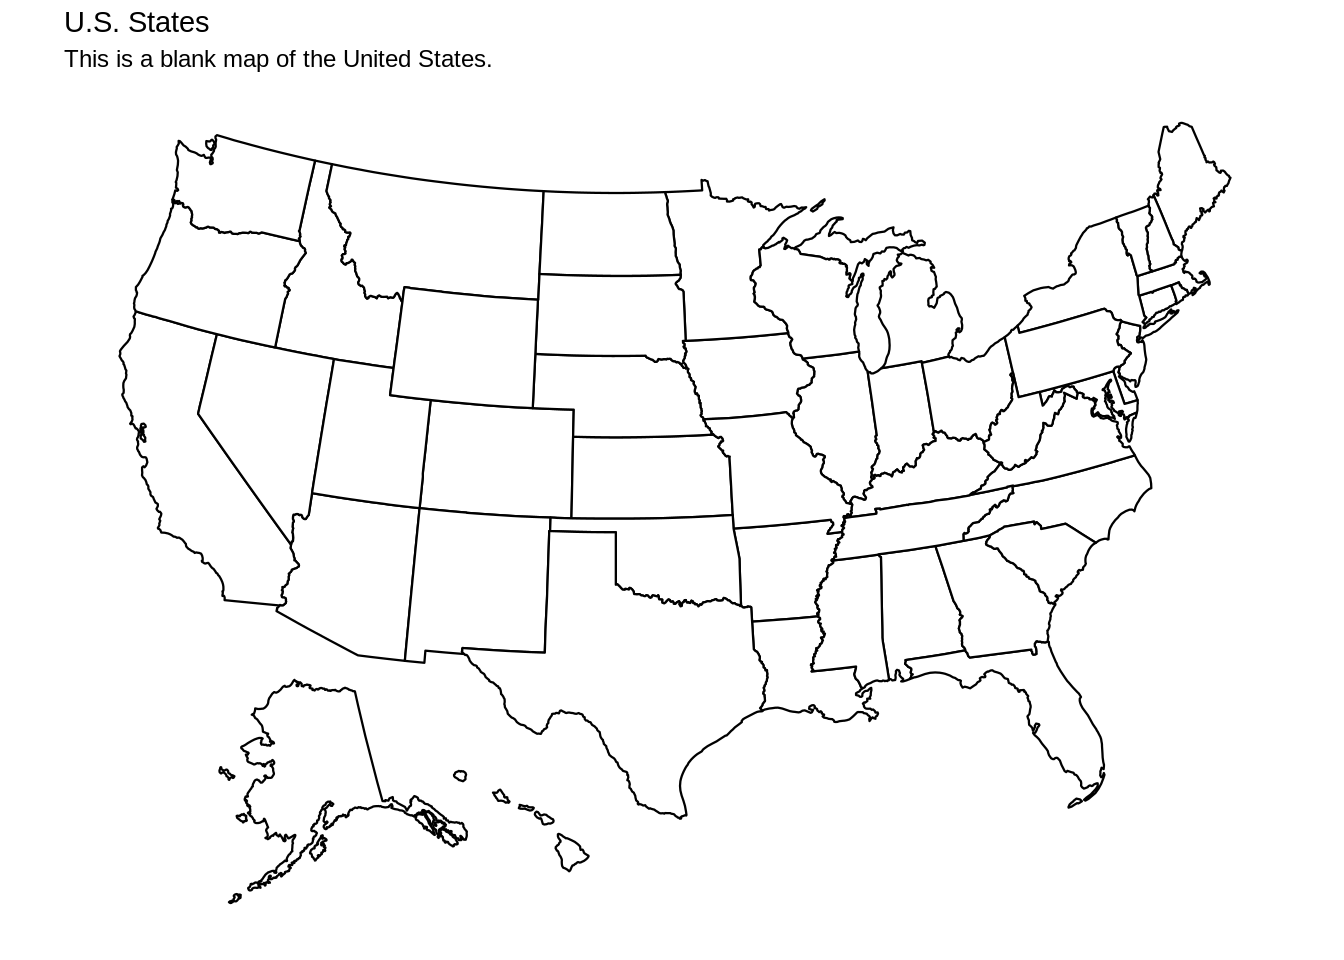
Besides states, we could also plot all counties of the U.S.
plot_usmap(regions = "counties") +
  labs(title = "U.S. counties",
       subtitle = "This is a blank map of the United States.") +
  theme(panel.background=element_blank())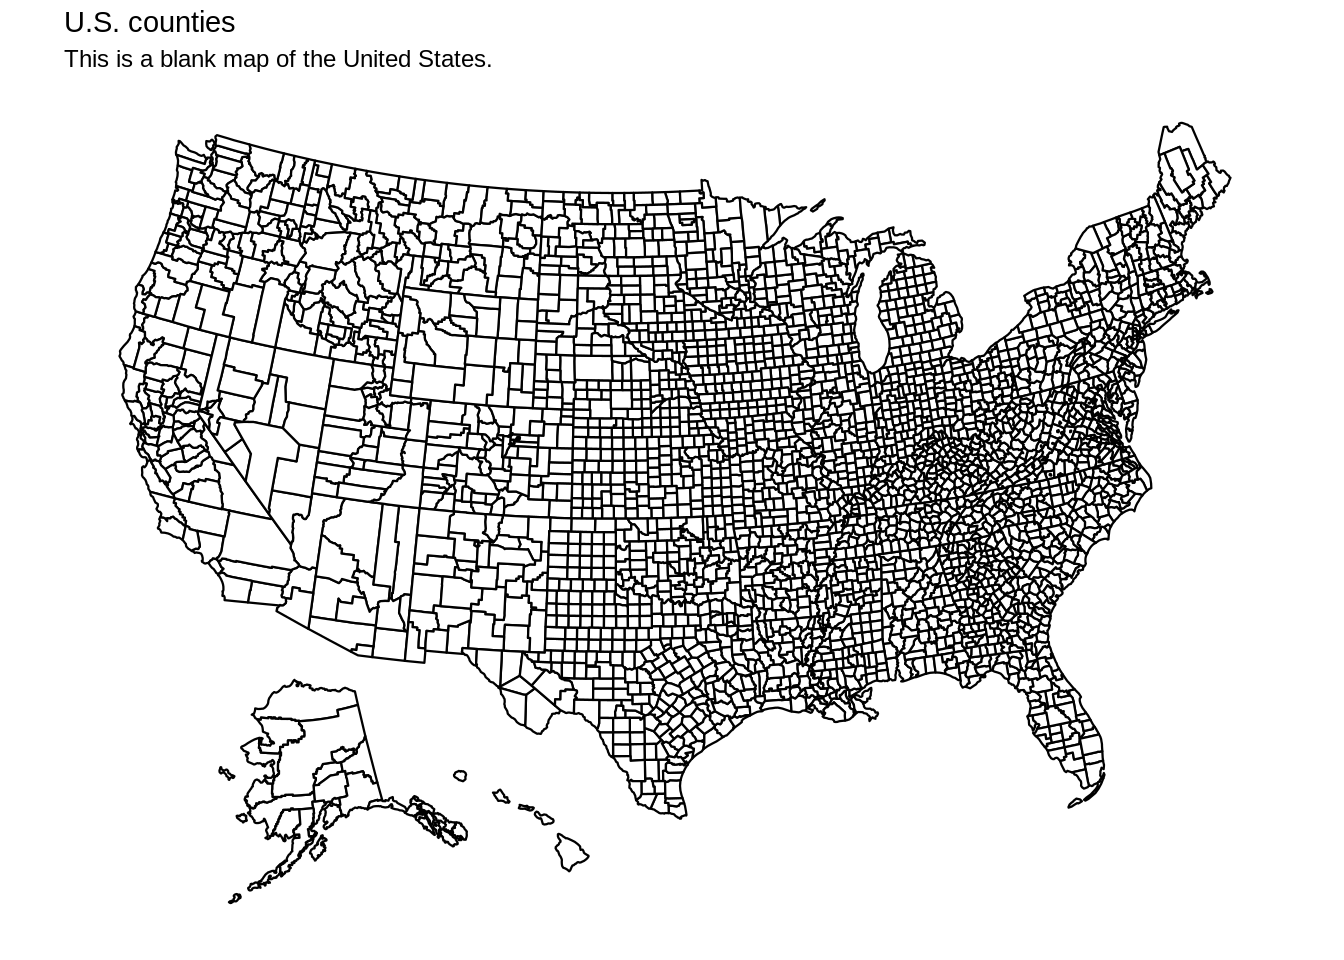
usmap also provides many different regions to select, for example, the South region. The “include” and “exclude” functions give us freedom to select/delete regions as we desire, and this works for states and counties.
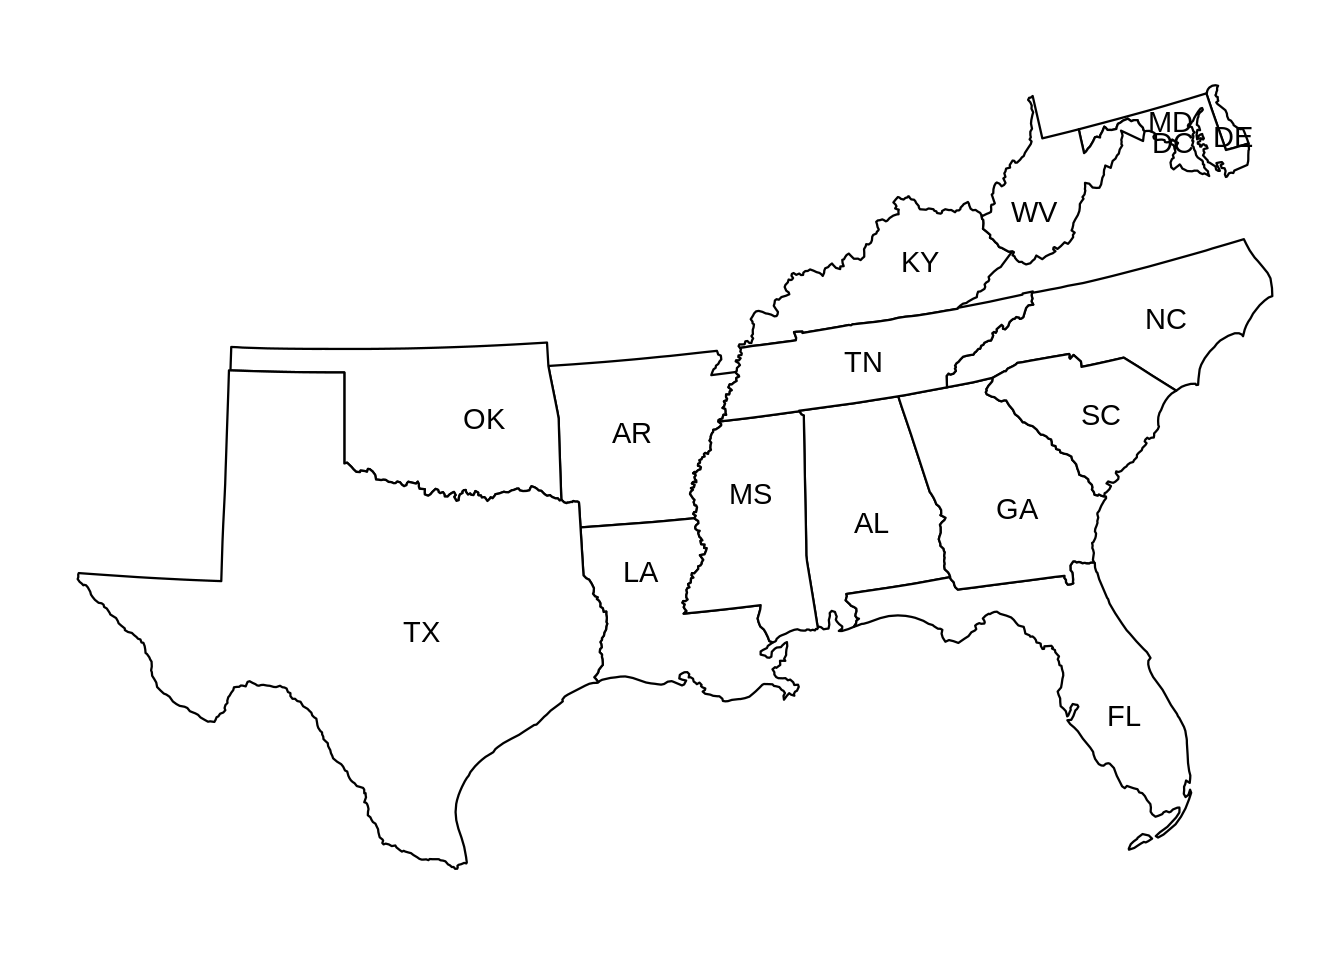
You could also select certain states using factors(state abbreviations).
plot_usmap(include = c("CT", "ME", "MA", "NH", "VT")) +
  labs(title = "New England Region") +
  theme(panel.background = element_rect(color = "blue"))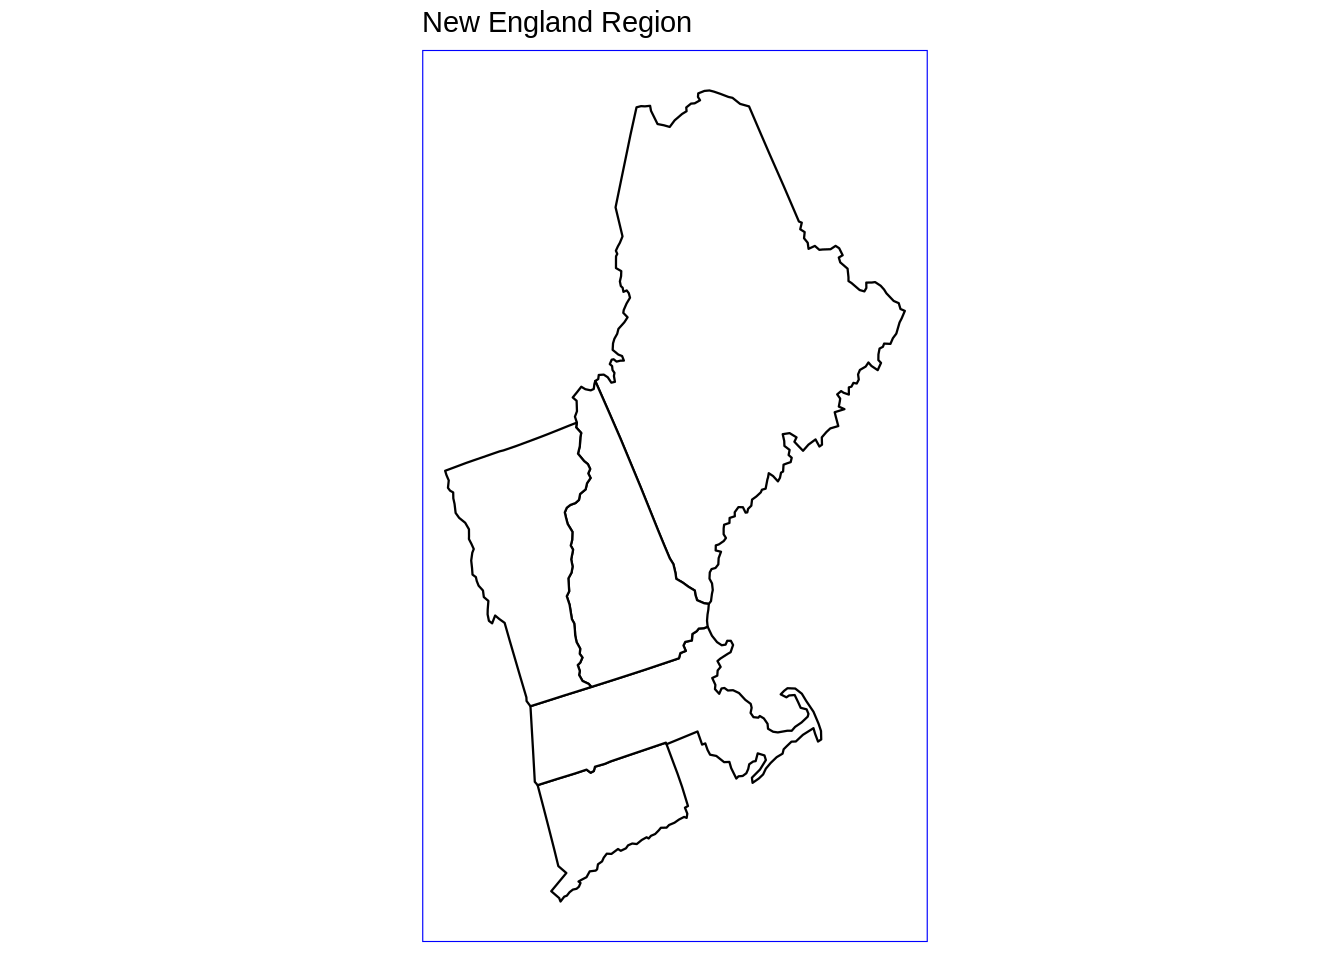
The complete list of regions to choose is the following: .east_north_central: East North Central census division .east_south_central: East South Central census division .midwest_region: Midwest census region .mid_atlantic: Mid-Atlantic census division .mountain: Mountain census division .new_england: New England census division .northeast_region: Northeast census region .north_central_region: North-Central census region .pacific: Pacific census division .south_atlantic: South Atlantic census division .south_region: South census region .west_north_central: West North Central census division .west_region: West census region .west_south_central: West South Central census division usmap really provides users with the choice to mix and match areas of interest, hence makes it very desirable to manipulate the map.
The package comes with geographical/national data sets such as population, poverty, and etc. For example, using countypov data set from the package, we could see the poverty estimates for New England counties in 2014:
plot_usmap(data = countypov, values = "pct_pov_2014", include = c("CT", "ME", "MA", "NH", "VT"), color = "blue") +
  scale_fill_continuous(low = "white", high = "blue", name = "Poverty Percentage Estimates", label = scales::comma) +
  labs(title = "New England Region", subtitle = "Poverty Percentage Estimates for New England Counties in 2014") +
  theme(legend.position = "right")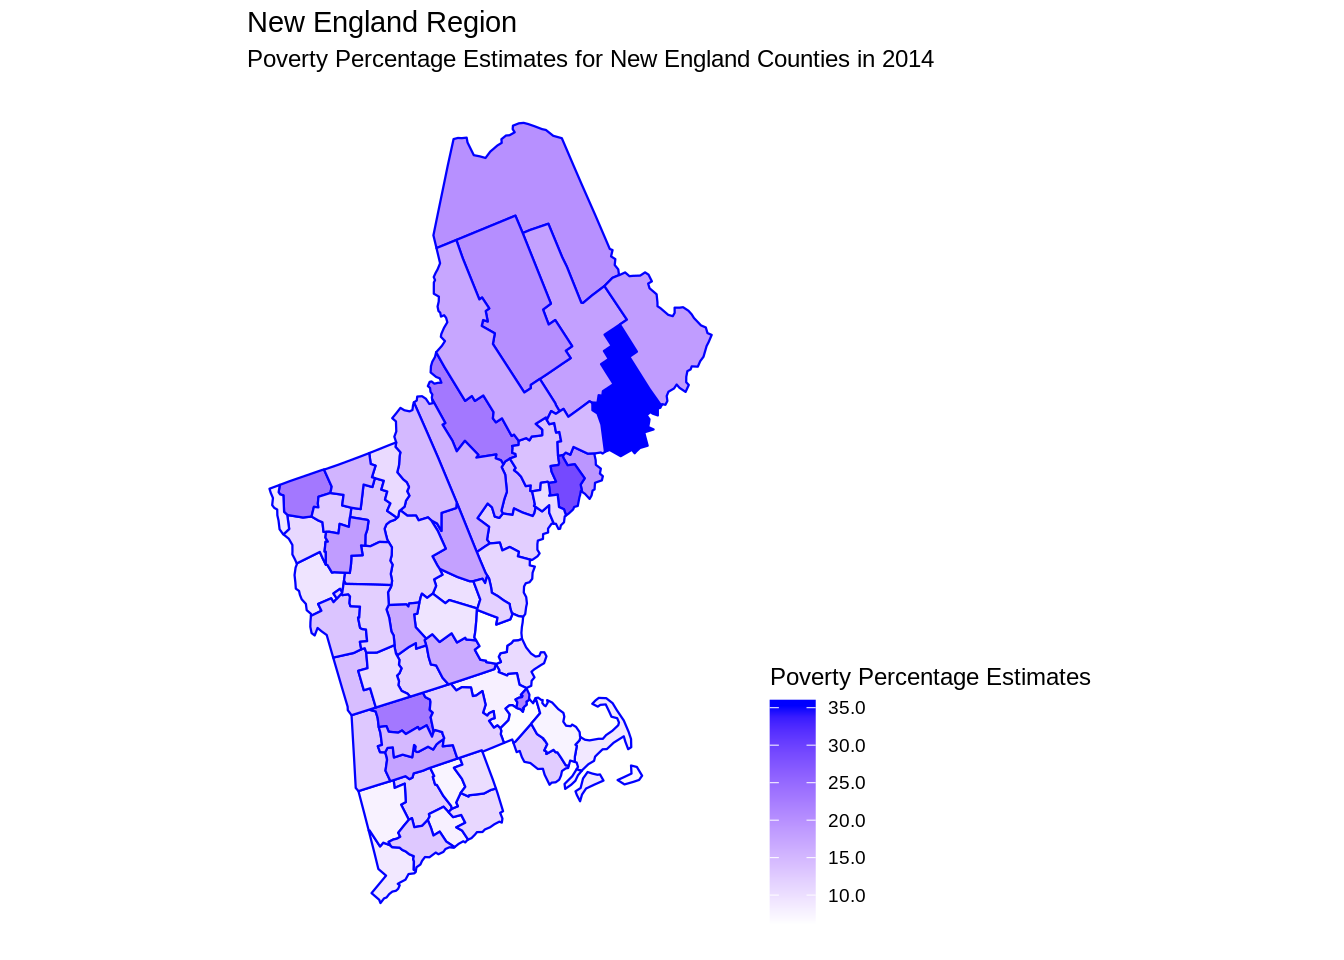
We could also see population of these counties in 2015:
plot_usmap(data = countypop, values = "pop_2015", include = .new_england, color = "red") +
  scale_fill_continuous(low = "white", high = "red", name = "Population", label = scales::comma) +
  labs(title = "New England Region", subtitle = "Population in New England Counties in 2014") +
  theme(legend.position = "right")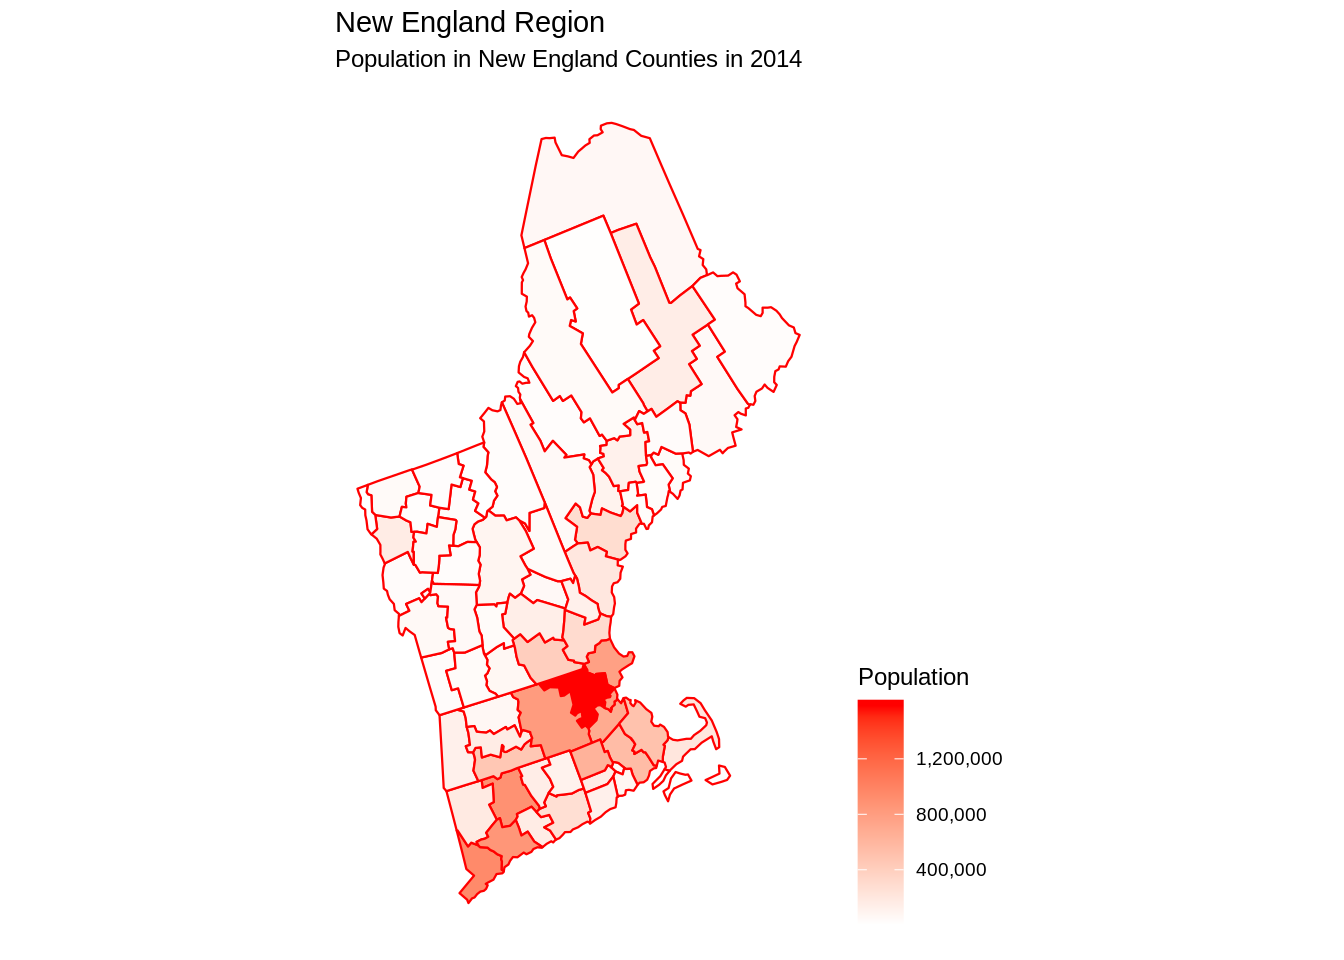
41.3 Using ggplot2 package
(Note: In this part, we only care about continental U.S.)
First, we get U.S. map data. In R, there are packages named maps and mapdata which save a lot of map information, for instance, continents, countries and states. We can use their data directly by using map_data function in ggplot2 package.
Package(s) we need:
Next, we use geom_ploygon function to plot U.S. map.
ggplot(data=usa, aes(x=long, y=lat, group=group)) +
  geom_polygon(fill='lightblue') +
  theme(axis.title.x=element_blank(), axis.text.x=element_blank(), axis.ticks.x=element_blank(),
        axis.title.y=element_blank(), axis.text.y=element_blank(), axis.ticks.y=element_blank()) +
  ggtitle('U.S. Map') +
  coord_fixed(1.3)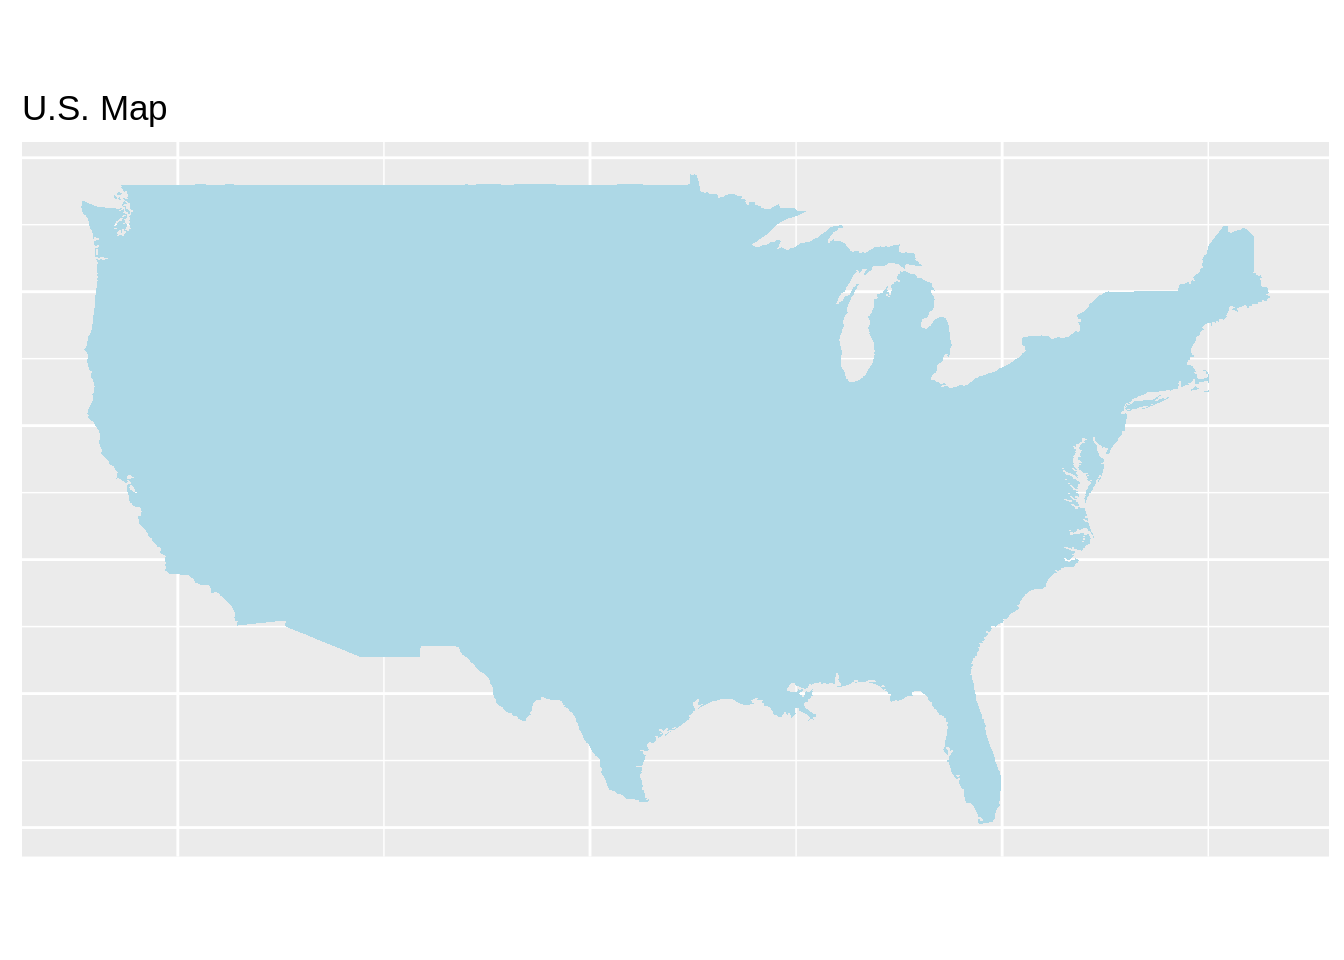
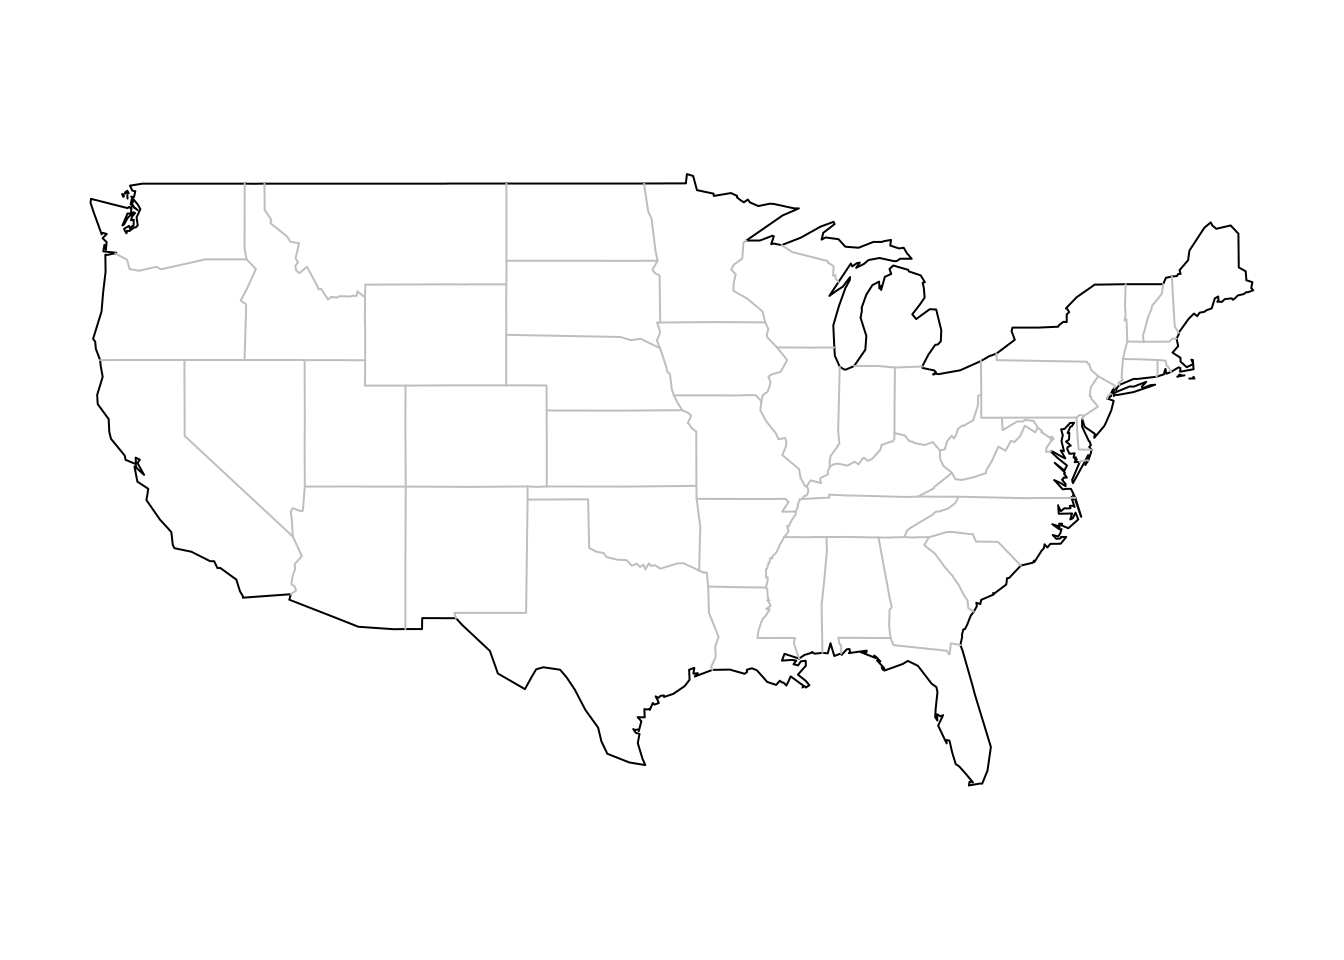
In order to get more information about U.S., now we can add state data to the map. Like above, we obtain data from maps and mapdata packages, and use ggplot2 to plot.
ggplot(data=state, aes(x=long, y=lat, fill=region, group=group)) +
  geom_polygon(color = "white") +
  guides(fill=FALSE) +
  theme(axis.title.x=element_blank(), axis.text.x=element_blank(), axis.ticks.x=element_blank(),
        axis.title.y=element_blank(), axis.text.y=element_blank(), axis.ticks.y=element_blank()) +
  ggtitle('U.S. Map with States') +
  coord_fixed(1.3)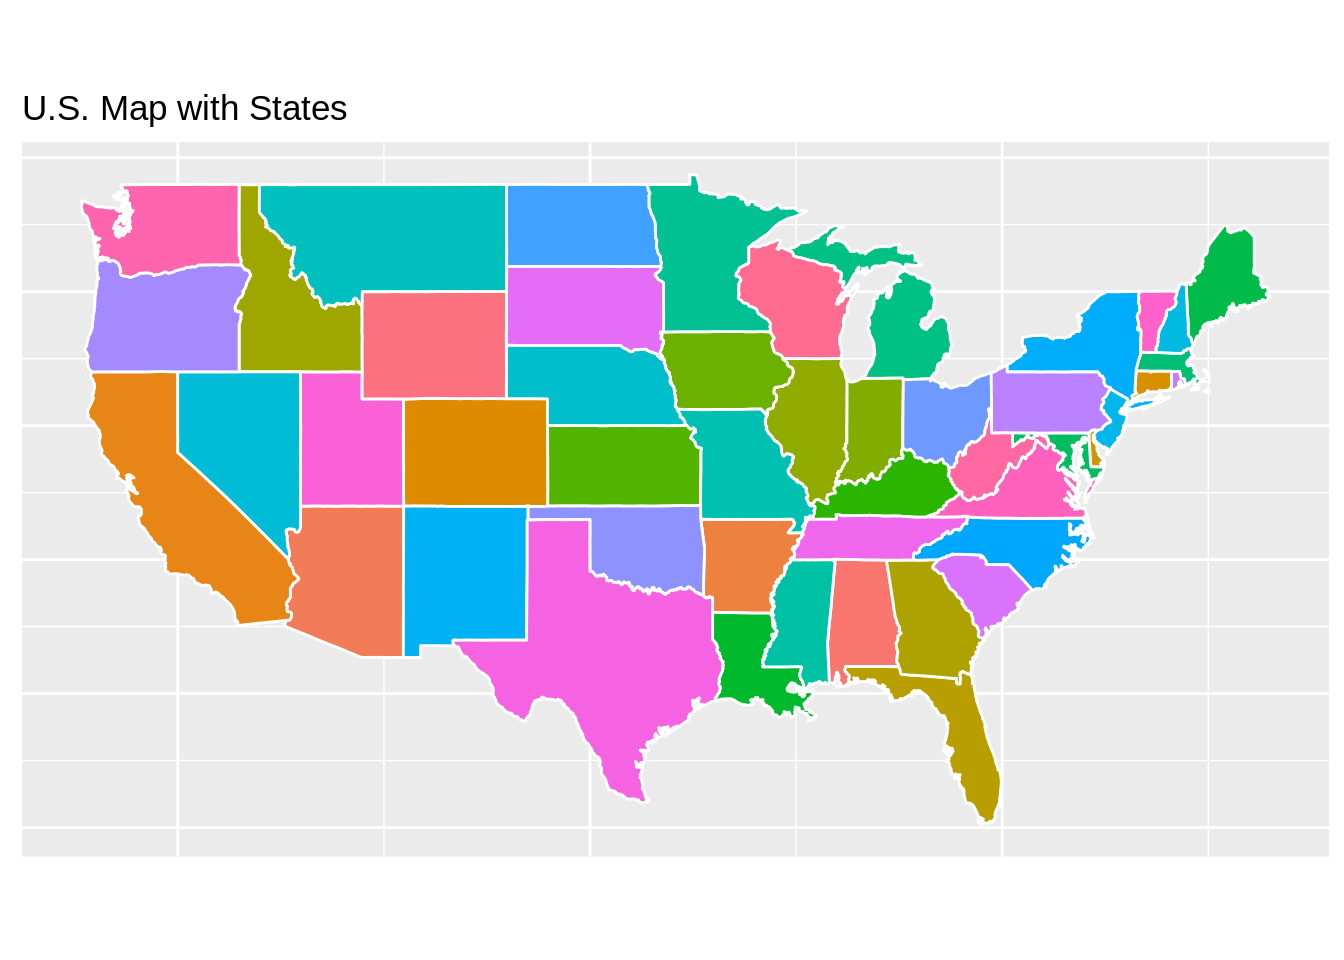
What if we only care about one state? Definitely, we can draw one state map using ggplot2. Firstly we need to filter data.
washington <- subset(state, region=="washington")
counties <- map_data("county")
washington_county <- subset(counties, region=="washington")

ca_map <- ggplot(data=washington, mapping=aes(x=long, y=lat, group=group)) +
  coord_fixed(1.3) +
  geom_polygon(color="black", fill="gray") +
  geom_polygon(data=washington_county, fill=NA, color="white") +
  geom_polygon(color="black", fill=NA) +
  ggtitle('Washington Map with Counties') +
  theme(axis.title.x=element_blank(), axis.text.x=element_blank(), axis.ticks.x=element_blank(),
        axis.title.y=element_blank(), axis.text.y=element_blank(), axis.ticks.y=element_blank())
ca_map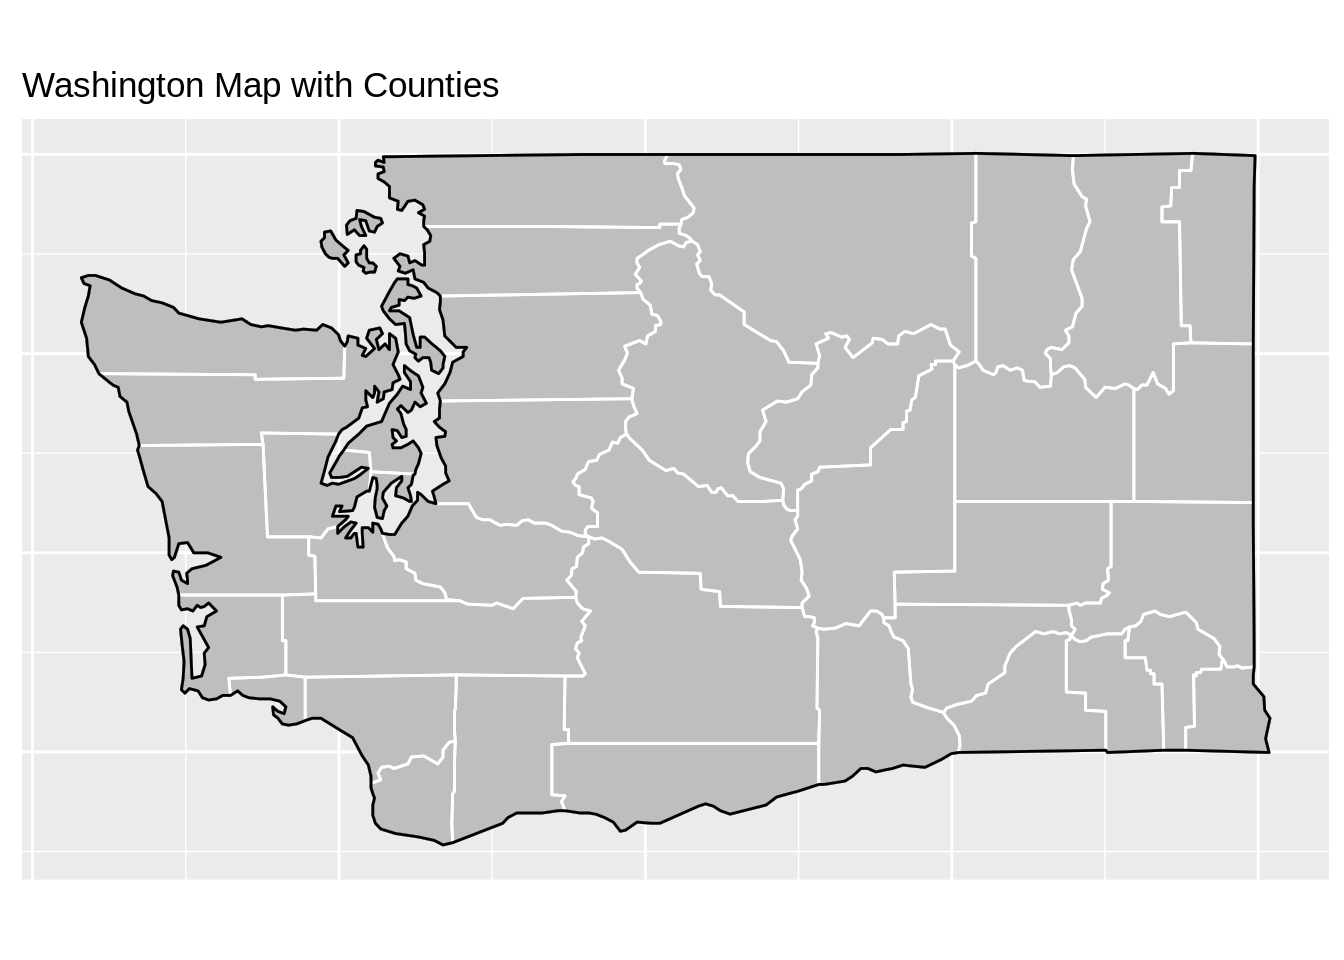
41.4 Using maps package
(Note: In this part, we only care about continental U.S.)
We also can directly plot using maps package. However, with only maps package, we are limited by mapping techniques. Thus, we recommend using other packages instead.
Package(s) we need:
41.5 Using plotly package
We first need to import data from US-State-Boundaries-Census-2014.shp, and then use plotly package. Suppose we care about water level for each state in U.S.
Package(s) we need:
41.6 Using mapview package
We use the same dataset from last method. It gives us an interactive map with all information.
Package(s) we need:
41.7 Using leaflet package
We use the same dataset from last method. We construct a interactive map with no specific information. If you are interested in a specific area, for example, water level, you can add specific choropleth to show more information.
Package(s) we need:
41.8 Using tmap package
tmap is a very powerful map-drawing package that could create various types of maps. In our tutorial, we will focus on how to create an interactive U.S. map using tmap package.
Package(s) we need:
#devtools::install_github('walkerke/tigris')
#install.packages("tmaptools")
#install.packages("tmap")
library(tigris) #download shp file from U.S. census website
library(tmaptools)
library(tmap)
Using tmap requires a shapefile format file that contains vector data of locations, shape and attributes of geographic features. Thus, before we could use the package, we have to import the “shapes” of the map first. We will use the shapefile of the U.S. states defined by the U.S. government, downloaded from U.S. census website. We will then read in the shp file to create a spatial object with U.S. states.
download.file("http://www2.census.gov/geo/tiger/GENZ2015/shp/cb_2015_us_state_20m.zip", destfile = "states.zip")
unzip("states.zip")
us_geo<-read_shape("cb_2015_us_state_20m.shp", as.sf = TRUE, stringsAsFactors = FALSE)
Using the 2015 state population data set from usmap package, we could then draw a interactive map using tmap package.