Chapter 69 Heatmaps
Ji In Choi and Jung Ah Shin
Source: https://edav.info/heatmap.html
69.0.1 R Markdown
69.0.2 개요
이번 단원은 히트맵을 만드는 과정을 다룬다.
69.0.3 tl;dr
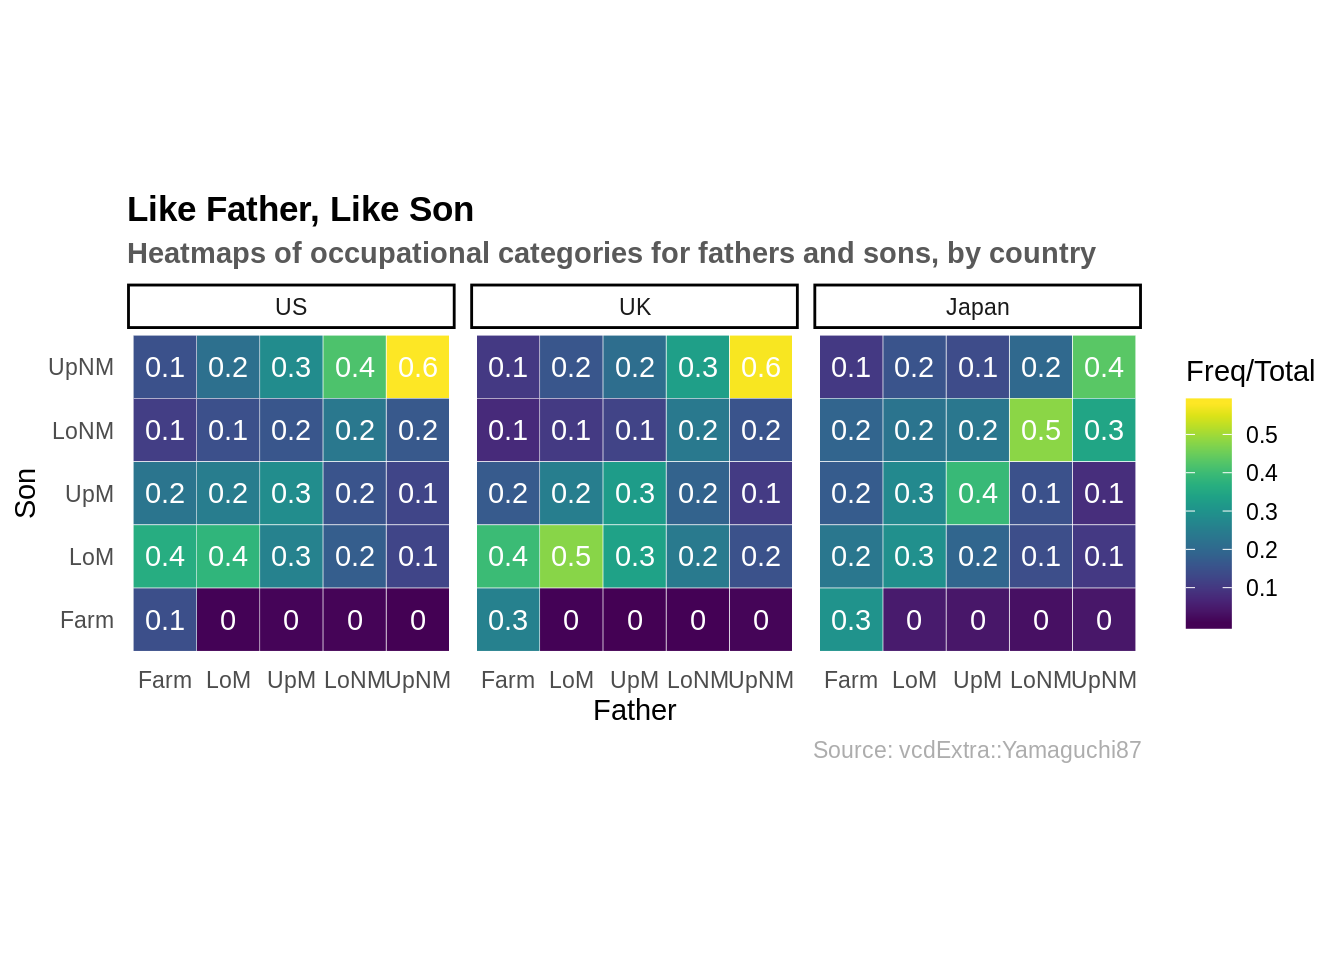
다음은 미국, 영국 및 일본에 있는 아버지와 아들의 직업에 대한 히트맵이다.
아래의 코드를 참고하면 된다.
library(vcdExtra) # dataset
library(dplyr) # manipulation
library(ggplot2) # plotting
library(viridis) # color palette

## format data
orderedclasses <- c("Farm", "LoM", "UpM", "LoNM", "UpNM")
mydata <- Yamaguchi87
mydata$Son <- factor(mydata$Son, levels = orderedclasses)
mydata$Father <- factor(mydata$Father,
                        levels = orderedclasses)
japan <- mydata %>% filter(Country == "Japan")
uk <- mydata %>% filter(Country == "UK")
us <- mydata %>% filter(Country == "US")

### convert to % of country and class total
mydata_new <- mydata %>% group_by(Country, Father) %>%
  mutate(Total = sum(Freq)) %>% ungroup()

### make custom theme
theme_heat <- theme_classic() +
  theme(axis.line = element_blank(),
        axis.ticks = element_blank())

### basic plot
plot <- ggplot(mydata_new, aes(x = Father, y = Son)) +
  geom_tile(aes(fill = Freq/Total), color = "white") +
  coord_fixed() + facet_wrap(~Country) + theme_heat

### plot with text overlay and viridis color palette
plot + geom_text(aes(label = round(Freq/Total, 1)),
                 color = "white") +
      scale_fill_viridis() +
      ## formatting
      ggtitle("Like Father, Like Son",
              subtitle = "Heatmaps of occupational categories for fathers and sons, by country") +
      labs(caption = "Source: vcdExtra::Yamaguchi87") +
      theme(plot.title = element_text(face = "bold")) +
      theme(plot.subtitle = element_text(face = "bold", color = "grey35")) +
      theme(plot.caption = element_text(color = "grey68"))
이 데이터에 대해 더 자세한 정보를 얻으려면 콘솔(console)에 ?vcdExtra::Yamaguchi87 을 입력하면 된다.
69.0.4 간단한 예제들
69.0.5 2-차원 빈 카운트를 사용한 히트 맵
이 히트 맵에는 SpeedSki 데이터 셋을 사용할 것이다.
2-차원 빈 카운트 히트 맵은 2 개의 변수 x와 y 만 필요로 한다. 세 번째 변수, 즉 색상은 해당 영역의 빈 포인트 수를 나타낸다. 이 히트맵을 2 차원 히스토그램으로 생각하면 된다.
히트 맵을 만들려면 geom_point () 대신 geom_bin2d ()을 사용한다.
library(ggplot2) # plotting
library(GDAdata) # data (SpeedSki)

ggplot(SpeedSki, aes(Year, Speed)) +
  geom_bin2d()
69.0.6 데이터 프레임의 히트 맵
데이터 프레임을 시각적으로 이해하려면 히트 맵을 사용할 수 있다. 열의 크기를 조정하여 공통적인 척도로 데이터를 파악할 수도 있다. 이 예시에서는 geom_tile을 사용하여 데이터 프레임의 모든 셀을 그래프로 표시하고 값으로 색상을 지정한다.
library(pgmm) # data
library(tidyverse) # processing/graphing
library(viridis) # color palette

data(wine)

### convert to column, value
wine_new <- wine %>%
  rownames_to_column() %>%
  gather(colname, value, -rowname)

ggplot(wine_new, aes(x = rowname, y = colname, fill = value)) +
  geom_tile() + scale_fill_viridis() +
  ggtitle("Italian Wine Dataframe")
### 다른 스케일링을 사용한 히트맵
wine_scaled <- data.frame(scale(wine)) %>%
  rownames_to_column() %>%
  gather(colname, value, -rowname)

ggplot(wine_scaled, aes(x = rowname, y = colname, fill = value)) +
  geom_tile() + scale_fill_viridis() +
  ggtitle("Italian Wine Dataframe, Scaled")
69.0.7 수정
ggplot 함수 호출 체인에서 색상 팔레트를 지정하여 색상 팔레트를 변경할 수 있다. bin 너비는 geom_bin2d () 함수 내부에 추가 할 수 있다. library(viridis) # viridis color palette
library(viridis) # viridis color palette
library(GDAdata) # data (SpeedSki)
### create plot
g1 <- ggplot(SpeedSki, aes(Year, Speed)) +
  scale_fill_viridis() # 색상 변경

### show plot
g1 + geom_bin2d(binwidth = c(5, 5)) # bin 너비 변
또 다른 예는 다음과 같다.


### 육각형 빈과 산포도를 사용한 히트맵
g1 + geom_hex(binwidth = c(5, 5), alpha = .4) +
  geom_point(size = 2, alpha = 0.8)
### 사용자 정의를 사용한 커스텀 색상 그라디언트와 빈 카운트를 가진 육각형 빈

ggplot(SpeedSki, aes(Year, Speed)) +
  scale_fill_gradient(low = "#cccccc", high = "#09005F") + # color
  geom_hex(bins = 10) # number of bins horizontally/vertically
69.0.8 이론
히트맵은 산점도 (Scatterplot) 와 히스토그램의 조합과 유사하다.상대 분포를 보는 동시에 여러 모수를 비교할 수 있기 때문이다. - 히트맵이 시각적으로 눈에 띄지만 정보 전달에는 다른 종류의 그래프들이 훨씬 더 효과적일 수 있다. 더 자세한 내용은 아래 링크를 참고하면 된다. https://campus.datacamp.com/courses/data-visualization-with-ggplot2-2/chapter-4-best-practices?ex=10
69.0.9 추가 자료
- https://www.r-graph-gallery.com/heatmap/ : heatmap() 함수를 사용해서 히트맵을 만든 예시들이 있다.
- https://www.r-bloggers.com/how-to-make-a-simple-heatmap-in-ggplot2/ : Geom_title() 을 사용해서 히트맵을 만드는 방법.