Chapter 56 Ice Cream Survey
Jake Stamell
56.1 Overview
56.1.1 Description
For my community contribution, I sent out a short (4 question) survey to the class on their ice cream preferences. I asked age, country of origin, cup or cone, and favorite flavor. Country and flavor were open text responses, which I hoped would cause some variation in input requiring cleaning (misspellings, alternative flavor names, etc.).
56.1.2 Goals of this community contribution
- Share the ice cream preferences of our class!
- Demonstrate how to clean messy text responses in order to ease analysis and visualization
- Provide an example of visualizing multiple categorical variables
56.2 Loading packages and reading in data
library(googlesheets) # For accessing the responses
library(tidyverse) # For data cleaning and visualizing
library(data.table) # Alternative to dplyr
library(countrycode) # For handling country names
library(gridExtra) # For visualizations
# This key should allow anyone to access the raw results
ice_cream_key <- "18uYxylZazzedLVzo4hSLEemQNKZ0uNse_V2aVyARvj8"
ice_cream <- gs_key(ice_cream_key)
ice_cream_responses <- ice_cream %>% gs_read(ws="Form Responses 1")
setDT(ice_cream_responses) # using data.table instead of dplyr
names(ice_cream_responses) <- c("Timestamp","Age","Country","Method","Flavor")56.3 Understanding what cleaning is required
For country, respondents were allowed to input whatever they wanted. This caused issues with USA and Mexico, where the former was submitted in multiple formats and the latter included the name with and without accents. A bigger issue is the number of countries with only one respondent, indicating that we will need to combine responses in some way.
##           Country N
##  1:         India 9
##  2:         China 9
##  3:           USA 6
##  4:       Belgium 1
##  5:         Korea 1
##  6:        France 1
##  7:      Thailand 1
##  8:         Japan 1
##  9:     Indonesia 1
## 10:        México 1
## 11:    Bangladesh 1
## 12:           Usa 1
## 13:        Mexico 1
## 14: United States 1
For flavor, again respondents could input any text. As expected, this caused many variations on the same flavors and even one misspelling. Even after accounting for this, the same problem remains of having many categories with few responses. The approach I will take for summarizing this will be to group similar flavors (e.g. chocolate chip and chocolate chip cookie dough). I consider myself somewhat of an ice cream expert (making it is a hobby of mine); I will leverage this knowledge in grouping ice cream flavors.
##                          Flavor  N
##  1:                   Chocolate 11
##  2:                     Vanilla  6
##  3:                  Strawberry  2
##  4: Chocolate chip cookie dough  1
##  5:         Mint Chocolate Chip  1
##  6:                     vanilla  1
##  7:                   chocalate  1
##  8:                Black Sesame  1
##  9:              Mint chocolate  1
## 10:           Vanilla macadamia  1
## 11:                Butter pecan  1
## 12:      Vanilla Chocolate Chip  1
## 13:                      matcha  1
## 14:       Strawberry Cheesecake  1
## 15:              Chocolate Chip  1
## 16:                        Mint  1
## 17:                      Coffee  1
## 18:         Chocolate with nuts  1
## 19:              Mint Chocolate  1
Lastly, there are no issues with the data entry for age; however, we need to group it in some way as well.
##     Age  N
##  1:  21  2
##  2:  22 16
##  3:  23  3
##  4:  24  3
##  5:  25  5
##  6:  26  2
##  7:  28  1
##  8:  33  1
##  9:  34  1
## 10:  38  1
56.4 Cleaning and prepping the data
56.4.1 Country
We start by removing the accent in Mexico. Then, we can take care of two issues at once: duplicate country names and too many countries with small number of responses. By leveraging the countrycode package, we can group countries by continent. This leaves a small number of categories, which will ease our visualizations. Unfortunately, I did not have too many European respondents for this survey so I will create a secondary continent variable that groups them with the Americas.
ice_cream_responses[,country_encoding := Encoding(Country)]
ice_cream_responses[country_encoding=="UTF-8", Country := iconv(Country,from="UTF-8",to="ASCII//TRANSLIT")]
ice_cream_responses[,country_encoding := NULL]

ice_cream_responses[,Continent := fct_infreq(countrycode(sourcevar= Country, origin= "country.name", destination= "continent"))]

ice_cream_responses[Continent=="Asia", Continent2 := "Asia"]
ice_cream_responses[Continent!="Asia", Continent2 := "Americas\nand Europe"]
ice_cream_responses[,Continent2 := fct_infreq(Continent2)]

ice_cream_responses[,.N,by=Continent][order(-N)]
## Continent N
## 1: Asia 23
## 2: Americas 10
## 3: Europe 256.4.2 Flavor
For flavor, we start by converting everything to lower case and making sure there is no extra whitespace. The approach for grouping flavors is to use regex to find specific strings and rename the flavors accordingly. Note the order used in “flavors_to_identify”. Some of these will be matched multiple times (e.g. choc and chocolate chip will match chocolate chip cookie dough). Therefore, I have ordered it so that the last match is the one I want to assign and will be the one used. Also, note the use of “choc” to deal with the mispelling of “chocolate” in one response. (This is a little bit of a quick workaround so as to not have to explicitly deal with the issue.) I again create a secondary flavor variable with only 3 categories to compare chocolate-based ice cream against vanilla-based.
ice_cream_responses[,Flavor := str_squish(str_to_lower(Flavor))]

flavors_to_identify <- c('strawberry', 'choc', 'vanilla', 'chocolate chip', 'mint')
flavor_names <- c('Strawberry', 'Chocolate', 'Vanilla', 'Choc chip', 'Mint')
flavor_names2 <- c('Other', 'Chocolate', 'Vanilla', 'Vanilla', 'Other')

for(i in seq(flavors_to_identify)){
  ice_cream_responses[str_which(Flavor, flavors_to_identify[i]),
                      `:=` (Flavor_group=flavor_names[i],
                            Flavor_group2=flavor_names2[i])]
}
ice_cream_responses[is.na(Flavor_group), `:=` (Flavor_group="Other",
                                               Flavor_group2="Other")]
ice_cream_responses[, `:=`(Flavor_group= fct_relevel(fct_infreq(Flavor_group),"Other",after=Inf),
                           Flavor_group2= fct_relevel(fct_infreq(Flavor_group2),"Other",after=Inf))]

ice_cream_responses[,.N,by=Flavor_group][order(-N)]
## Flavor_group N
## 1: Chocolate 13
## 2: Vanilla 8
## 3: Mint 4
## 4: Other 4
## 5: Choc chip 3
## 6: Strawberry 356.4.3 Age
This is quick to clean as we can just split into 2 groups (basically recent grads and those who have some work experience).
56.5 Visualizing the data
56.5.1 Getting an overview
We start with a basic plot to understand the distribution of the transformed variables.
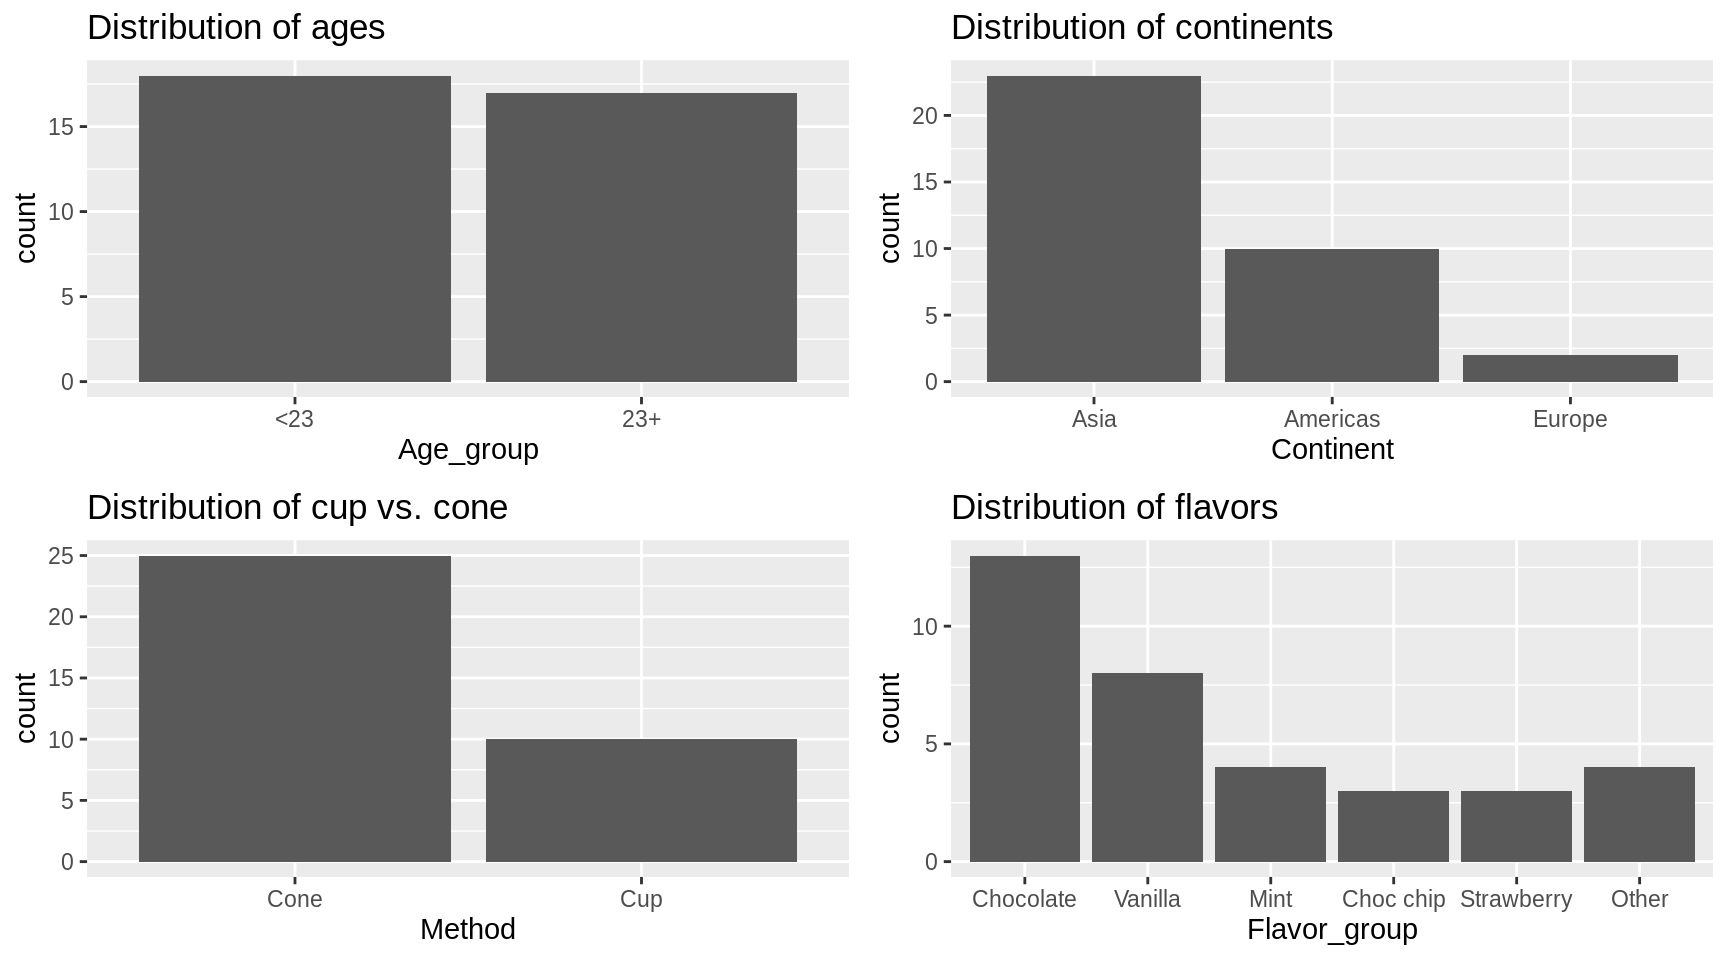
Now using the simplified categories.

56.5.2 Ice cream preferences by continent and age
Unforunately, even with the simplified bucketing of the variables, splitting the data by all 4 variables of interest reduces each category to a very small count.
##     Age_group           Continent2 Method Flavor_group2 N
##  1:       23+ Americas\nand Europe    Cup       Vanilla 3
##  2:       23+                 Asia    Cup         Other 2
##  3:       <23                 Asia    Cup       Vanilla 2
##  4:       <23                 Asia    Cup     Chocolate 2
##  5:       23+                 Asia   Cone         Other 4
##  6:       <23                 Asia   Cone     Chocolate 4
##  7:       23+ Americas\nand Europe   Cone       Vanilla 2
##  8:       <23                 Asia    Cup         Other 1
##  9:       <23 Americas\nand Europe   Cone     Chocolate 2
## 10:       <23                 Asia   Cone       Vanilla 2
## 11:       <23 Americas\nand Europe   Cone         Other 2
## 12:       23+                 Asia   Cone       Vanilla 1
## 13:       <23                 Asia   Cone         Other 2
## 14:       23+                 Asia   Cone     Chocolate 3
## 15:       <23 Americas\nand Europe   Cone       Vanilla 1
## 16:       23+ Americas\nand Europe   Cone     Chocolate 2
Therefore, we will need to compare 2 or 3 variables a at a time to find the interesting patterns.
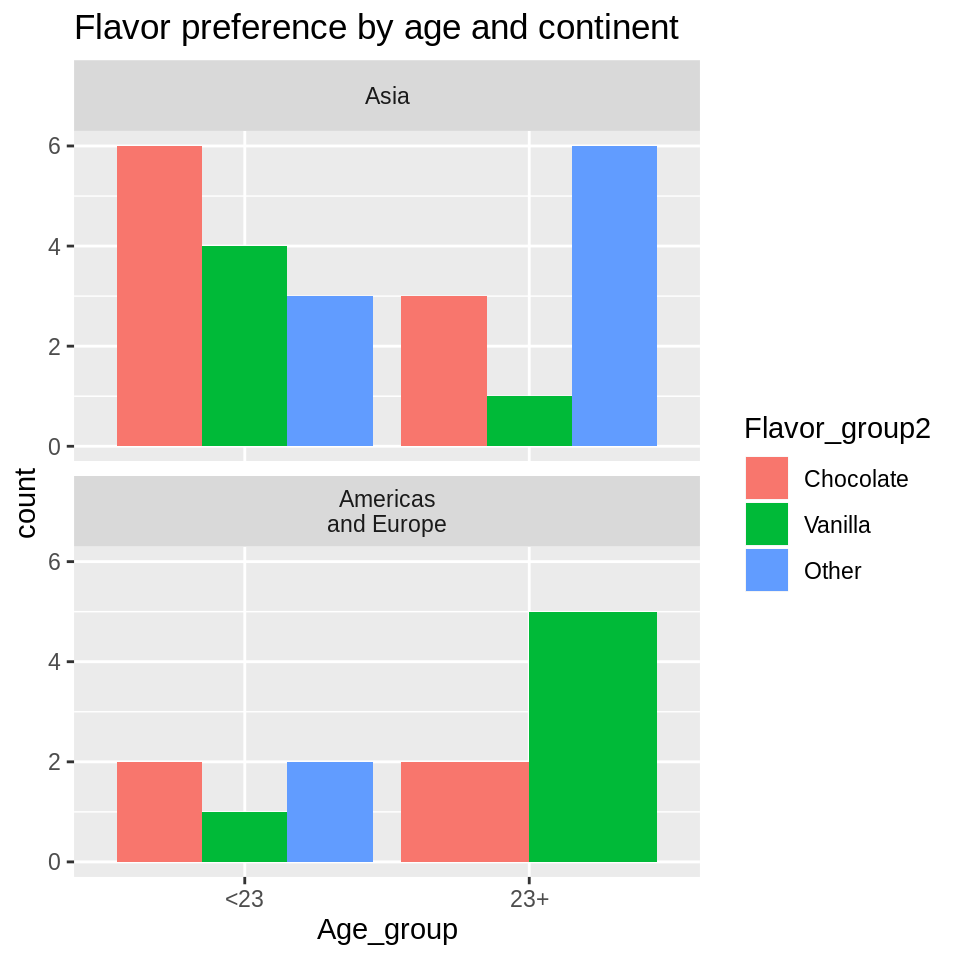
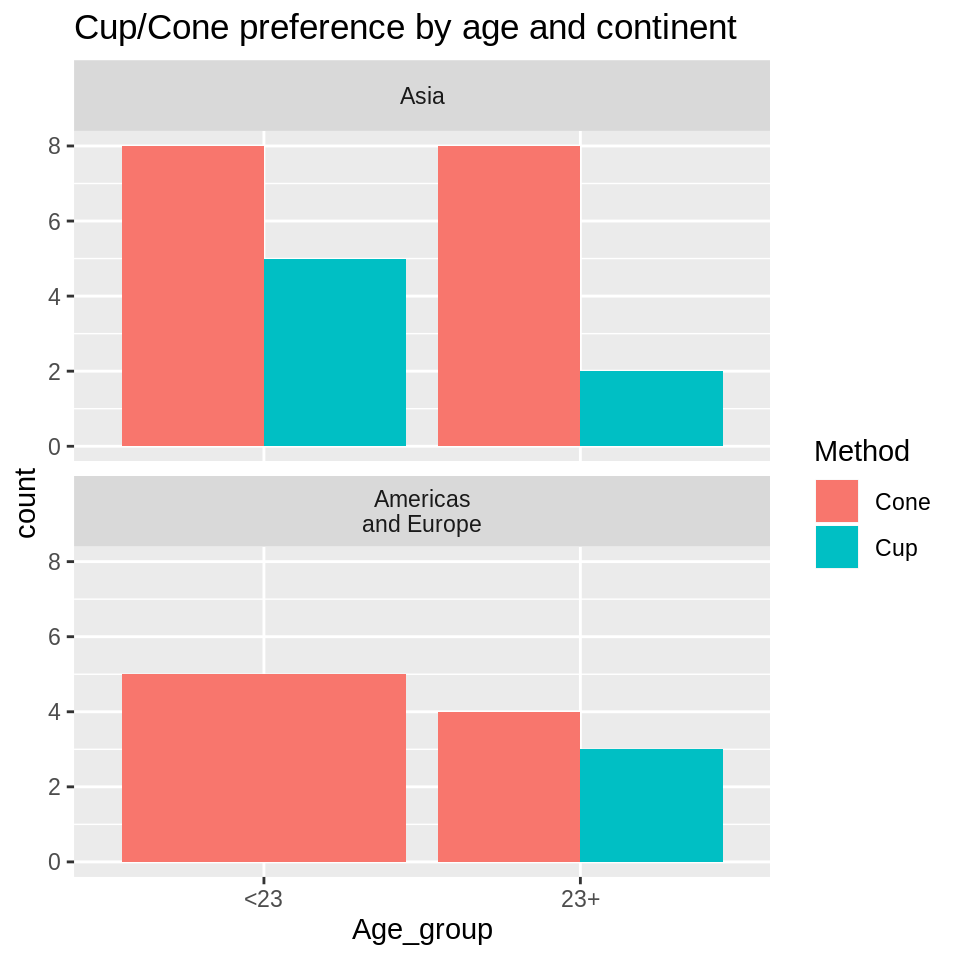
Even breaking down the responses by continent produces buckets that are a little too small for comparison. Still, it looks like respondents from Asia are more likely to favor “Other” flavor than the classics as compared to respondents from Americas/Europe. Additionally, <23/Asia and 23+/Americas,Europe may like cups more than the others. However, maybe there is something else at play?
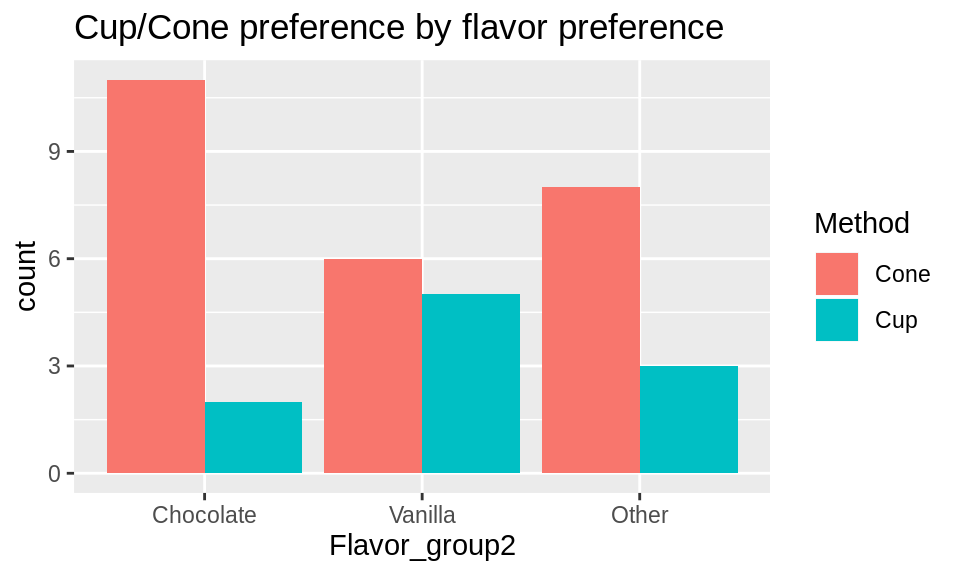
Turns out people who like vanilla are more likely to also prefer a cup! Let’s dig in to age now
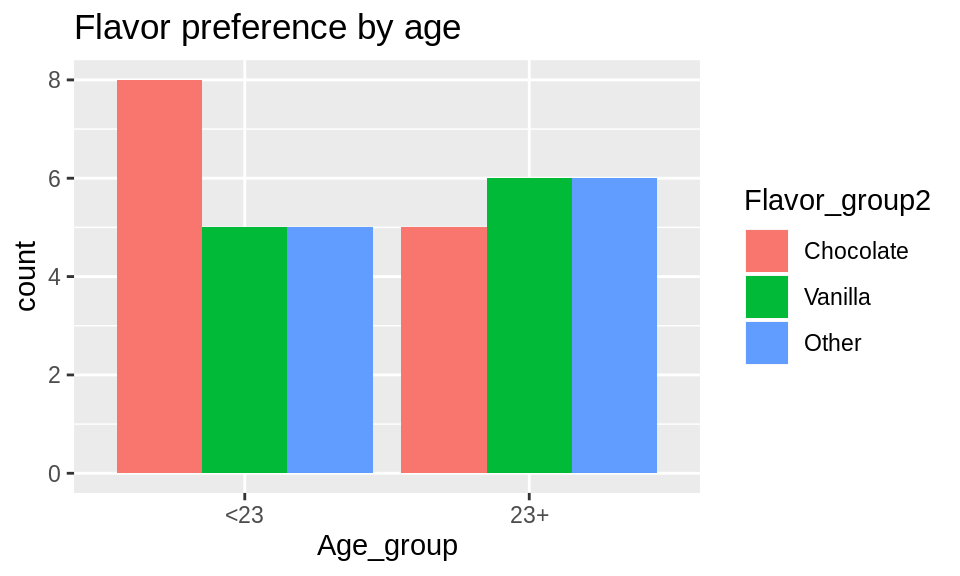
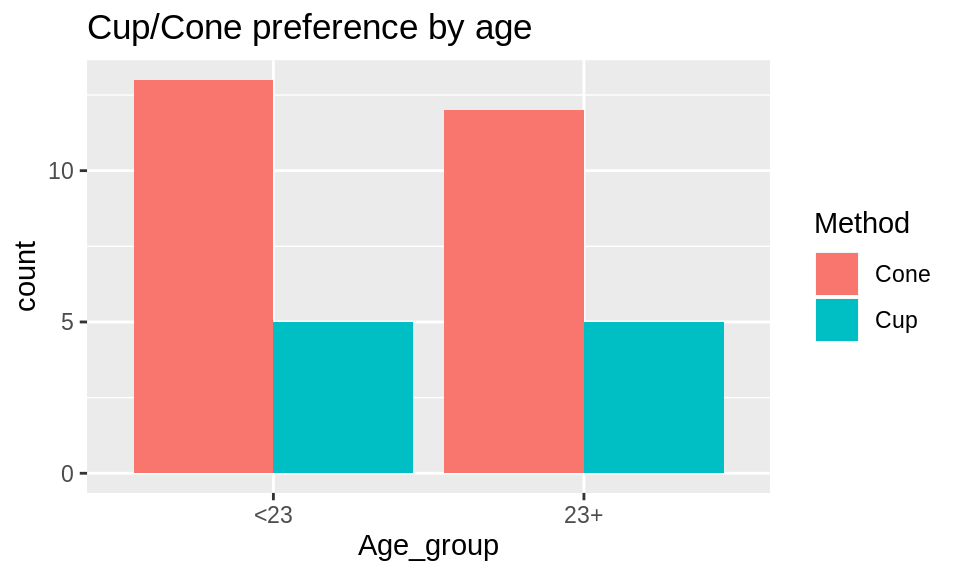
Age doesn’t apear to play a major role in preferences. Maybe this isn’t too surprising since I chose an arbitrary split for the two groups!
56.6 Takeaways
N = 35 is very small when you have 4 variables of interest with multiple categories each. Analyzing respones required bucketing each variable of interest into 2 or 3 categories.
Chocolate and vanilla based ice creams are about equally preferred.
Cones are much more popular than cups. Respondents who liked vanilla were more likely to prefer cups.
Age did not play a major role in preferences, likely due to a small age range of 17 years.