Chapter 21 Likert
Shijie He and Chutian Chen
21.1 Overview
This section covers how to make stacked bar chart on likert data.
Likert data is the data with likert scale. Likert scale is a several point scale which is used to allow people to express how much they agree or disagree with a particular statement. And It’s commonly used in survey and research.
21.2 tl;dr
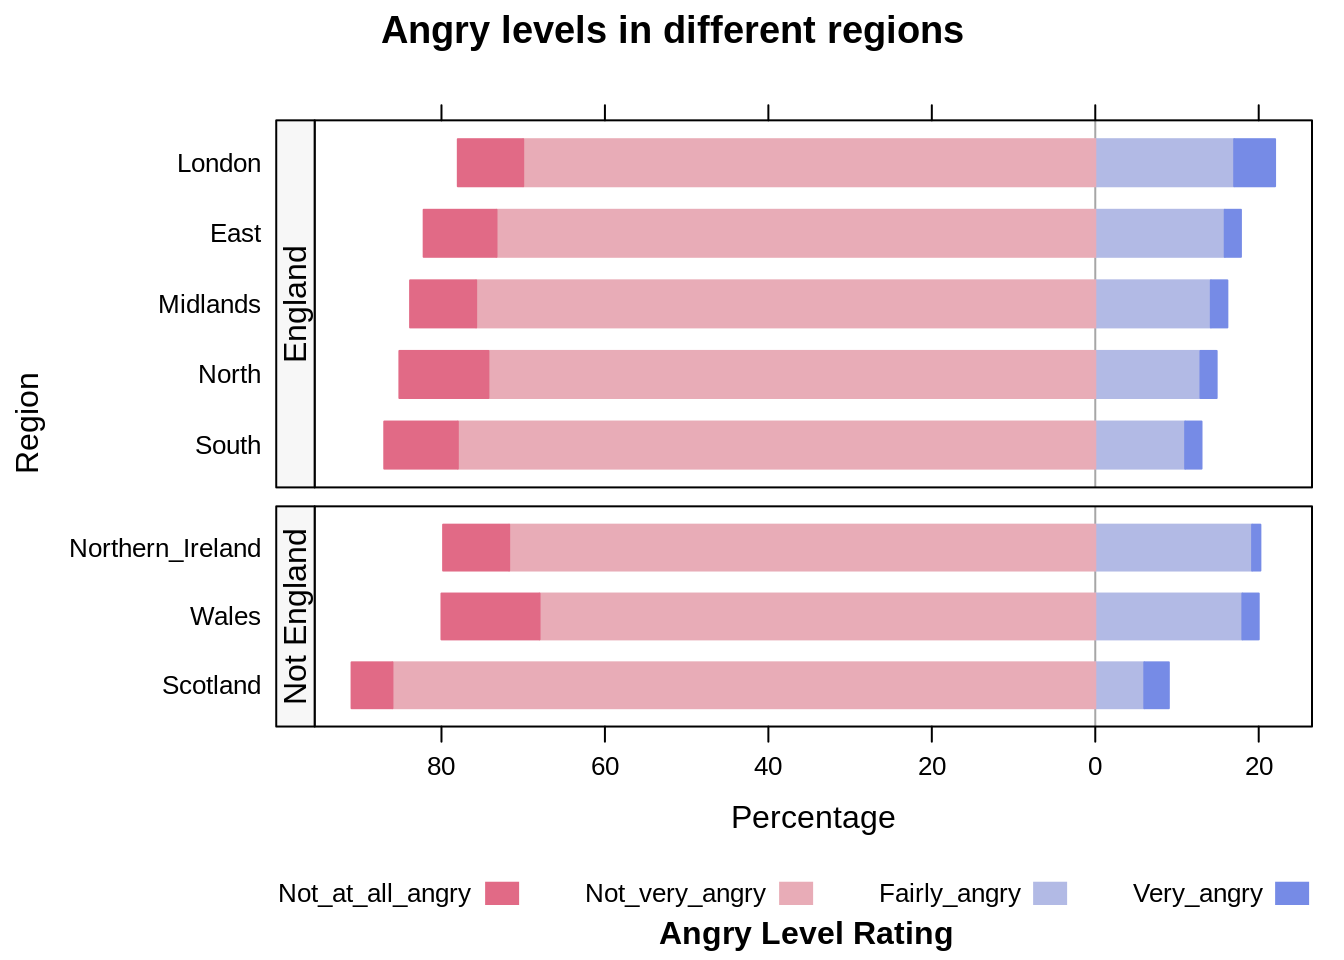
Here’s a stacked bar chart of angry levels:
And here’s the code:
library(HH)
library(dplyr)

# create data
data = data.frame("Not_at_all_angry"=c(0.11,0.08,0.09,0.08,0.09,0.12,0.05,0.08),"Not_very_angry"=c(0.75,0.75,0.74,0.70,0.78,0.68,0.86,0.71),"Fairly_angry"=c(0.13,0.14,0.16,0.17,0.11,0.18,0.06,0.19),"Very_angry"=c(0.02,0.02,0.02,0.05,0.02,0.02,0.03,0.01),"Region"=c("North","Midlands","East","London","South","Wales","Scotland","Northern_Ireland"),"England" = c("England", "England", "England", "England", "England", "Not England", "Not England", "Not England"))

# make stacked bar chart
likert(Region ~.|England, layout=c(1,2), data, positive.order = TRUE,
       scales=list(y=list(relation="free")),
       strip.left=strip.custom(bg="gray97"),
       strip=FALSE,
       as.percent = "noRightAxis", ReferenceZero = 2.5,
       main = 'Angry levels in different regions',
       ylab = "Region", xlab = "Percentage",
       sub= list("Angry Level Rating",x=unit(.6, "npc")))
For more info on this dataset, go to https://d25d2506sfb94s.cloudfront.net/cumulus_uploads/document/v6iuiikyxq/YG-X-MarksTheSpot-BrandsAnger-280812.pdf.
21.3 Simple examples
Too complicated! Let’s see some simpler examples first.
For the below examples, we will use the survey of the satisfaction of Trump for male and female.
data_2 <- data.frame("Great"=c(4,2),"Good"=c(14,6),"Average"=c(15,16),"Poor"=c(17,17),"Terrible"=c(44,48),"Gender"=c("Male","Female"))

data_2 <- data_2[,c(6,1,2,3,4,5)]

data_2
## Gender Great Good Average Poor Terrible
## 1 Male 4 14 15 17 44
## 2 Female 2 6 16 17 48For more info on this dataset, go to https://d25d2506sfb94s.cloudfront.net/cumulus_uploads/document/psse08hgpj/YouGov%20-%20Trump%20state%20visit%20190520.pdf.
21.3.1 Stacked bar chart
To create a stacked bar chart, we will simply use likert function.
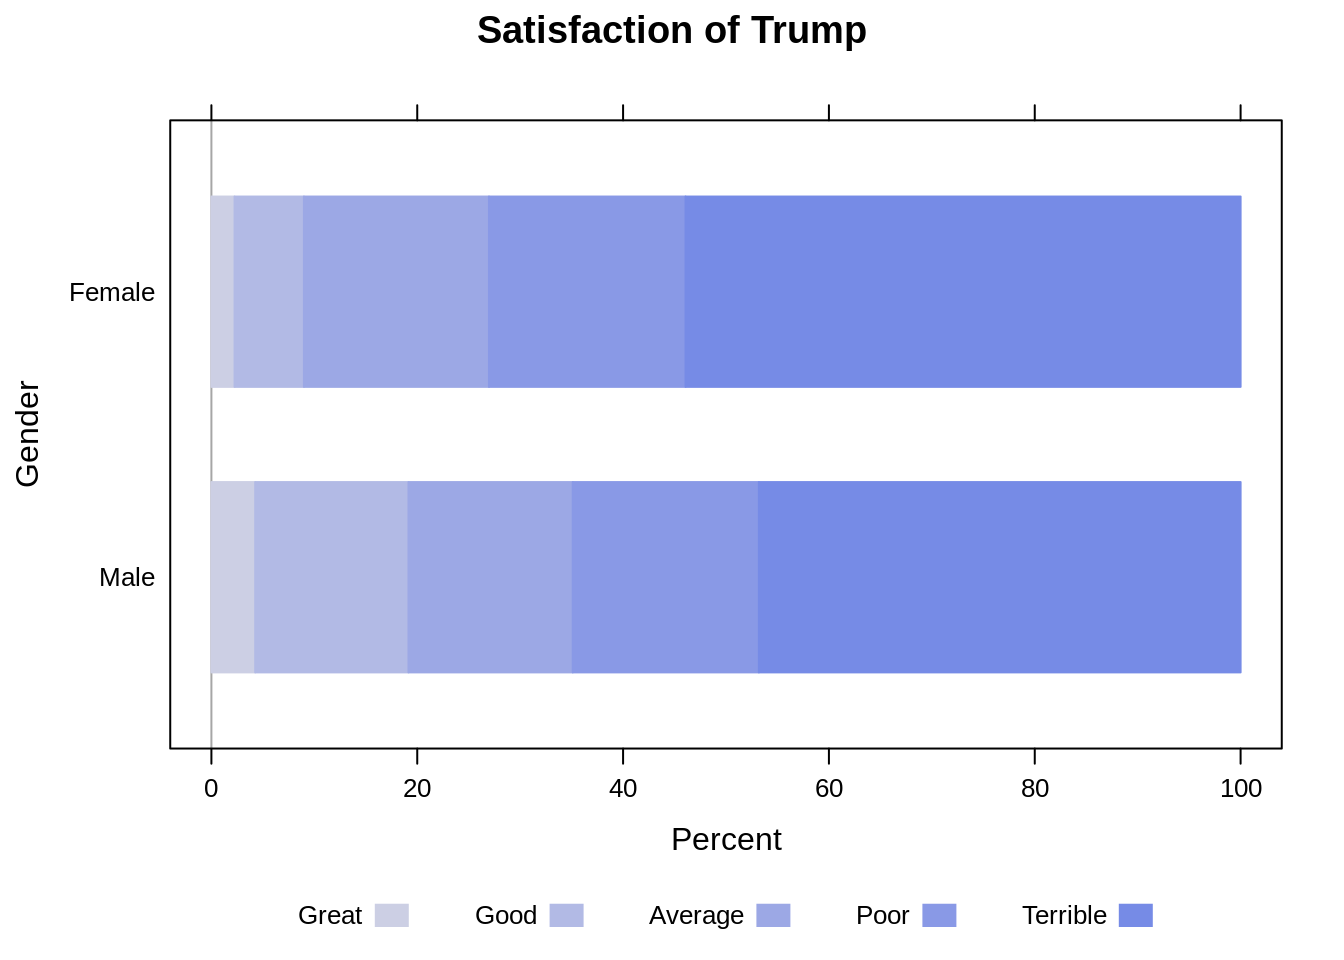
It is easy to compare the end values using stacked bar chart, but it is hard to compare the neutral percentage.
21.3.2 Diverging stacked bar chart
To create a diverging stacked bar chart, we will modify ReferenceZero to the neutral category.
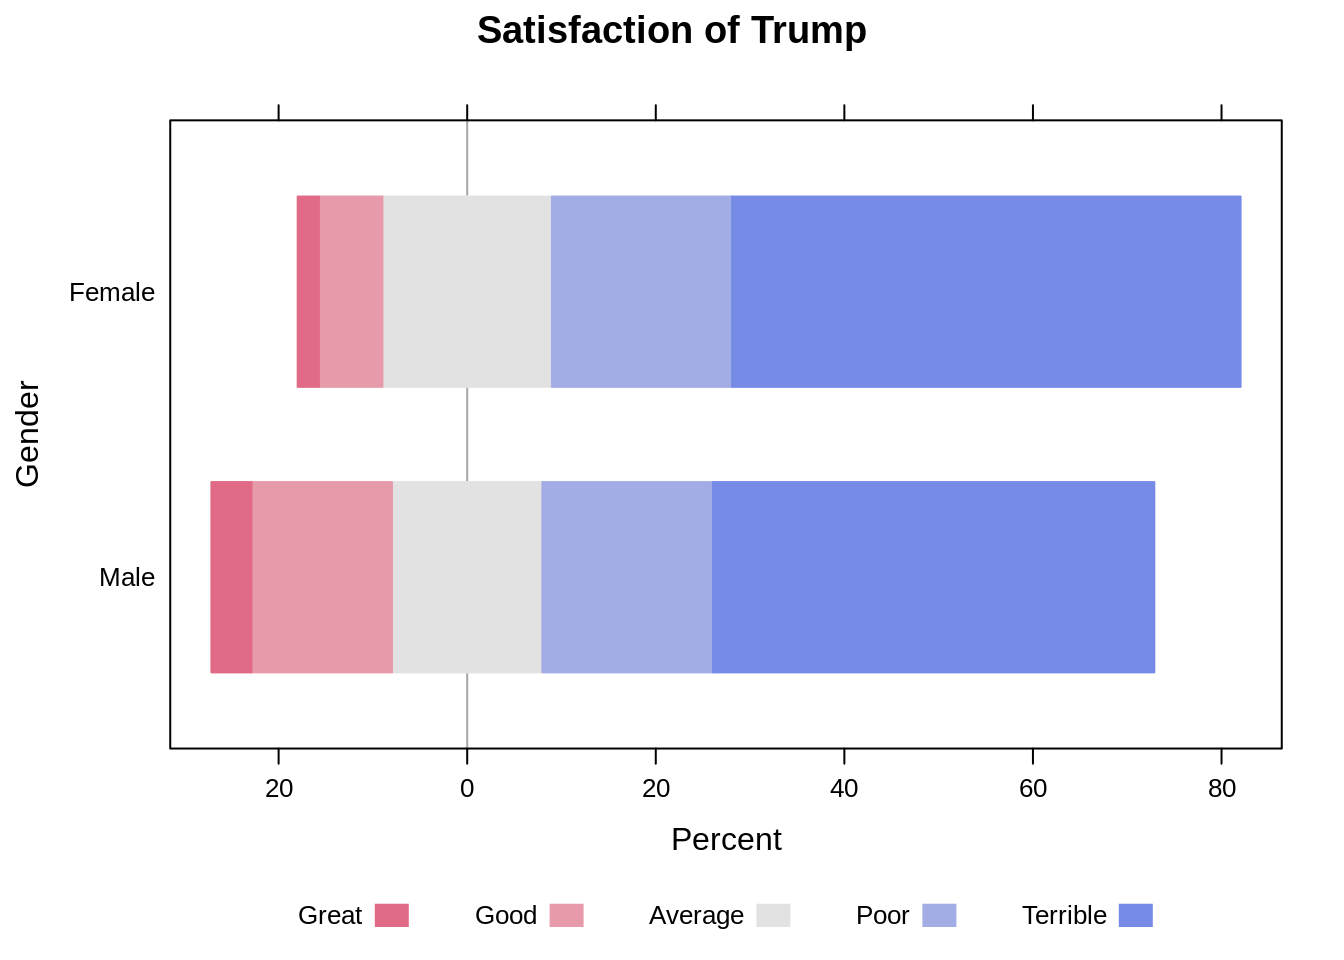
It is easy to visualize the overall shape of likes and dislikes, and the percentage of neutrals. However, it is hard to compare the value of like and dislike categories.
21.4 Stacked bar chart using ggplot
In fact, we can make likert plot using ggplot. There is a easy way through dividing the data into two parts which represent agreement and disagreement respectively. Then we can generate the two plots on same place with one of the value of plot is negative. If there is neutral option in data, we have to divide it into two parts, which will be a little more complicated.
library(ggplot2)
library(reshape2)
library(RColorBrewer)
library(dplyr)
library(ggthemes)
library(stringr)
library(forcats)

d <- data_2
d[,2:6] <- d[,2:6]/rowSums(d[,2:6])

mytitle <- "Satisfaction of Trump"
mylevels <- c("Great", "Good", "Average", "Poor",  "Terrible")

# Generate mid value of neutral category
numlevels <- length(d[1,])-1
numcenter <- ceiling(numlevels/2) + 1
d$midvalues <- d[,numcenter]/2
d_2<-cbind(d[,1],d[,2:ceiling(numlevels/2)], d$midvalues, d$midvalues,d[,numcenter:numlevels+1])
colnames(d_2)<-c("Sex",mylevels[1:floor(numlevels/2)],"Midlow",
  "Midhigh",mylevels[numcenter:numlevels])

# Split into six categories
numlevels<-length(mylevels)+1
point1<-2
point2<-((numlevels)/2)+1
point3<-point2+1
point4<-numlevels+1

# Assign color to each categories
numlevels<-length(d[1,])-1
temp.rows<-length(d_2[,1])
pal<-brewer.pal((numlevels-1),"RdBu")
pal[ceiling(numlevels/2)]<-"#DFDFDF"
legend.pal<-pal
pal<-c(pal[1:(ceiling(numlevels/2)-1)], pal[ceiling(numlevels/2)],
       pal[ceiling(numlevels/2)], pal[(ceiling(numlevels/2)+1):(numlevels-1)])

# Generate new data frame including all information
d_3<-melt(d_2,id="Sex")
d_3$col<-rep(pal,each=temp.rows)
d_3$value<-d_3$value*100
d_3$Sex<-str_wrap(d_3$Sex, width = 40)
d_3$Sex<-factor(d_3$Sex, levels = d_2$Sex[order(-(d_2[,5]+d_2[,6]+d_2[,7]))])
highs<-na.omit(d_3[(length(d_3[,1])/2)+1:length(d_3[,1]),])
lows<-na.omit(d_3[1:(length(d_3[,1])/2),])

# Plot
ggplot() + geom_bar(data=highs, aes(x = Sex, y=value, fill=col), position="stack", stat="identity", width = 0.5) +
  geom_bar(data=lows, aes(x = Sex, y=-value, fill=fct_inorder(col)), position="stack", stat="identity", width = 0.5) +
  geom_hline(yintercept = 0, color =c("white")) +
  scale_fill_identity("Percent", labels = mylevels, breaks=legend.pal, guide="legend") +
  theme_fivethirtyeight() +
  coord_flip() +
  labs(title=mytitle, y="",x="") +
  theme(plot.title = element_text(size=14, hjust=0.5)) +
  theme(axis.text.y = element_text(hjust=0)) +
theme(legend.position = "bottom") 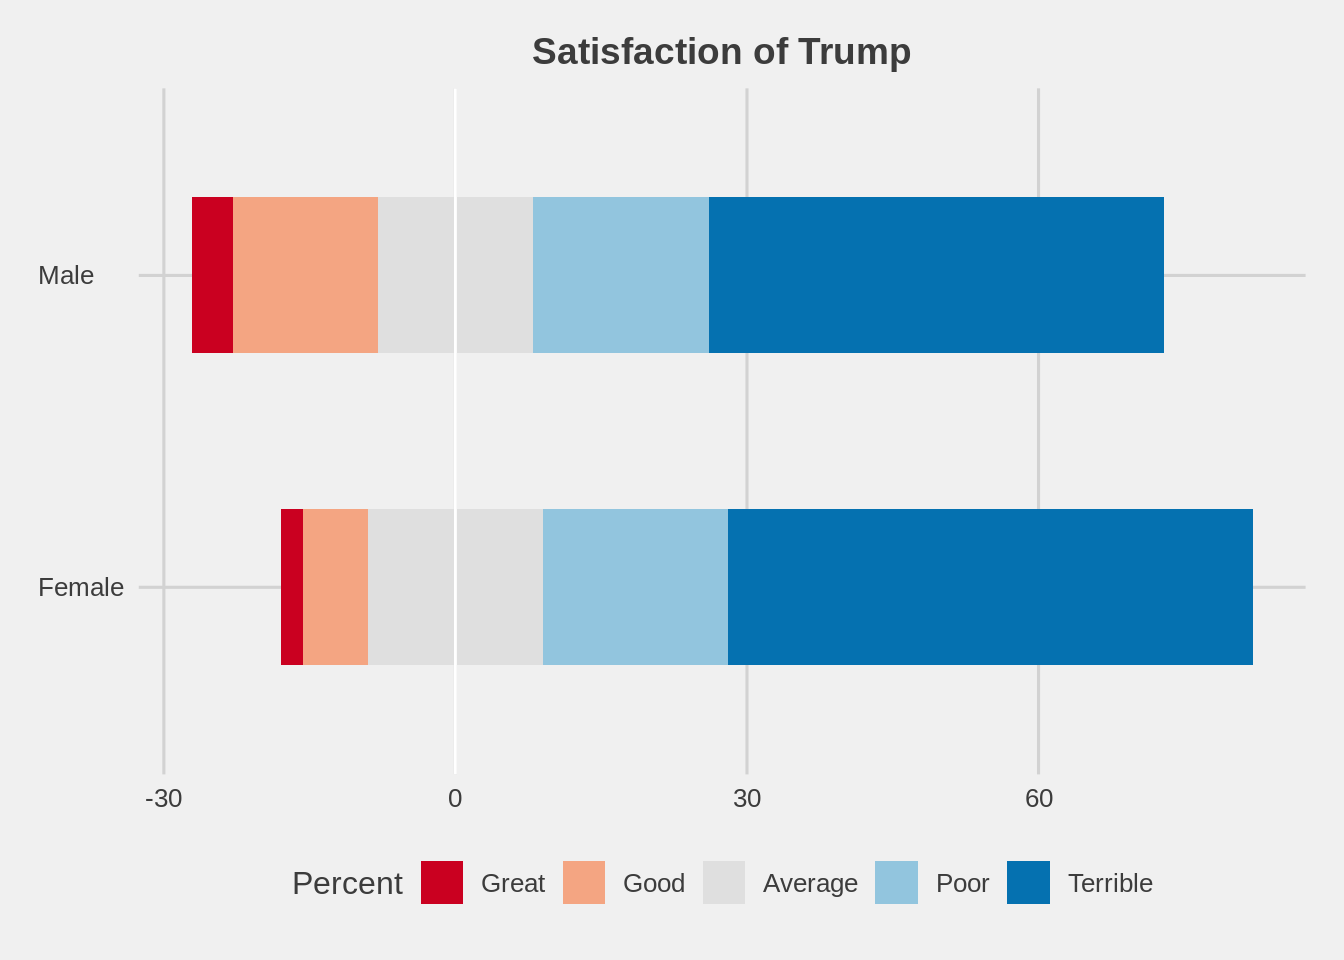
21.5 Theory
Likert data is a type of rating scale commonly used in surveys. It’s a bipolar data, representing the attitude to a statement. We can add neutral options to help candidate make choices when they are uncertain.
A typical Likert scale may look like
- Strongly disagree
- Disagree
- Agree
- Strongly agree
or
- Strongly disagree
- Disagree
- Neither agree or disagree
- Agree
- Strongly agree
The options of likert scale can avoid the distortion of the survey result which is likely to be too extreme.
21.6 When to use
When the data is from survey and is likert scale.
21.7 External resources
- 4 ways to visualize Likert Scales: The advantages and disadvantages of different stacked bar chart.
- Likert Plots in R: Using ggplot to plot diverging stacked bar chart.