Chapter 30 Wordcloud
Chengyou Ju and Yujie Wang
This Rmd file is created by Chengyou Ju (UNI: cj2624) and Yujie Wang (UNI: yw3442) for STAT GR5702 Community Contribution Group 15.
In this file, we will provide a tutorial on how to draw Wordcloud graphs using the wordcloud2 package in R.
The dataset in this project are from the demoFreq package.
30.1 1. Introduction
A Wordcloud is a visual representation of text data. Wordclouds are useful for quickly perceiving the most prominent terms, which makes them widely used in media and well understood by the public.
A Wordcloud is a collection of words depicted in different sizes. The bigger and bolder the word appears, the greater frequency within a given text and the more important it is.
There are two packages in R that can help us draw a wordcloud. wordcloud is the basic package to build the graph, while wordcloud2 package allows more customization. In our demo, we will focus on the wordcloud2 package, which is more widely used.
30.2 2. Demo of wordcloud2 Package
For our demo, we will use a built-in dataset demoFreq, which has 1011 observations of 2 variables, words and frequancy.
##
##
   checking for file ‘/tmp/RtmpgWatC5/remotes6fac46b40627/Lchiffon-wordcloud2-8a12a3b/DESCRIPTION’ ...

✔  checking for file ‘/tmp/RtmpgWatC5/remotes6fac46b40627/Lchiffon-wordcloud2-8a12a3b/DESCRIPTION’
##

─  preparing ‘wordcloud2’:
##

   checking DESCRIPTION meta-information ...

✔  checking DESCRIPTION meta-information
##

─  checking for LF line-endings in source and make files and shell scripts
##

─  checking for empty or unneeded directories
##    Removed empty directory ‘wordcloud2/examples/img’
##    Removed empty directory ‘wordcloud2/examples’
## ─  looking to see if a ‘data/datalist’ file should be added
##

─  building ‘wordcloud2_0.2.2.tar.gz’
##


## ## word freq
## oil oil 85
## said said 73
## prices prices 48
## opec opec 42
## mln mln 31
## the the 26Parameters for wordcloud2 from Rdocumentation
data - data frame with word and freqency of the word
size - Font size, default is 1. The larger size means the bigger word
fontFamily - font used in the word cloud
fontWeight - Font weight to use, e.g. normal, bold or 600
color - color of the text, keyword ’random-dark’ and ’random-light’ can be used.
backgroundColor - Color of the background
minRotation - If the word should rotate, the minimum rotation (in rad) the text should rotate.
maxRotation - If the word should rotate, the maximum rotation (in rad) the text should rotate.
shuffle - Shuffle the points to draw so the result will be different each time for the same list and settings.
rotateRatio - Probability for the word to rotate. Set the number to 1 to always rotate.
shape - The shape of the “cloud” to draw. Can be a keyword present.
widgetsize - size of the widgets
figPath - The path to a figure used as a mask.
hoverFunction - Callback to call when the cursor enters or leaves a region occupied by a word.
30.2.1 2.0 Basic Wordcloud Graph
Building a wordcloud graph is simple. We can use the wordcloud2 package directly after successfully installing it.
It is actually an interactive plot. If we hover on a certain word, it will pop up the word with its frequency.
30.2.2 2.1 Font Size
We can also modify the font size of the graph.
30.2.3 2.2 Color and Background Color
The word color can be changed using the “color” argument, while the background color can be changed with “backgroundColor”.
30.2.4 2.3 Shape
We can also customize the shape of a wordcloud using the “shape” argument. Here are some examples.
30.2.5 2.4 Rotation
We can also do rotation on the wordcloud graph.
30.2.6 2.5 Language
We can draw a wordcloud graph of words in Chinese.
30.2.7 2.6 Customized shape
We can build wordcloud with the shape of a word using function letterCloud.

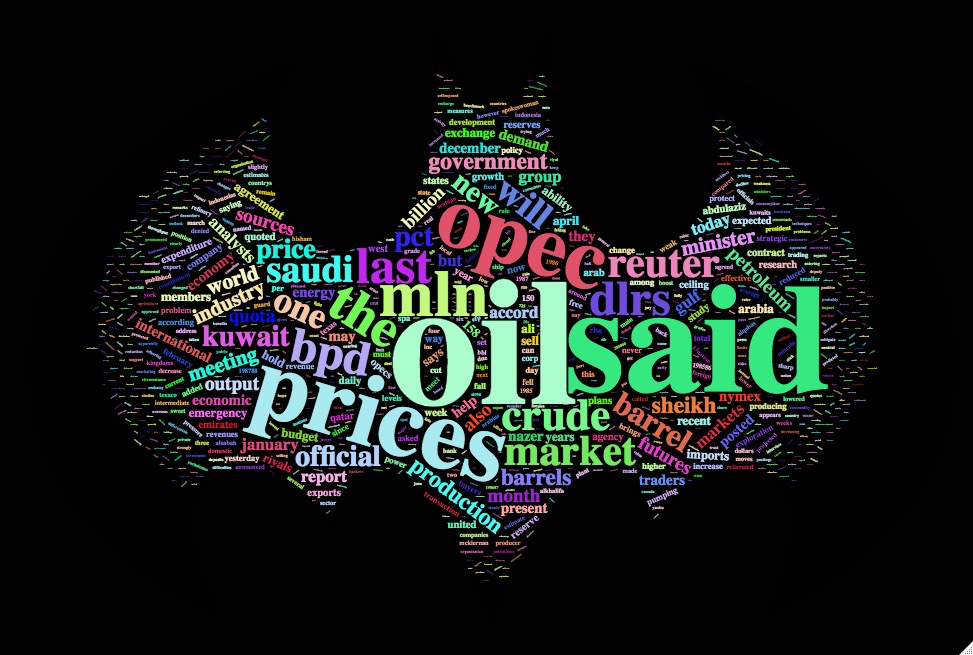
Also, we can create user-defined shape for the wordcloud by simply adding the image we choose to figPath.
wordcloud2(demoFreq, figPath ="~/Desktop/batman.png", size = 1,
color = "random-light",backgroundColor = "black") 
batman