35 3D visualization: shinyaframe introduction and tutorial
Zhaoyu Wu
On Oct 28, 2021, the tech giant Facebook rebranded itself as ‘Meta’, marking the transformation of the once-dominant social networking software company into a metaverse company. Curious people around the world are now asking, what exactly is metaverse?
 (Click on the image to view the video for metaverse)
Imagine a world where reality and virtuality blend together, where we can gain ultra experiences that are unimaginable in the real life. Virtual reality and augmented reality allow the digital worlds to become ‘real’. People have the option to live an alternative virtual life in the same way they live their real life. The users can choose the virtual characters to represent themselves and join various activities in virtual environments VR technologies would also provide new features for Internet of Things(IoTs) and greatly enriches the metaverse experience. 3D data visualization would become an essential tool to enhance users’ virtual experience.
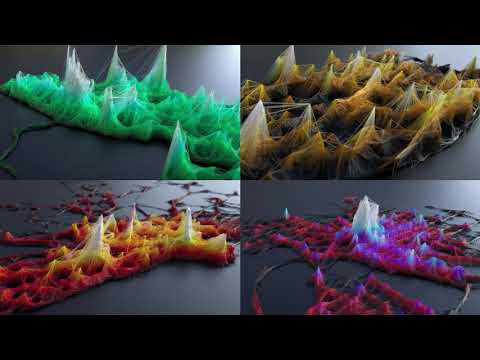 (Click on the image to view the video for 3D data visualization)
In R language, we can also make 3D data visualization using shinyaframe package. Package Shinyaframe makes R data available in Web-based virtual reality experiences for immersive, cross-platform data visualizations. Includes the ‘gg-aframe’ JavaScript package for a Grammar of Graphics declarative HTML syntax to create 3-dimensional visualizations. (https://www.rdocumentation.org/packages/shinyaframe/versions/1.0.1/topics/shinyaframe)
library(shiny)
library(dplyr)
library(scales)
library(shinyaframe)
library(htmlwidgets)
library(d3r)
The following is an example of the application of package shinyaframe provided by DataCamp (https://www.rdocumentation.org/packages/shinyaframe/versions/1.0.1/topics/shinyaframe) The 3D animation can be viewed in .rmd file by running the block below:
if (interactive()) {


  shinyApp(
    ui = fluidPage(
      aDataSceneOutput(

        outputId = "mydatascene",

        environment = "",

        atags$entity(

          plot = "",

          `scale-shape` = "sizable",
          position = "0 1.6 -1.38",
          atags$entity(
            `layer-point` = "",
            `data-binding__sepal.length`="target: layer-point.x",
            `data-binding__sepal.width`="target: layer-point.y",
            `data-binding__petal.length`="target: layer-point.z",
            `data-binding__species`="target: layer-point.shape",
            `data-binding__petal.width.size`="target: layer-point.size",
            `data-binding__species.color`="target: layer-point.color"
          ),
          atags$entity(
            `guide-axis` = "axis: x",
            `data-binding__xbreaks` = "target: guide-axis.breaks",
            `data-binding__xlabels` = "target: guide-axis.labels",
            `data-binding__xtitle` = "target: guide-axis.title"
          ),
          atags$entity(
            `guide-axis` = "axis: y",
            `data-binding__ybreaks` = "target: guide-axis.breaks",
            `data-binding__ylabels` = "target: guide-axis.labels",
            `data-binding__ytitle` = "target: guide-axis.title"
          ),
          atags$entity(
            `guide-axis` = "axis: z",
            `data-binding__zbreaks` = "target: guide-axis.breaks",
            `data-binding__zlabels` = "target: guide-axis.labels",
            `data-binding__ztitle` = "target: guide-axis.title"
          ),
          atags$entity(
            `guide-legend` = "aesthetic: shape",
            `data-binding__shapetitle` = "target: guide-legend.title"
          ),
          atags$entity(
            `guide-legend` = "aesthetic: size",
            `data-binding__sizebreaks` = "target: guide-legend.breaks",
            `data-binding__sizelabels` = "target: guide-legend.labels",
            `data-binding__sizetitle` = "target: guide-legend.title"
          ),
          atags$entity(
            `guide-legend` = "aesthetic: color",
            `data-binding__colorbreaks` = "target: guide-legend.breaks",
            `data-binding__colorlabels` = "target: guide-legend.labels",
            `data-binding__colortitle` = "target: guide-legend.title"
          ),
          atags$other('animation', attribute = "rotation",
                      from = "0 45 0", to = "0 405 0",
                      dur = "10000", `repeat` = "indefinite")
        )
      )
    ),
    server = function(input, output, session) {
      output$mydatascene <- renderADataScene({
        names(iris) <- tolower(names(iris))

        positional_to <- c(0.01, 0.99)

        color_scale = setNames(rainbow(3, 0.75, 0.5, alpha = NULL),
                               unique(iris$species))
        iris %>%

          mutate_if(is.numeric, rescale, to = positional_to) %>%

          mutate(petal.width.size = rescale(petal.width^(1/3), to = c(0.5, 2)),
                 species.color = color_scale[species]) ->
          iris_scaled

        make_guide <- function (var, aes, breaks = c(0.01, 0.5, 0.99)) {
          guide = list()
          domain = range(iris[[var]])
          guide[[paste0(aes, "breaks")]] <- breaks
          guide[[paste0(aes, "labels")]] <- c(domain[1],
                                              round(mean(domain), 2),
                                              domain[2])
          guide[[paste0(aes, "title")]] <- var
          guide
        }
        Map(make_guide,
            var = c("sepal.length", "sepal.width", "petal.length"),
            aes = c("x", "y", "z")) %>%

          c(list(make_guide("petal.width", "size", c(0.5, 1.25, 2)^(1/3)))) %>%
          Reduce(f = c) ->
          guides
        guides$shapetitle = "species"
        guides$colortitle = "species"
        guides$colorbreaks = color_scale
        guides$colorlabels = names(color_scale)

        aDataScene(c(iris_scaled, guides))
      })
    }
  )
}
(Click on the image to view the video for 3D data visualization on Iris)
Here is another exmaple provided by the shinyaframe documentation: (https://cran.r-project.org/web/packages/shinyaframe/shinyaframe.pdf) The 3D animation can be viewed in .rmd file by running the block below:
if (interactive()) {

  shinyApp(
    ui = fluidPage(
      aDataSceneOutput(
        outputId = "mydatascene",
        atags$entity(
          plot = "", position = "0 1.6 -1.38", rotation = "0 45 0",
          atags$entity(
            `layer-point` = "", `mod-oscillate` = "",
            `data-binding__sepal.length`="target: layer-point.x",
            `data-binding__sepal.width`="target: layer-point.y",
            `data-binding__petal.length`="target: layer-point.z",

            `data-binding__petal.width`="target: mod-oscillate.y",
            `data-binding__species`="target: layer-point.shape"
        )
      )
    )
  ),
  server = function(input, output, session) {
    output$mydatascene <- renderADataScene({
      names(iris) <- tolower(names(iris))
        iris %>%

          mutate_if(is.numeric, rescale) %>%
          aDataScene()
})
}
)
}
(Click on the image to view the video for 3D data scatter visualization)
There are several important features in this packages, including ‘aDataScene’, ‘aframetags’,‘shinyaframe’. The first one, aDataScene, creates a html widget to sync data with a scene via the data-binding A-frame component. It is used in the form aDataScene(data, elementId = NULL), where data is a data frame and elementId is an optional output html element ID. ‘aDataScene’ can only be viewed normally using a modern Web browser and internet connection. Unfortunately WebVR data visualizations can not be rendered in Rmd documents, R Notebooks, or the RStudio Viewer at this time. (https://cran.r-project.org/web/packages/shinyaframe/shinyaframe.pdf)
‘aframetags’ represent frame-cutomized elements. This function can output HTML elements which are customized by the users. There are several subfunction falling under the ‘aframetags’ umberalla. They are aframeAssets(…), aframeMixin(…), aframeEntity(…), aframeSphere(…), aframeBox(…), aframePrimitive(primitive = “entity”, …) and atags. They are wrappers for ‘tag’ to output elements.
With the package ‘shinyaframe’, we can offer Web-based virtual reality experiences for immersive, cross-platform data visualizations. As metaverse concept continue to develop, 3D visualization techniques will play a much more prominent role in enhancing the virtual experiences.
Outside Sources: