32 Parallel coordinate plots cheatsheet
Kechengjie Zhu
32.1 Overview
A parallel coordinate plot maps each row in the data table as a line. Packages including GGally and parcoords help build & improve parallel coordinate plots in R.
32.3 Load Data
Using the mariokart data set for illustration.
df <- as.data.frame(openintro::mariokart)32.4 Basics
ggparcoord(data = df,
           column = c(2:7, 9, 11),
           alphaLines = 0.5,) +
  ggtitle("Relations across auction details")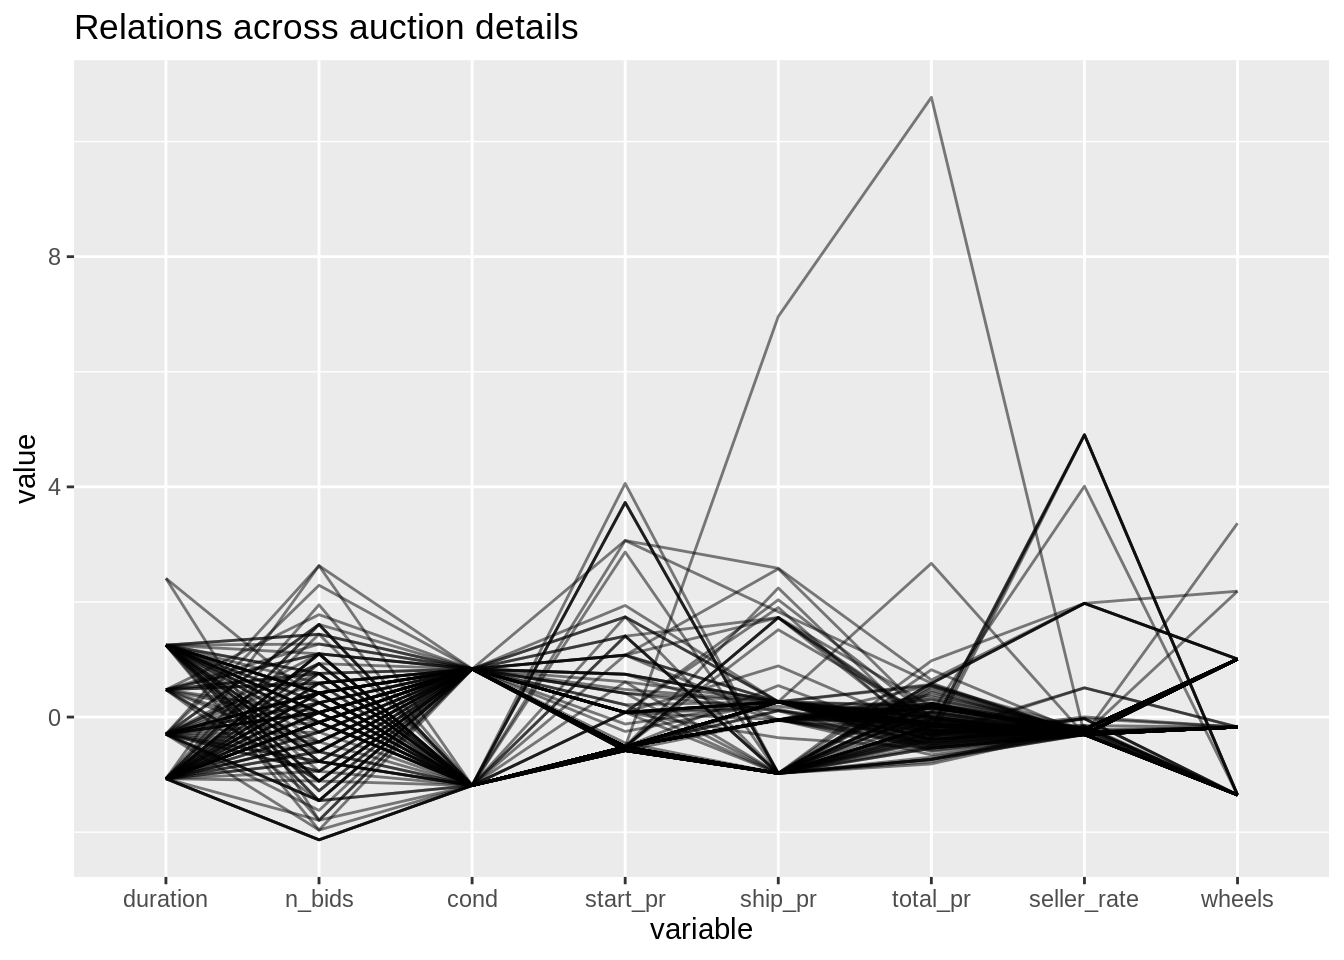
32.4.1 Group by column
Pass to the groupColumn argument with a categorical variable representing groups.
ggparcoord(data = df,
           column = c(2:3, 5:7, 9, 11),
           alphaLines = 0.5,
           groupColumn = "cond") +
  ggtitle("Relations across auction details grouped")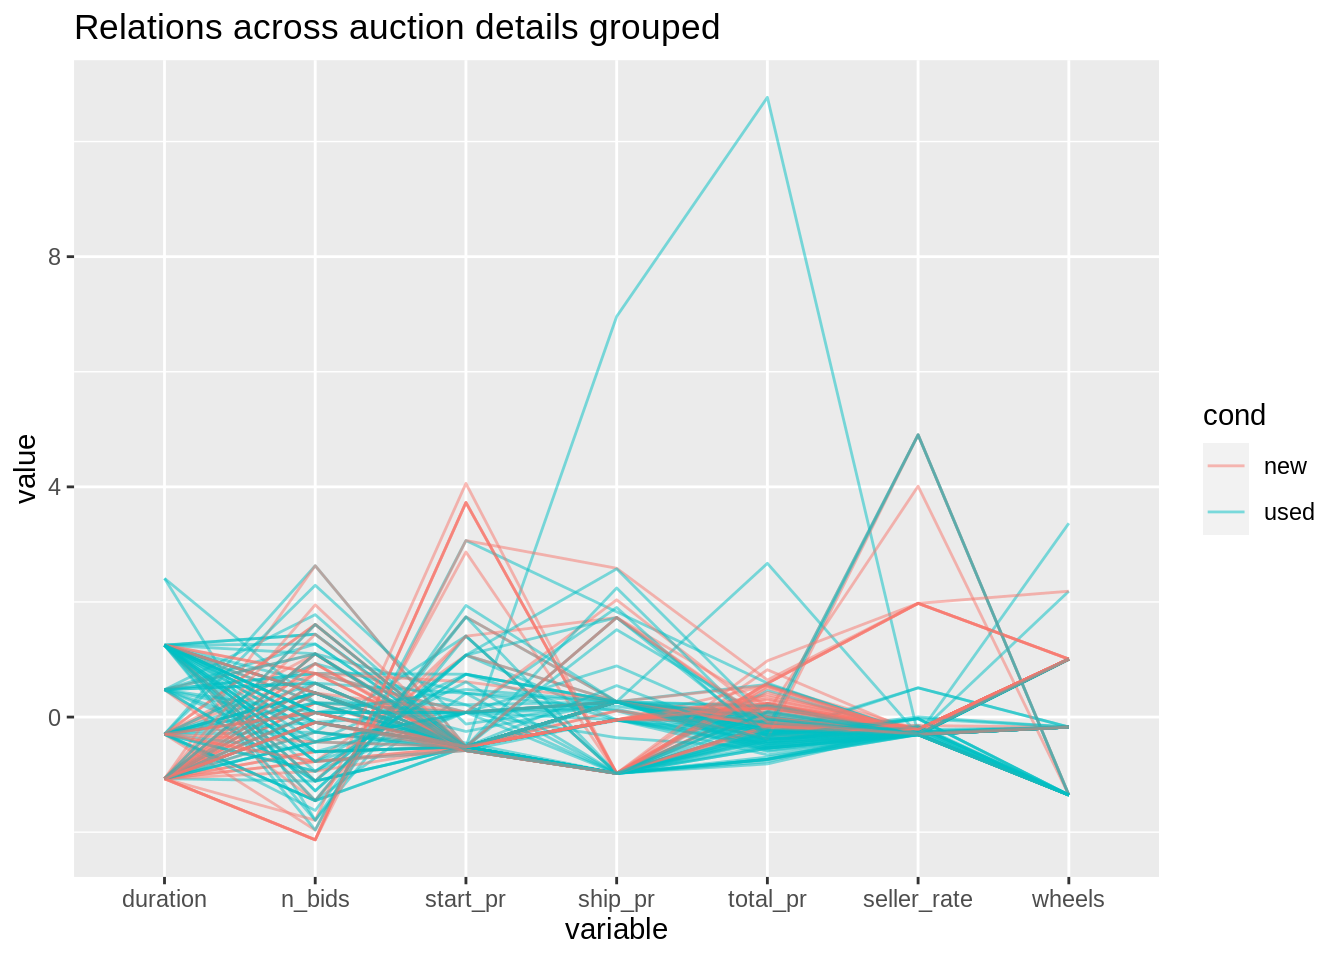
32.4.2 Grouping Application: Highlight Certain Data Entries
Requires some manipulation on data frame.
modified <- df %>%
  mutate(thresh = factor(ifelse(total_pr > 60, "Over 60", "Under 60"))) %>%
  arrange(desc(thresh))
ggparcoord(data = modified,
           column = c(2:3, 5:7, 9, 11),
           alphaLines = 0.5,
           groupColumn = "thresh") +
  scale_color_manual(values = c("red", "grey")) +
  ggtitle("Highlight sales with total price over $60")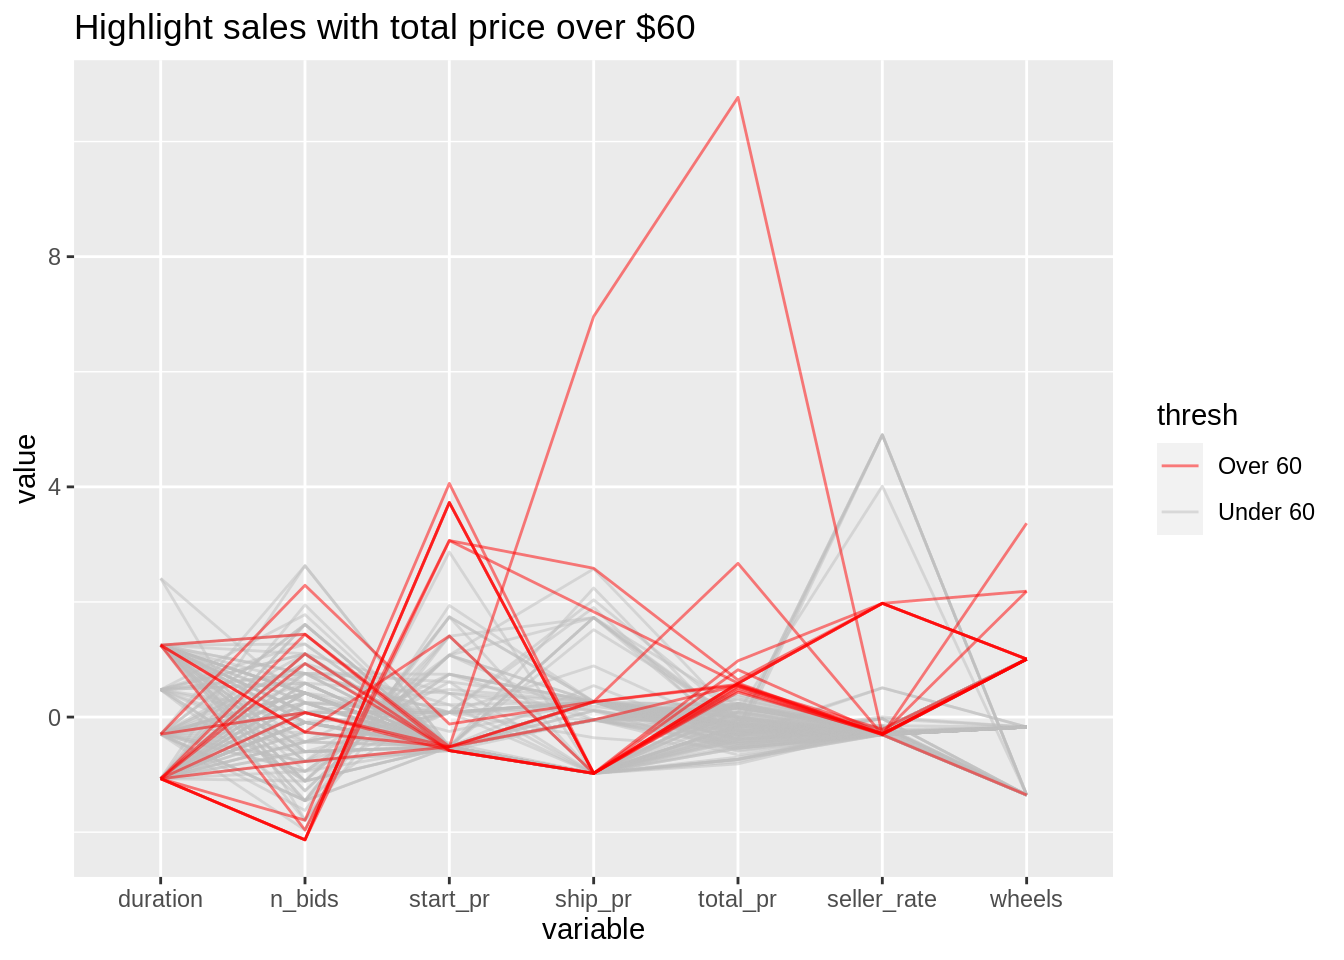
32.4.3 Add data points
Toggle the logical argument showPoints to display/hide data points.
ggparcoord(data = df,
           column = c(2:3, 5:7, 9, 11),
           alphaLines = 0.5,
           groupColumn = "cond",
           showPoints = TRUE) +
  ggtitle("Relations across auction details with points")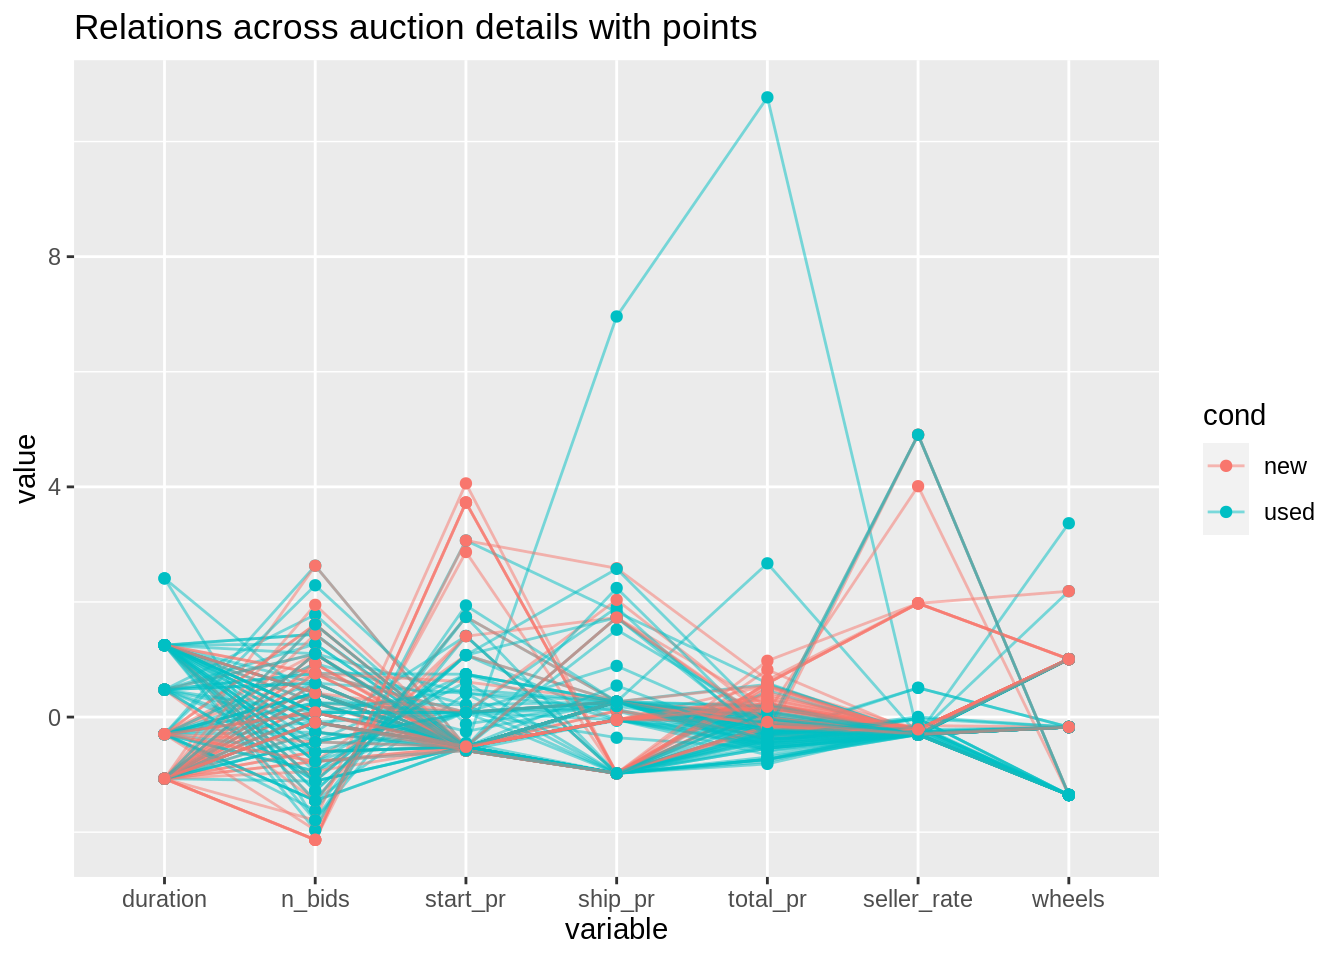
32.4.4 Spline interpolation
Smooth the lines with argument splineFactor. Value can be either logical or numeric.
ggparcoord(data = df,
           column = c(2:3, 5:7, 9, 11),
           alphaLines = 0.5,
           groupColumn = "cond",
           splineFactor = 7) +
  ggtitle("Smoothed relations across auction details")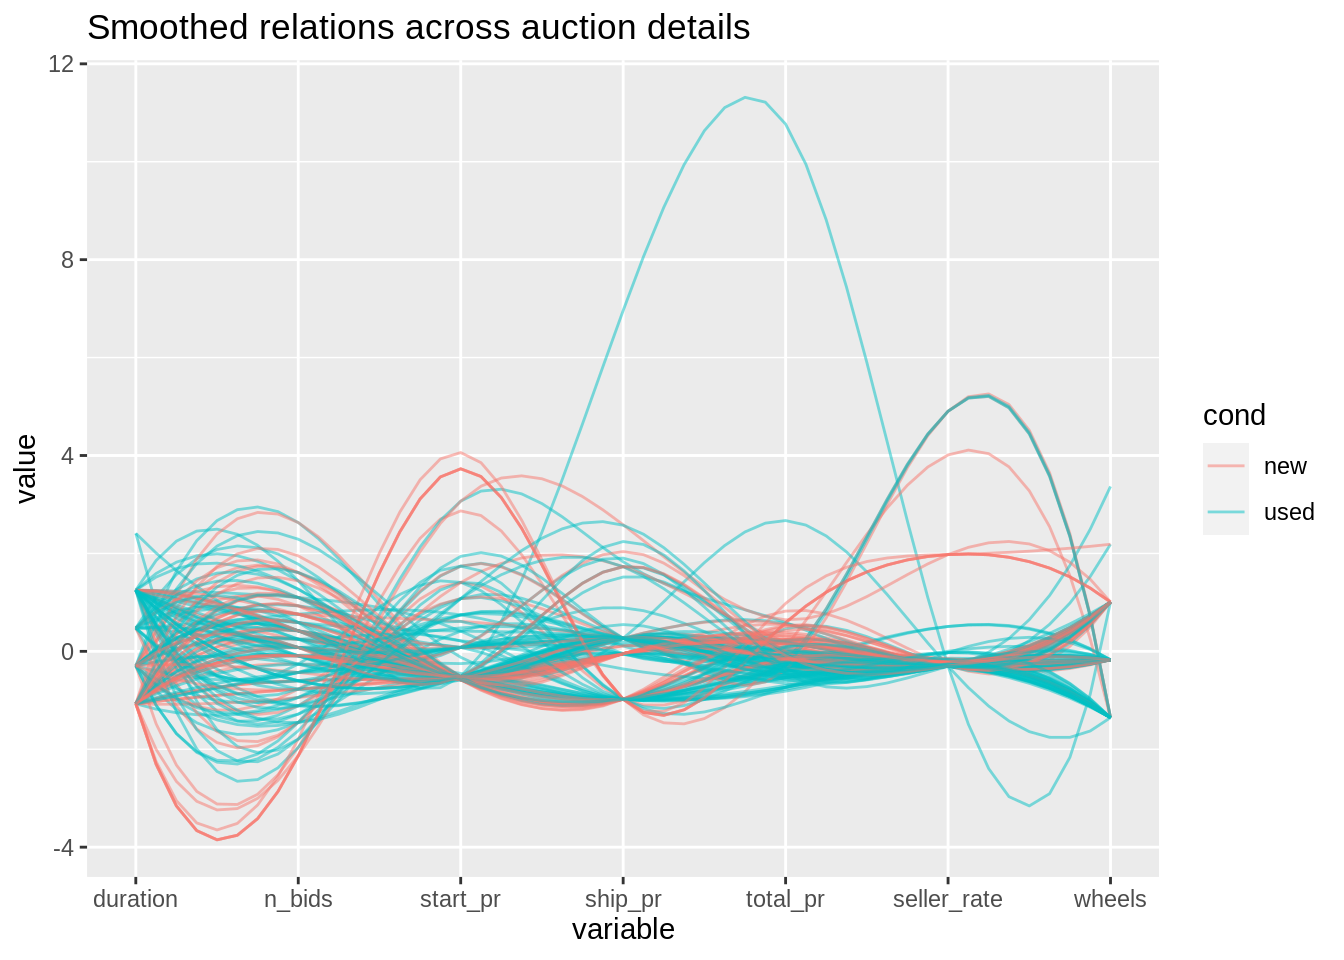
32.4.5 Add box plots
Add box plots with boxplot.
ggparcoord(data = df,
           column = c(2:3, 5:7, 9, 11),
           alphaLines = 0.2,
           groupColumn = "cond",
           boxplot = TRUE) +
  ggtitle("Relations across auction details with box plots")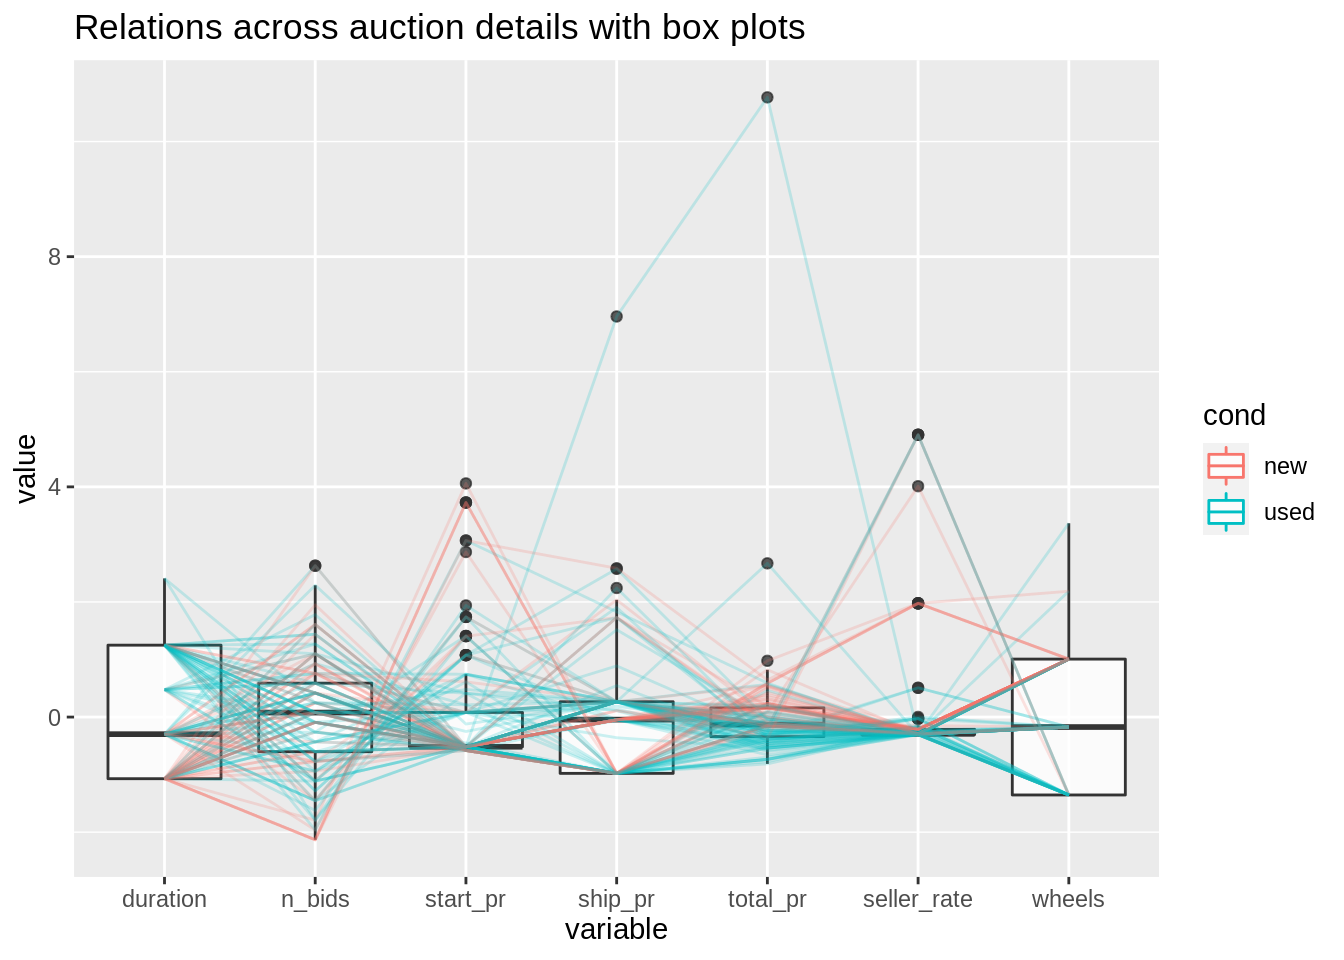
32.5 Scaling methods
Select scaling method with argument scale. Default method is “std”: subtract mean and divide by standard deviation.
32.5.1 “robust”
Subtract median and divide by median absolute deviation.
ggparcoord(data = df,
           column = c(2:3, 5:7, 9, 11),
           alphaLines = 0.5,
           groupColumn = "cond",
           scale = "robust")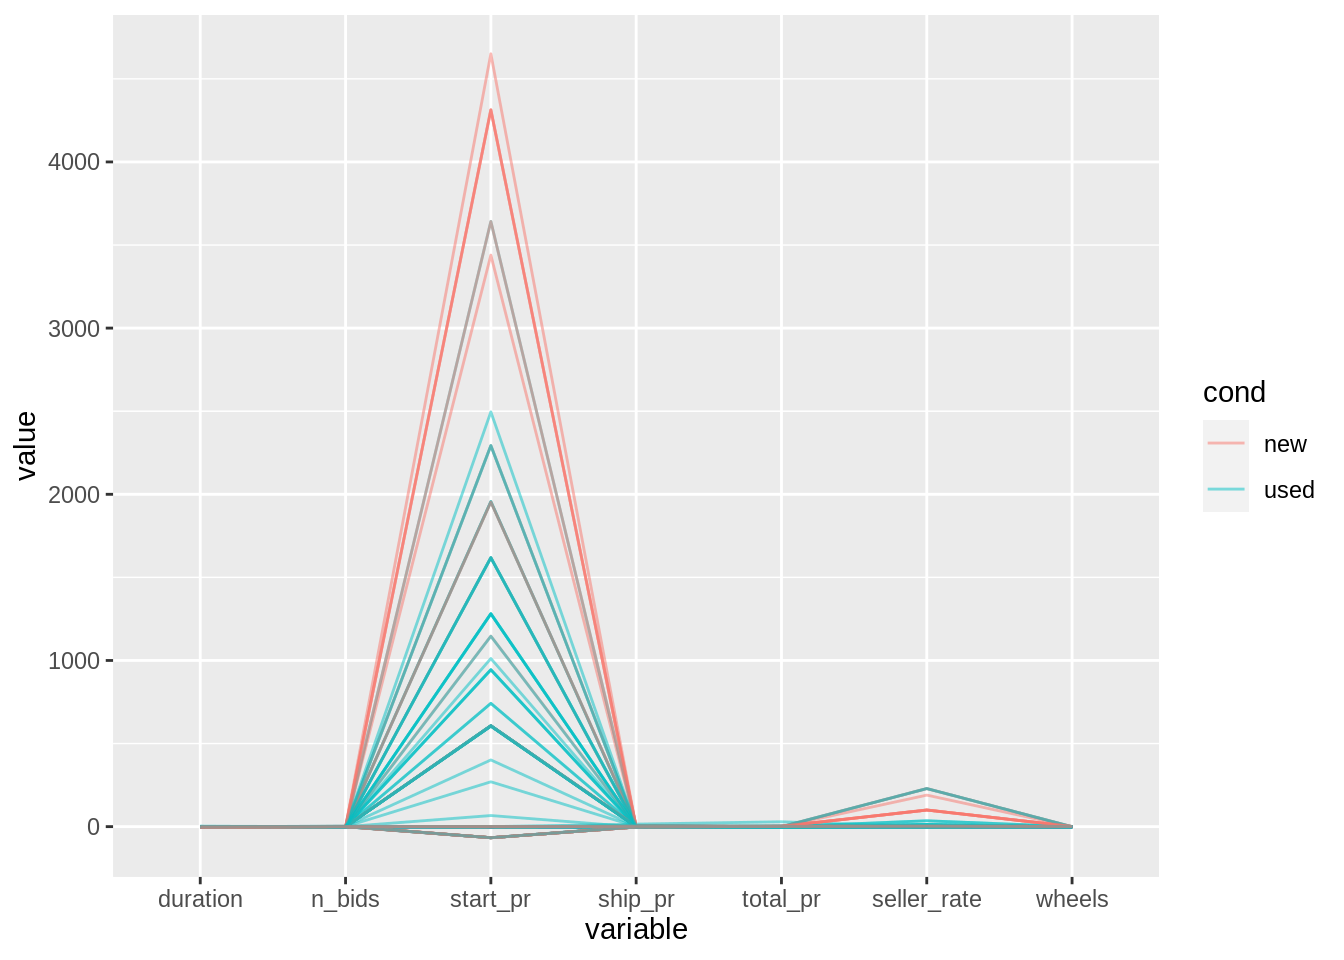
32.5.2 “uniminmax”
Scale so the minimum of the variable is zero, and the maximum is one.
ggparcoord(data = df,
           column = c(2:3, 5:7, 9, 11),
           alphaLines = 0.5,
           groupColumn = "cond",
           scale = "uniminmax")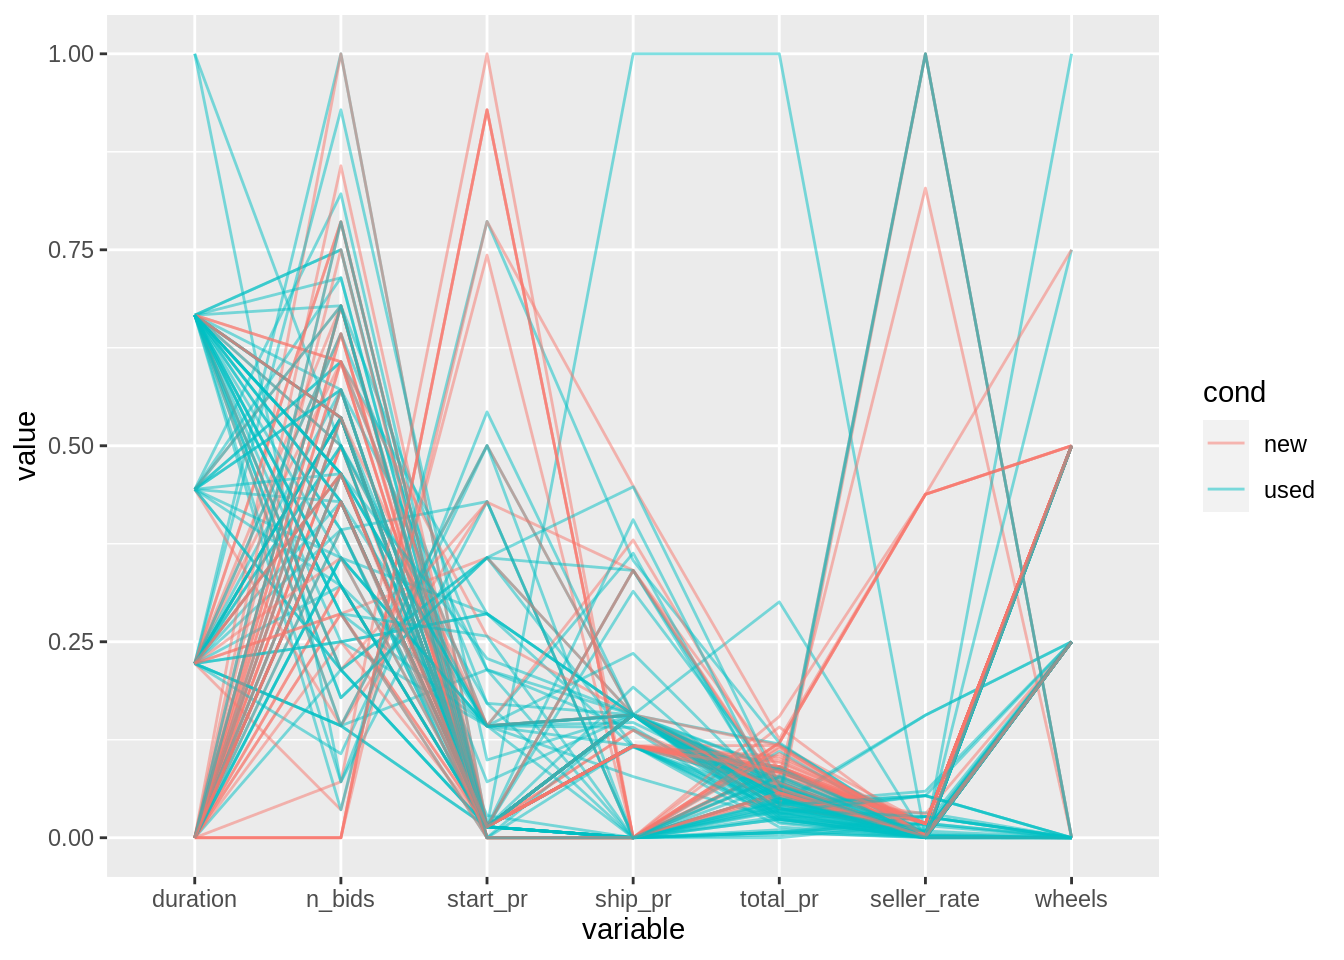
32.5.3 “globalminmax”
No scaling: the range of the graphs is defined by the global minimum and the global maximum.
ggparcoord(data = df,
           column = c(2:3, 5:7, 9, 11),
           alphaLines = 0.5,
           groupColumn = "cond",
           scale = "globalminmax")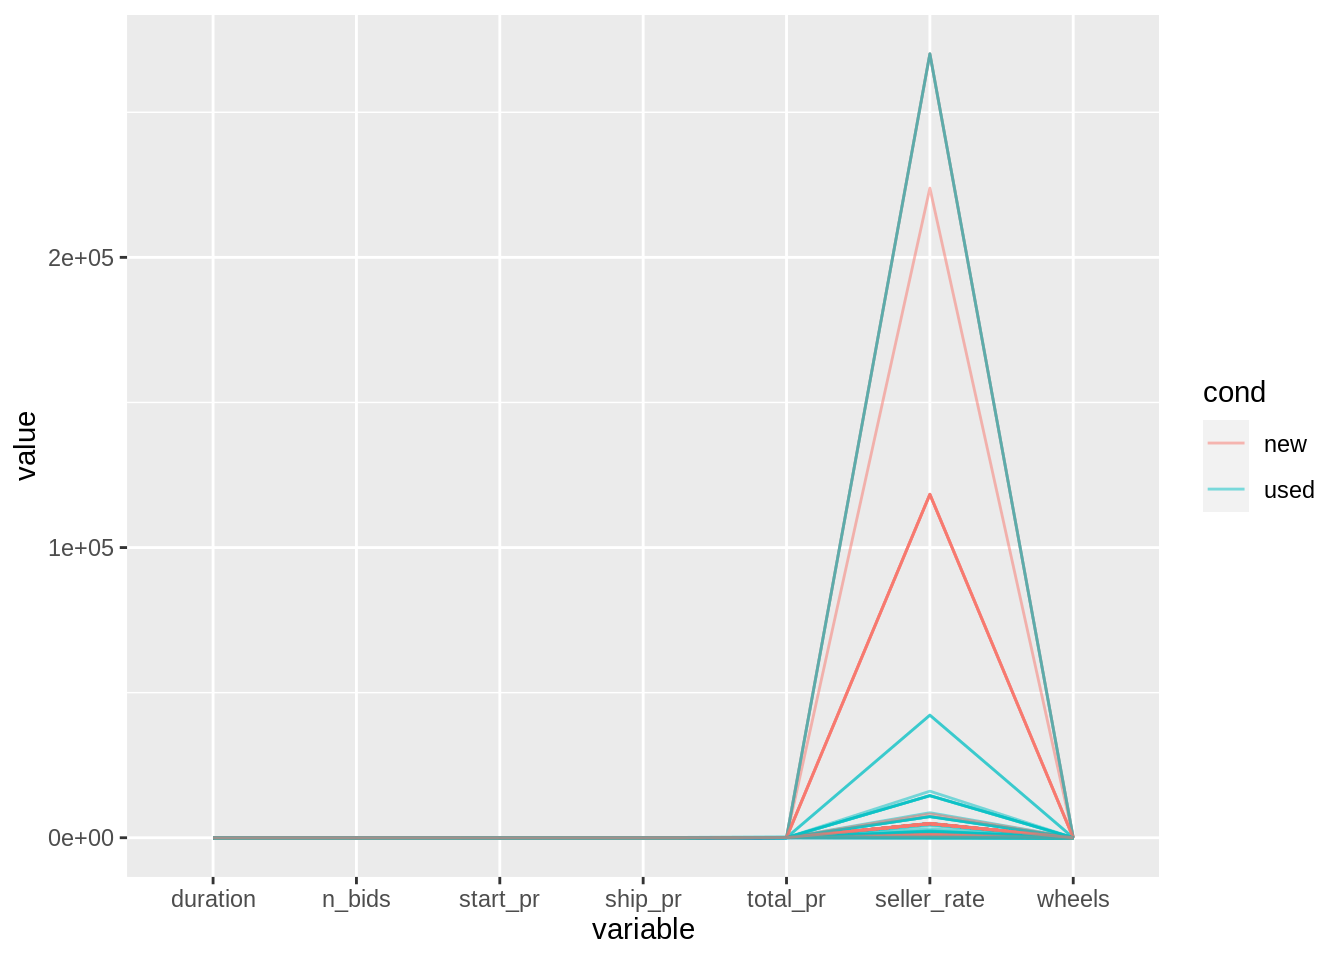
32.5.4 “center”
Scale using method “uniminmax”, and then center each variable at the summary statistic specified by the scaleSummary argument.
ggparcoord(data = df,
           column = c(2:3, 5:7, 9, 11),
           alphaLines = 0.5,
           groupColumn = "cond",
           scale = "center",
           scaleSummary = "mean")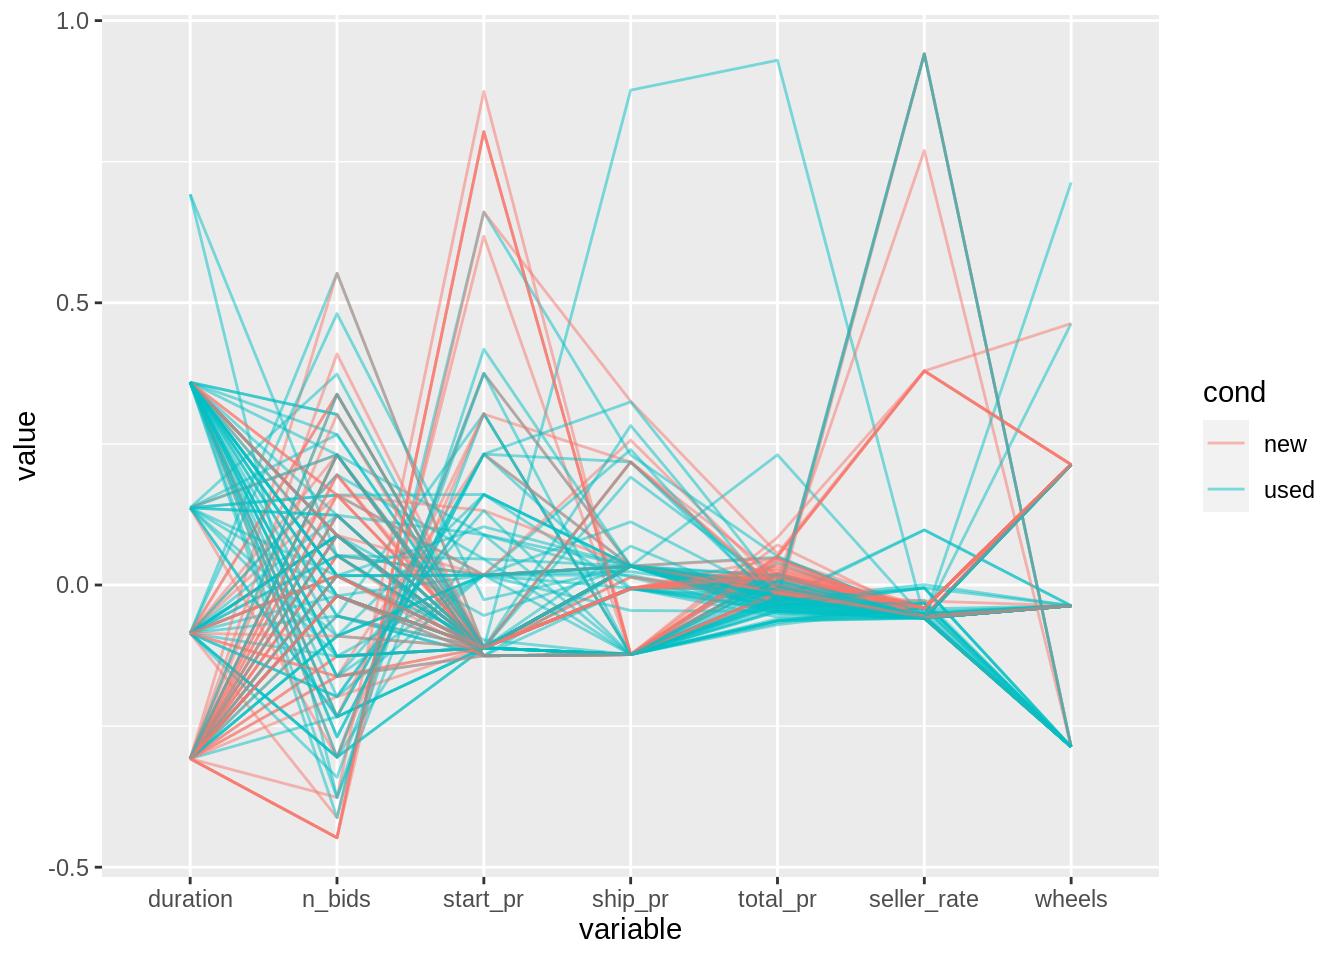
32.5.5 “centerObs”
Scale using method “uniminmax”, and then center each variable at the row number specified by the centerObsID argument.
ggparcoord(data = df,
           column = c(2:3, 5:7, 9, 11),
           alphaLines = 0.5,
           groupColumn = "cond",
           scale = "centerObs",
           centerObsID = 5)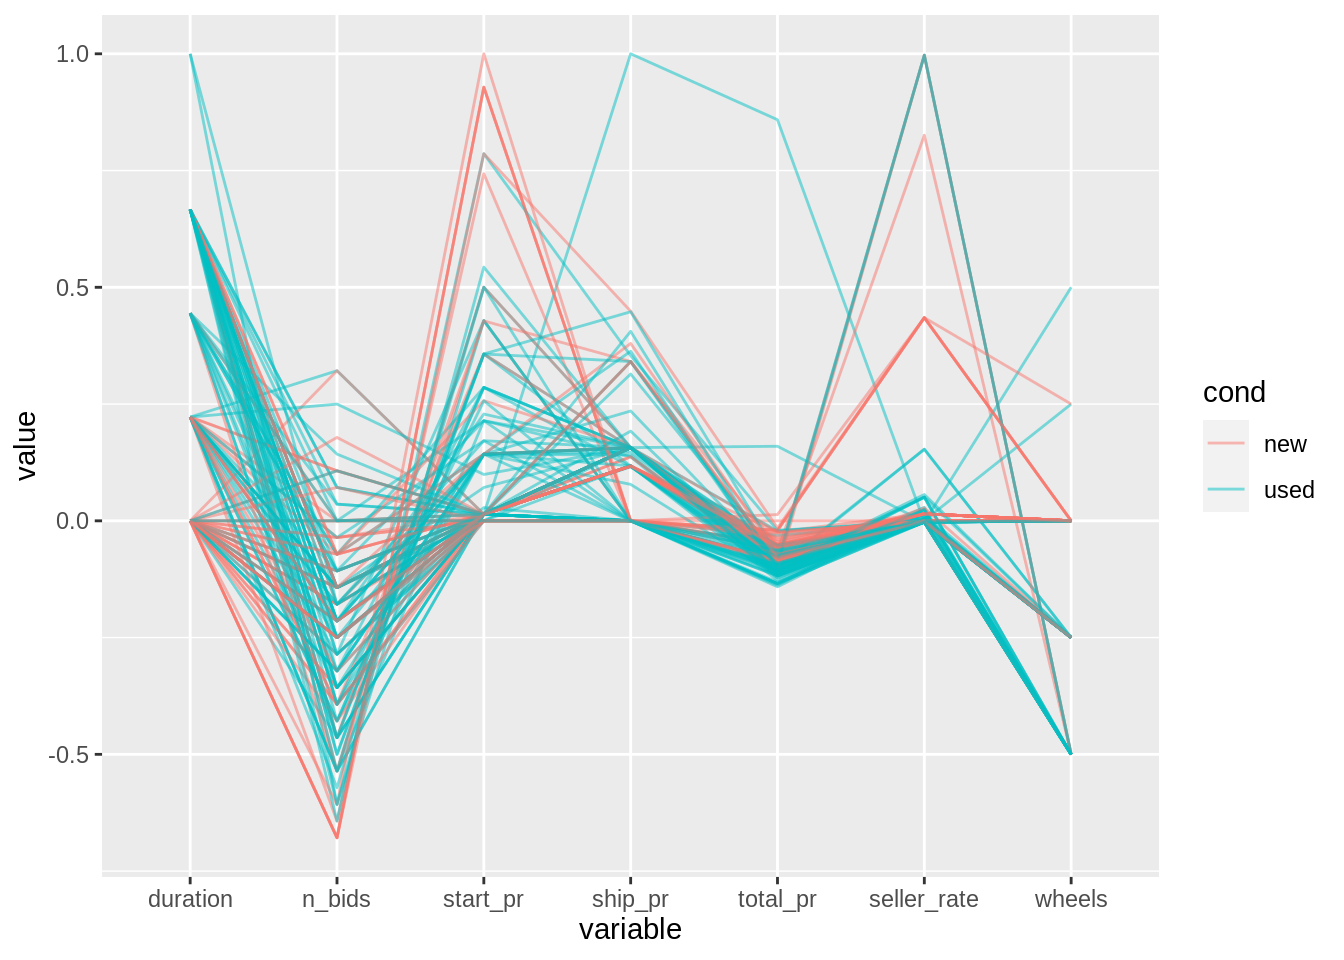
32.6 Ordering methods
32.6.1 “anyClass”
Calculate F-statistics for each class vs. the rest, order variables by their maximum F-statistics.
ggparcoord(data = df,
           column = c(2:3, 5:7, 9, 11),
           alphaLines = 0.5,
           groupColumn = "cond",
           order = "anyClass")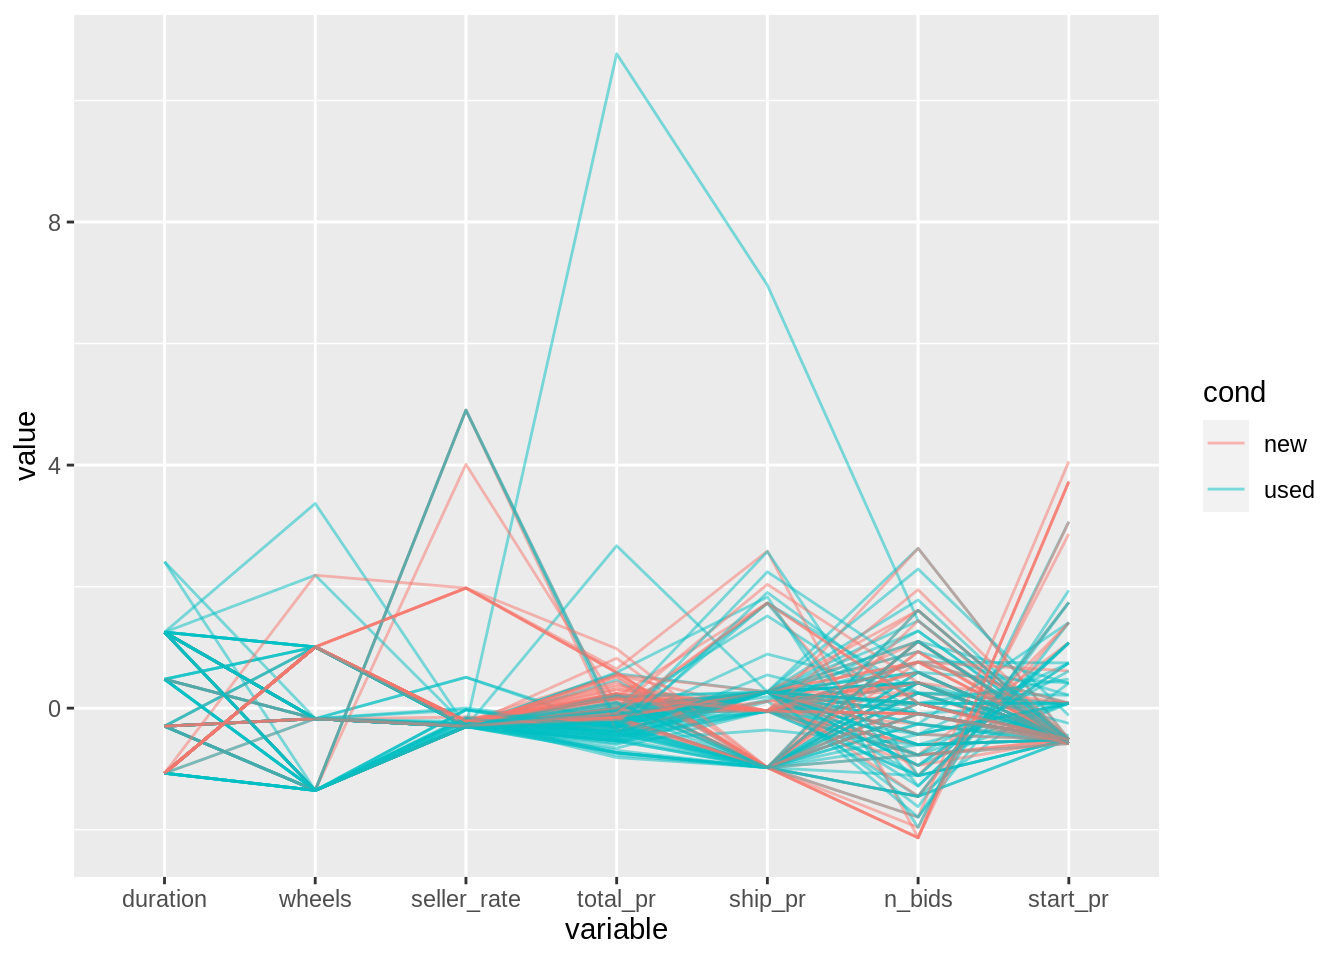
32.6.2 “allClass”
Order variables by their overall F-statistic from an ANOVA with groupColumn as the explanatory variable.
ggparcoord(data = df,
           column = c(2:3, 5:7, 9, 11),
           alphaLines = 0.5,
           groupColumn = "cond",
           order = "allClass")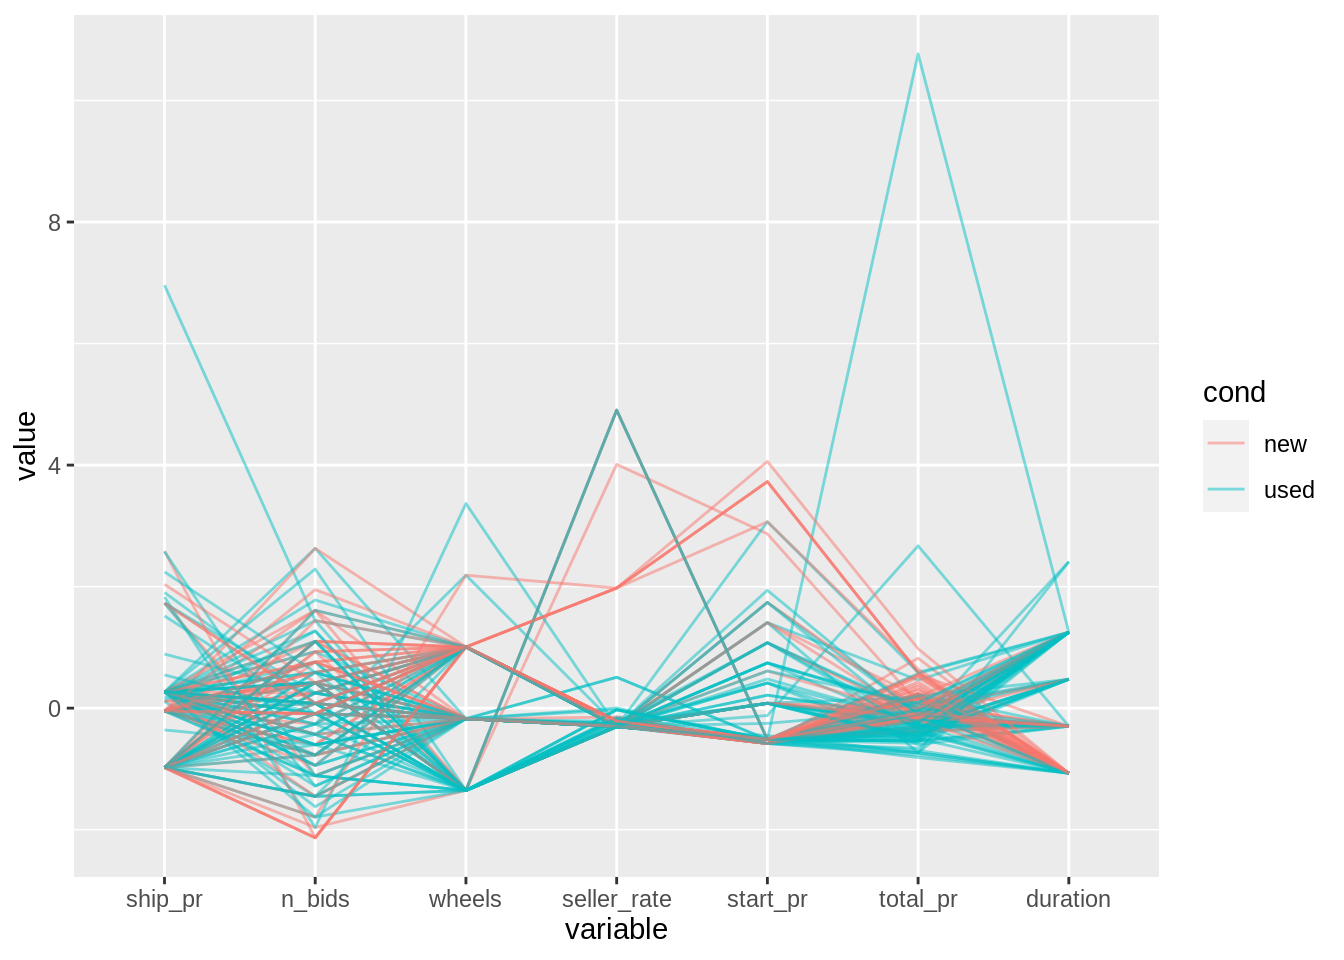
32.6.3 “skewness”
Order variables by their skewness.
ggparcoord(data = df,
           column = c(2:3, 5:7, 9, 11),
           alphaLines = 0.5,
           groupColumn = "cond",
           order = "skewness")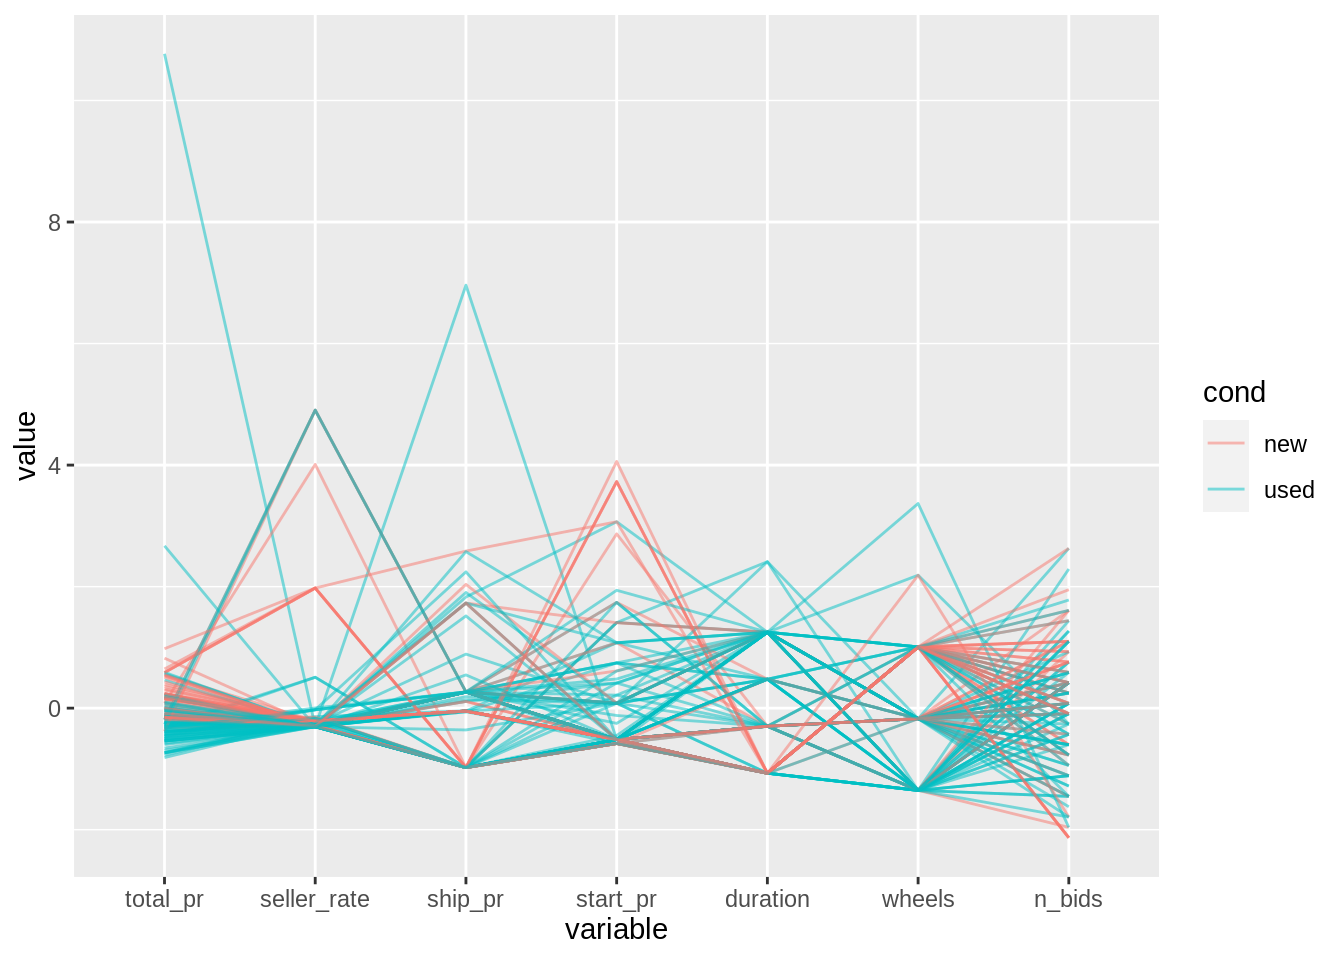
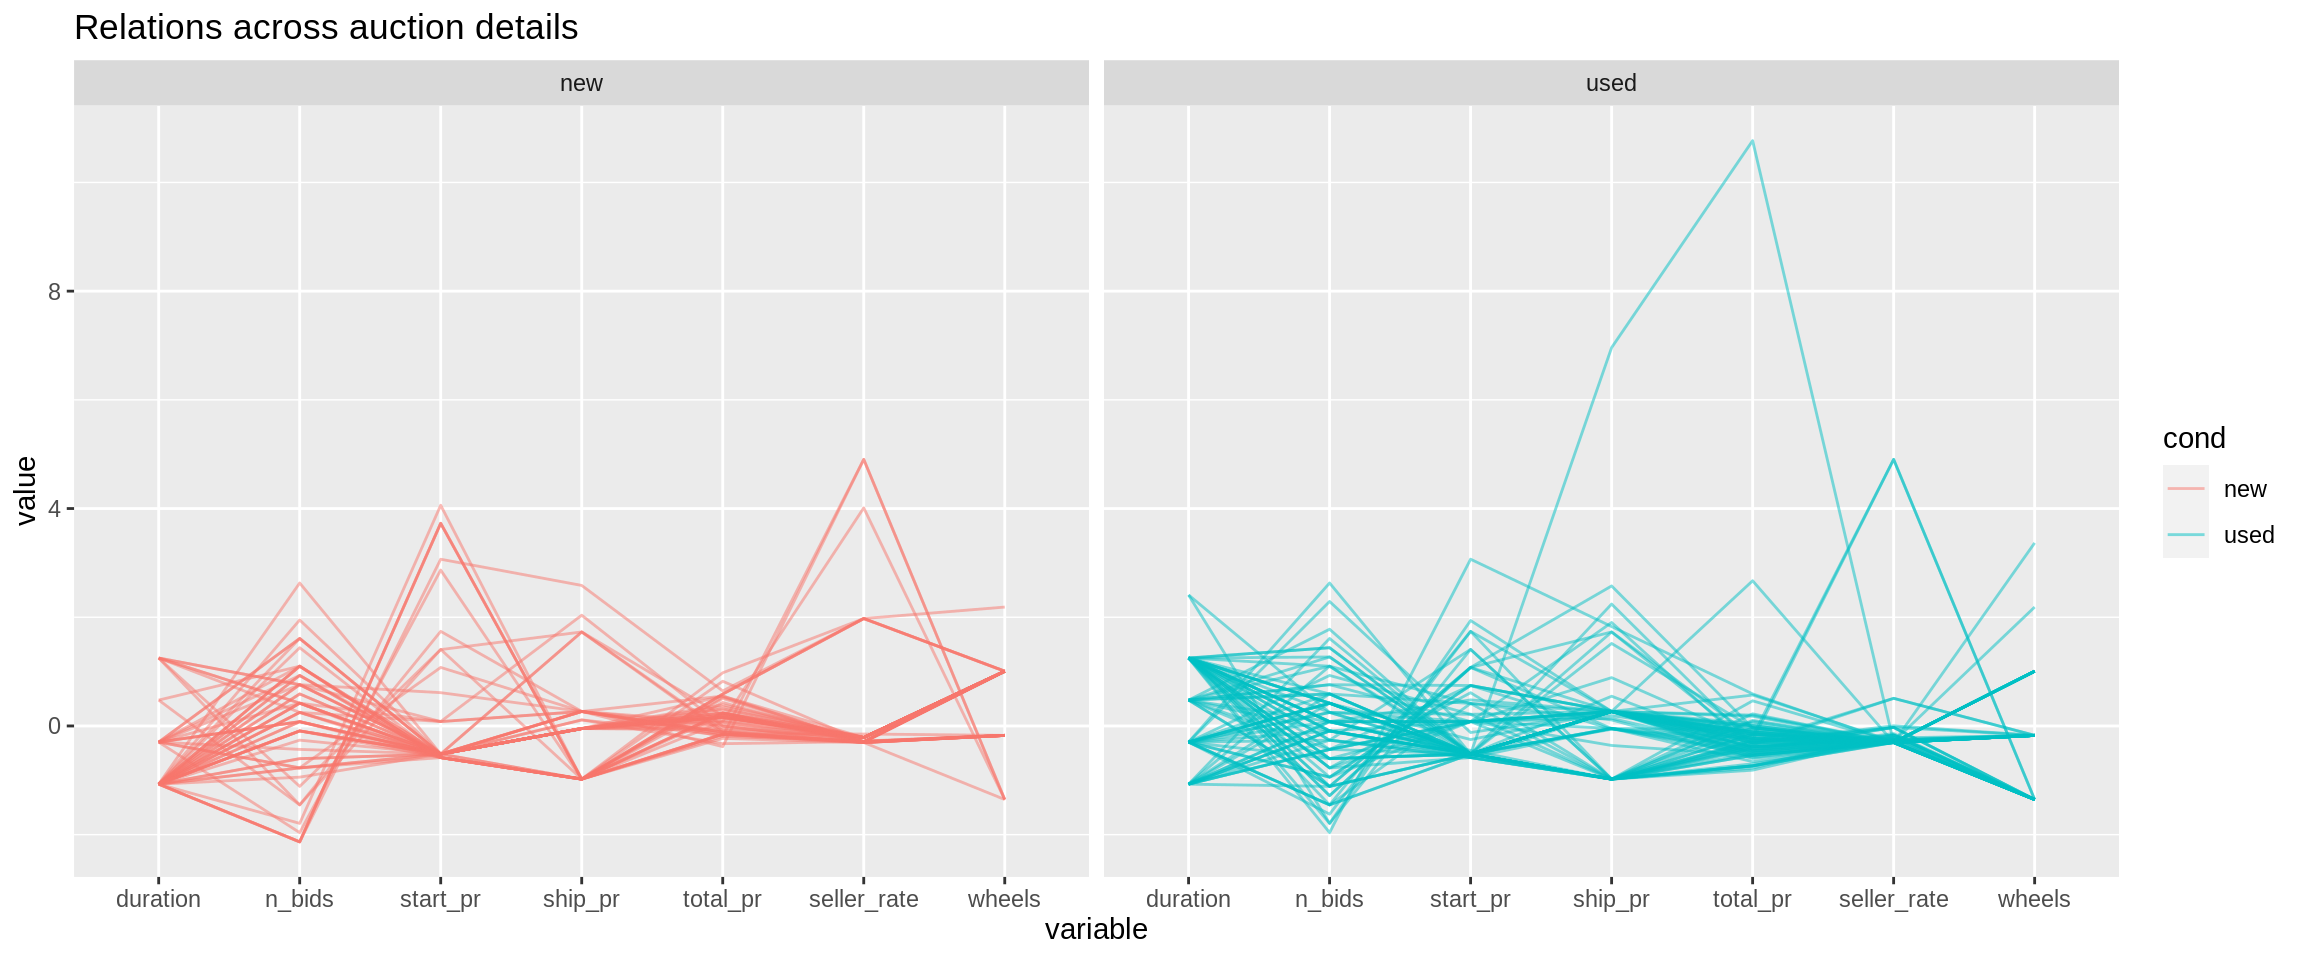
32.7 Make Plots for Each Group with Facets
ggparcoord(data = df,
           column = c(2:3, 5:7, 9, 11),
           alphaLines = 0.5,
           groupColumn = "cond") +
  facet_wrap(~ cond) +
  ggtitle("Relations across auction details")