6 Chart: Boxplot

6.1 tl;dr
I want a nice example and I want it NOW!
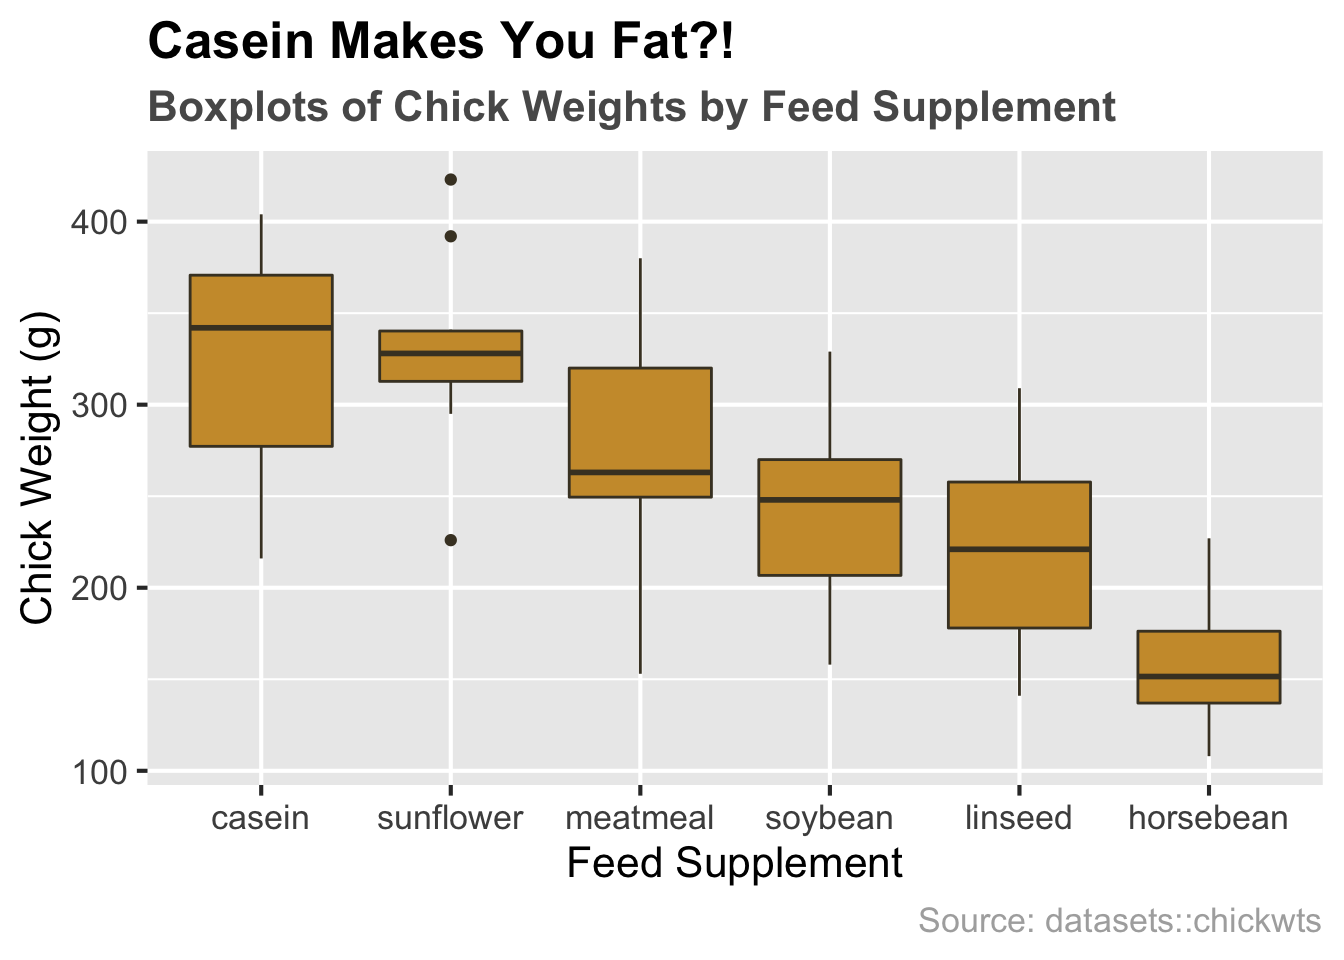
Here’s a look at the weights of newborn chicks split by the feed supplement they received:
And here’s the code:
library(ggplot2)

# boxplot by feed supplement
ggplot(chickwts, aes(x = reorder(feed, -weight, median), y = weight)) +
  # plotting
  geom_boxplot(fill = "#cc9a38", color = "#473e2c") +
  # formatting
  ggtitle("Casein Makes You Fat?!",
          subtitle = "Boxplots of Chick Weights by Feed Supplement") +
  labs(x = "Feed Supplement", y = "Chick Weight (g)", caption = "Source: datasets::chickwts") +
  theme_grey(16) +
  theme(plot.title = element_text(face = "bold")) +
  theme(plot.subtitle = element_text(face = "bold", color = "grey35")) +
  theme(plot.caption = element_text(color = "grey68"))
For more info on this dataset, type ?datasets::chickwts into the console.
6.2 Simple examples
Okay…much simpler please.
6.2.1 Single boxplots
Base R will give you a quick boxplot of a vector or a single column of a data frame with very little typing:
# vector
boxplot(rivers) 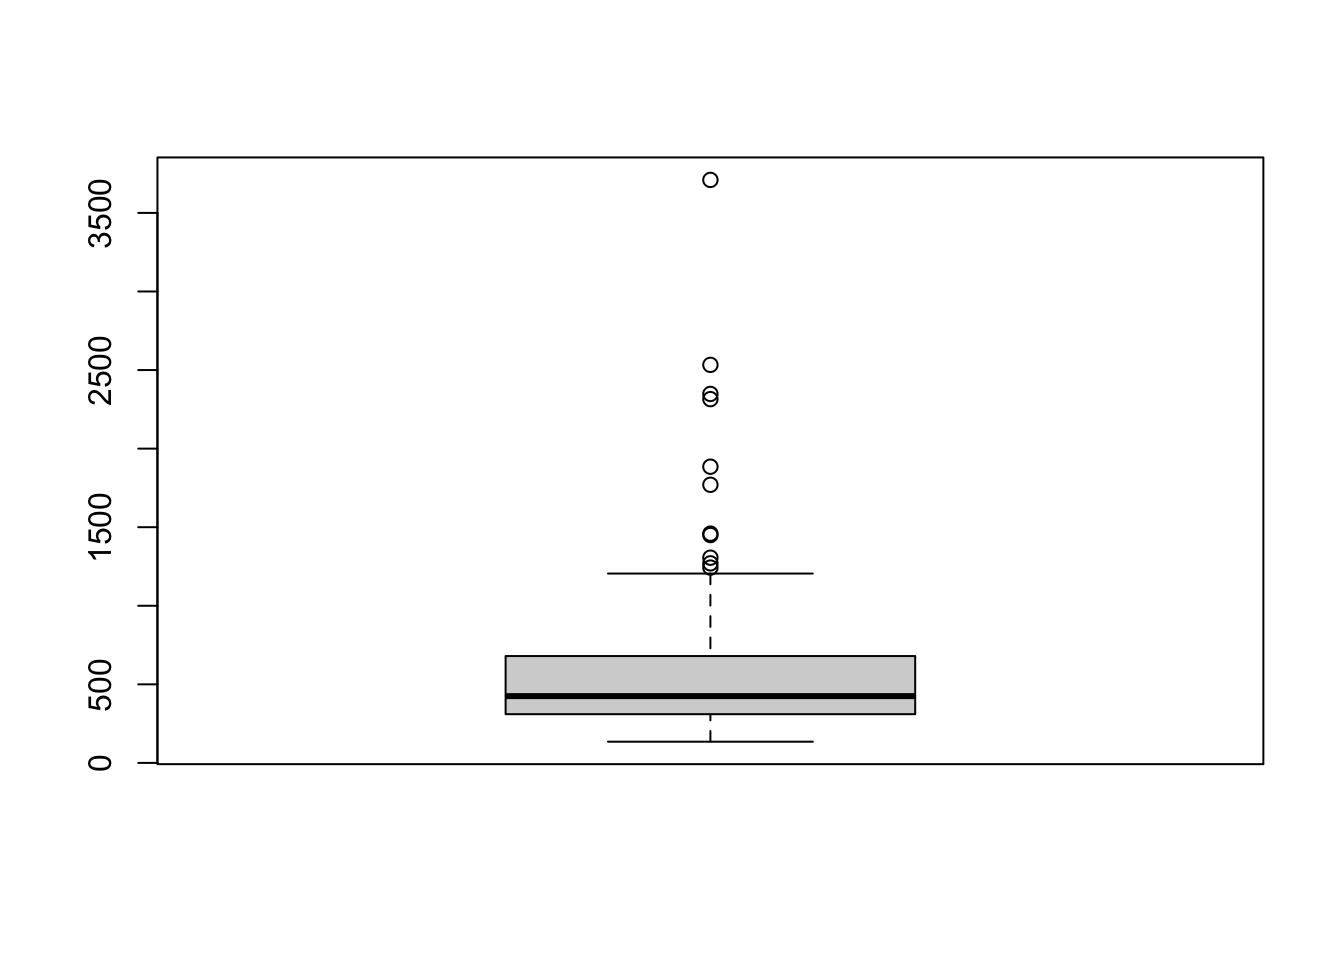
Or, the horizontal version:
# single column of a data frame
boxplot(chickwts$weight, horizontal = TRUE) 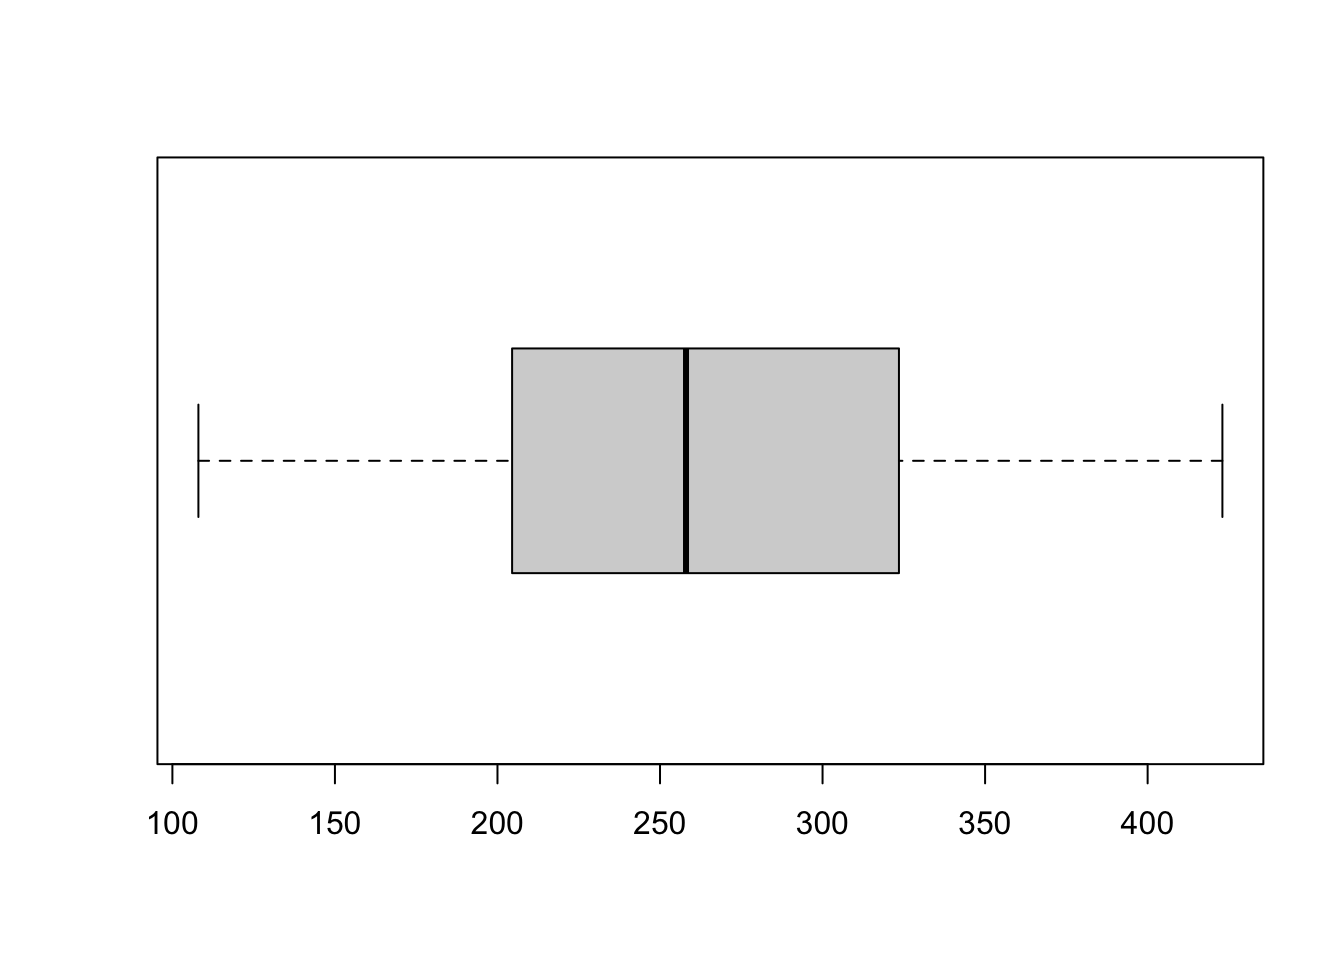
Creating a single boxplot in ggplot2 is somewhat problematic. (The joke is that it’s the package author’s way of saying that if you only have one group, make a histogram instead!)
If you only include one aesthetic mapping, it will be assumed to the x (group) variable and you will get an error:
ggplot(chickwts, aes(weight)) + geom_boxplot()Error: stat_boxplot requires the following missing aesthetics: yThis can be remedied by adding y = to indicate that weight is the numeric variable, but you’ll still get a meaningless x-axis:
ggplot(chickwts, aes(y = weight)) +
  geom_boxplot() +
  theme_grey(16) # make all font sizes larger (default is 11)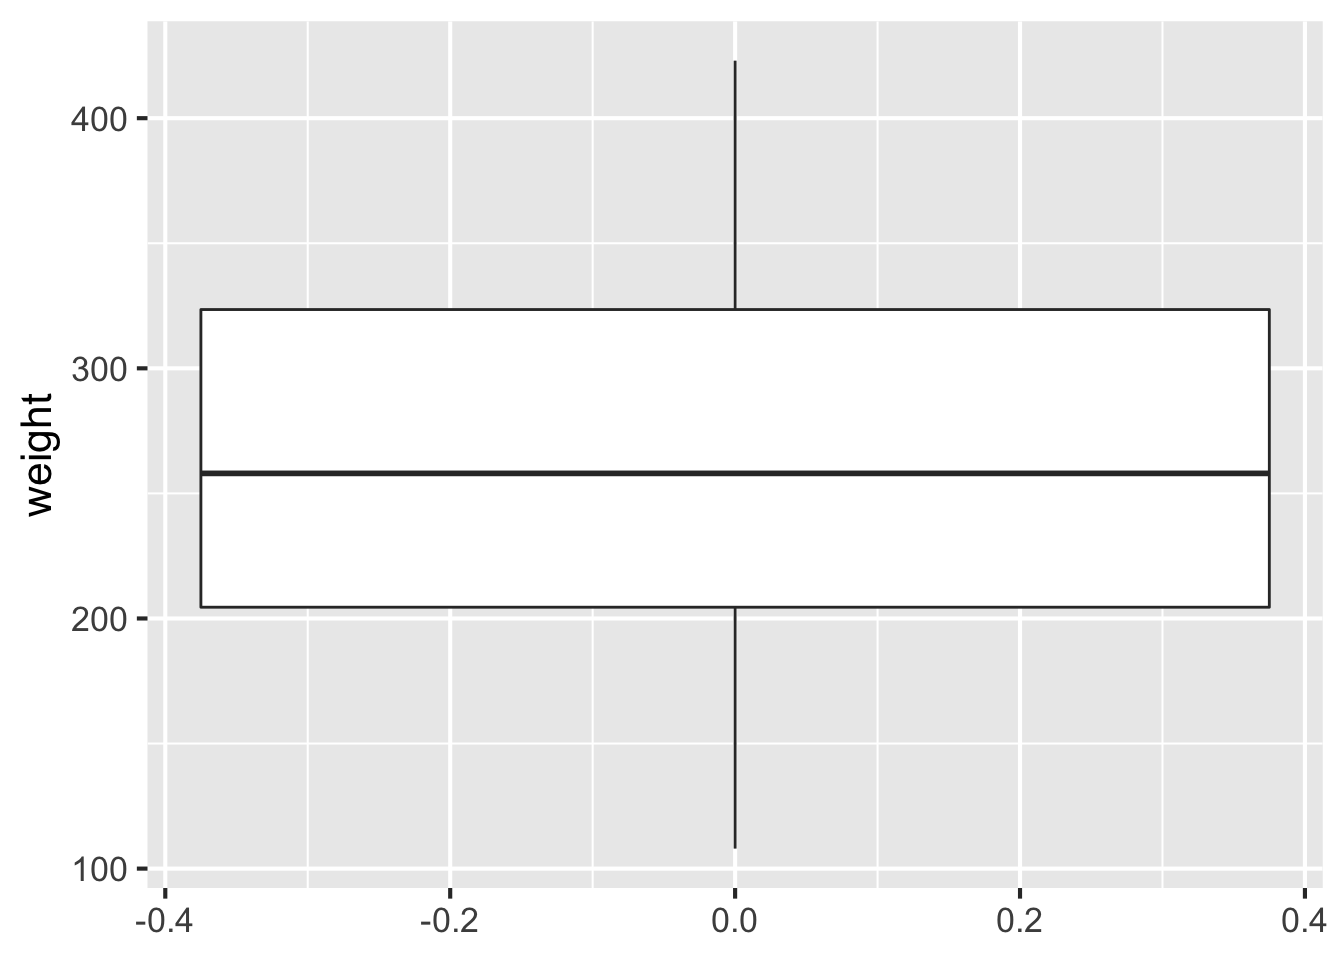
Another, cleaner approach is to create a name for the single group as the x aesthetic and remove the x-axis label:
ggplot(chickwts, aes(x = "all 71 chickens", y = weight)) +
  geom_boxplot() + xlab("") + theme_grey(16)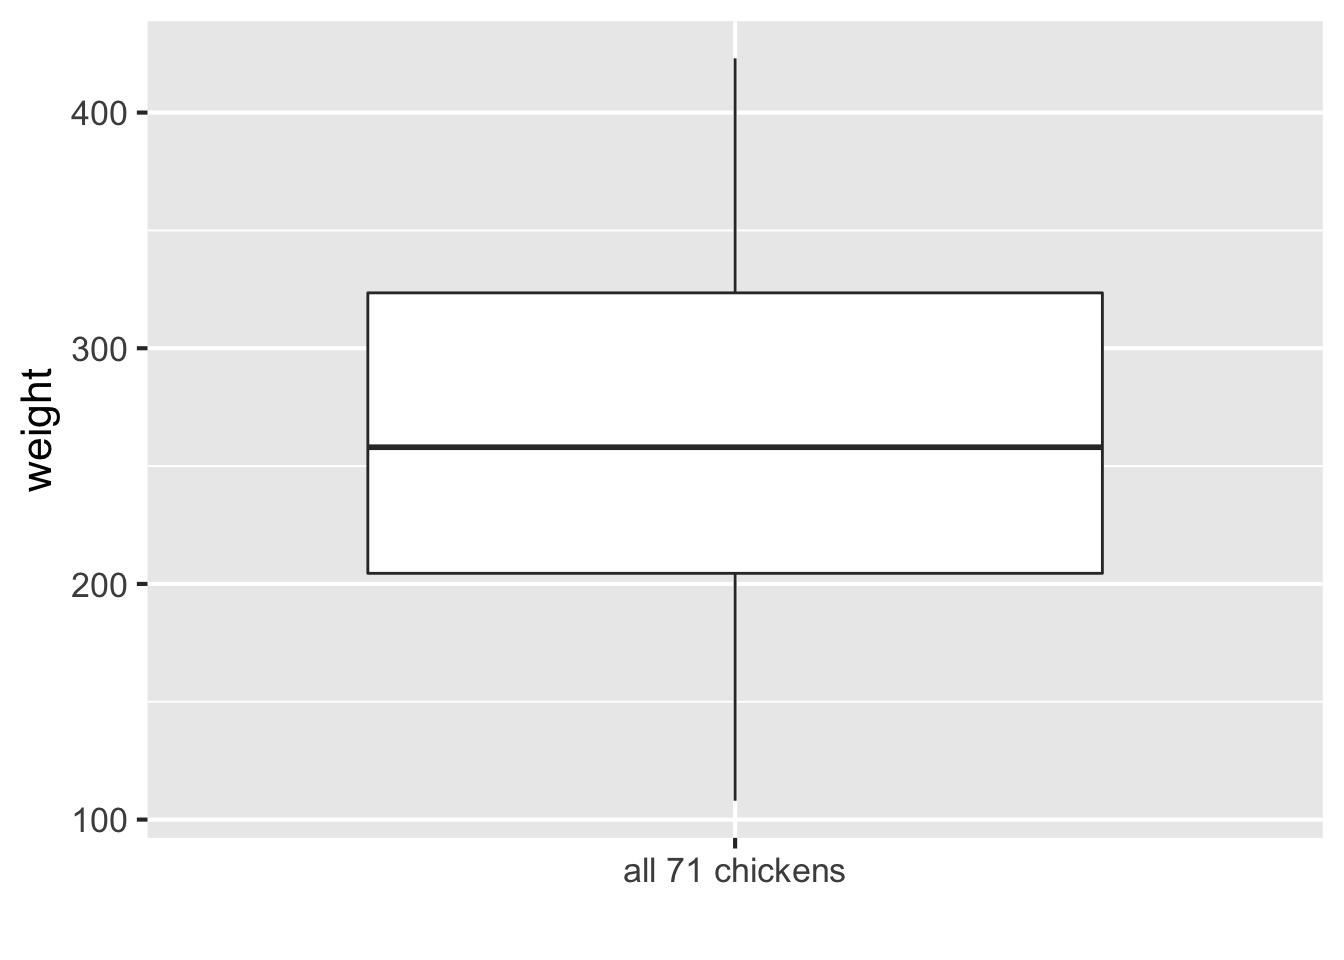
6.2.2 Multiple boxplots using ggplot2
To create multiple boxplots with ggplot2, your data frame needs to be tidy, that is you need to have a column with levels of the grouping variable. It can be be factor, character, or integer class.
str(chickwts)## 'data.frame': 71 obs. of 2 variables:
## $ weight: num 179 160 136 227 217 168 108 124 143 140 ...
## $ feed : Factor w/ 6 levels "casein","horsebean",..: 2 2 2 2 2 2 2 2 2 2 ...We see that chickwts is in the right form: we have a feed column with six factor levels, so we can set the the x aesthetic to feed. We also order the boxplots by decreasing median weight:
ggplot(chickwts, aes(x = reorder(feed, -weight, median), y = weight)) +
  geom_boxplot() +
  xlab("feed type") +
  theme_grey(16)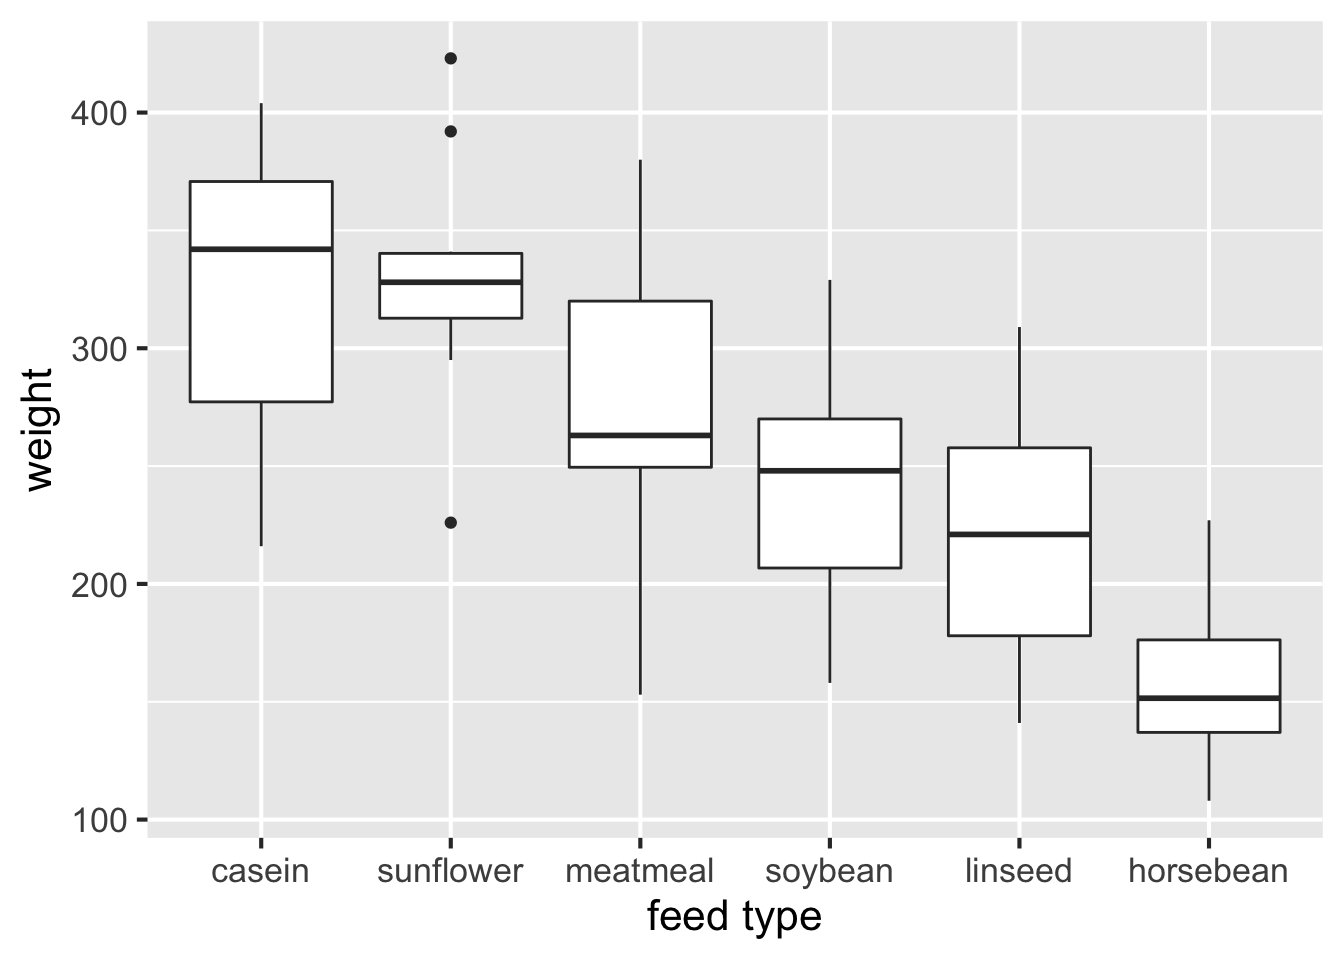
Data frames that contain a separate column of values for each desired boxplot must be tidied first. (For more detail on using tidy::gather(), see this tutorial.)
library(tidyverse)
head(attitude)
## rating complaints privileges learning raises critical advance
## 1 43 51 30 39 61 92 45
## 2 63 64 51 54 63 73 47
## 3 71 70 68 69 76 86 48
## 4 61 63 45 47 54 84 35
## 5 81 78 56 66 71 83 47
## 6 43 55 49 44 54 49 34tidyattitude <- attitude %>% gather(key = "question", value = "rating")
head(tidyattitude)## question rating
## 1 complaints 51
## 2 complaints 64
## 3 complaints 70
## 4 complaints 63
## 5 complaints 78
## 6 complaints 55Now we’re ready to plot:
ggplot(tidyattitude, aes(reorder(question, -rating, median), rating)) +
  geom_boxplot() +
  xlab("question short name") +
  theme_grey(16)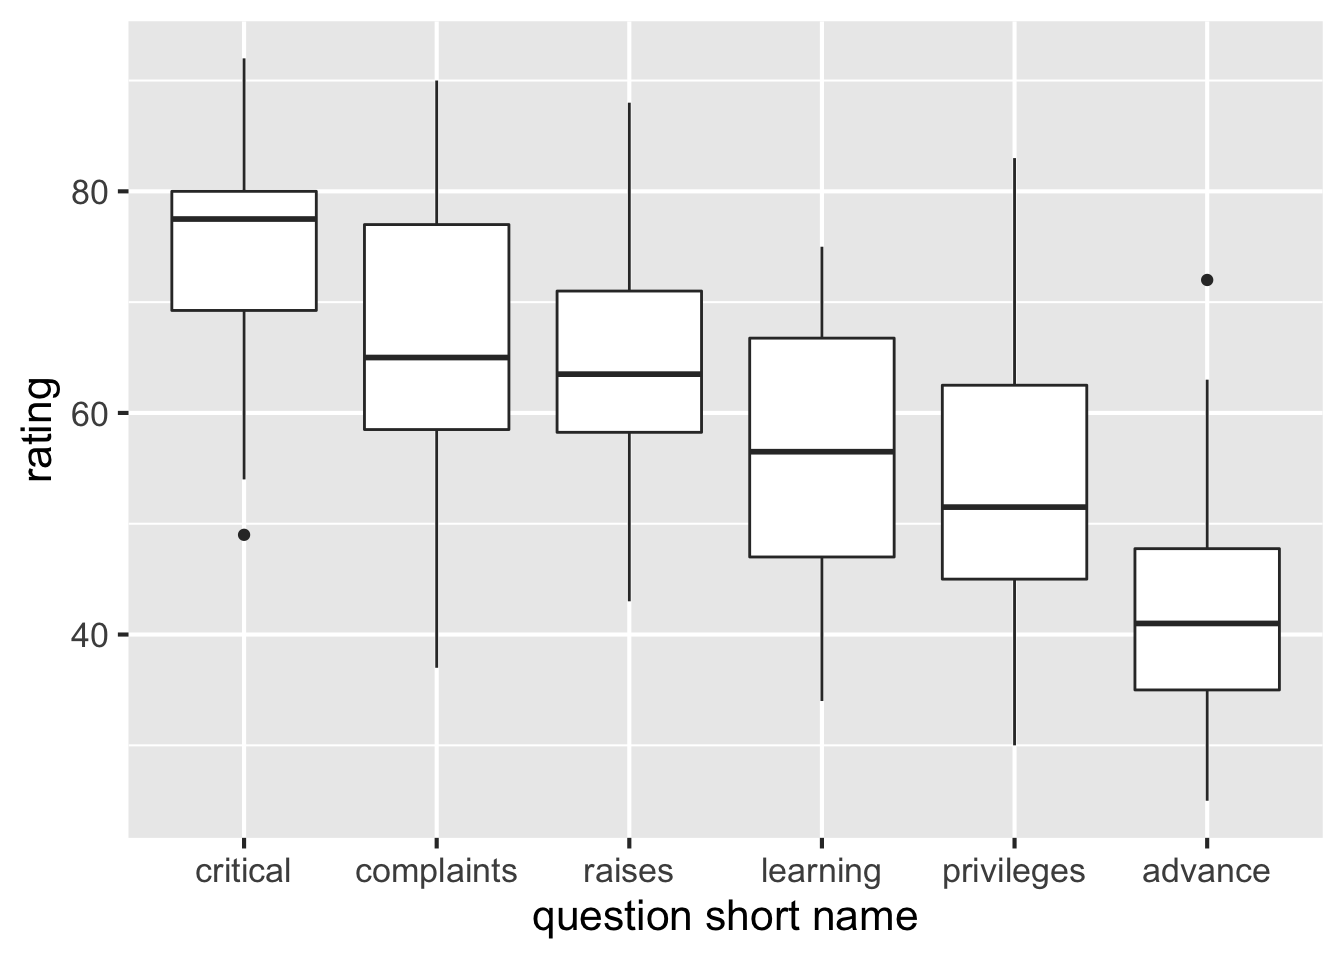
6.3 Theory
Here’s a quote by Hadley Wickham that sums up boxplots nicely:
The boxplot is a compact distributional summary, displaying less detail than a histogram or kernel density, but also taking up less space. Boxplots use robust summary statistics that are always located at actual data points, are quickly computable (originally by hand), and have no tuning parameters. They are particularly useful for comparing distributions across groups. - Hadley Wickham
Another important use of the boxplot is in showing outliers. A boxplot shows how much of an outlier a data point is with quartiles and fences. Use the boxplot when you have data with outliers so that they can be exposed. What it lacks in specificity it makes up with its ability to clearly summarize large data sets.
- For more info about boxplots and continuous variables, check out Chapter 3 of the textbook.
6.4 When to use
Boxplots should be used to display continuous variables. They are particularly useful for identifying outliers and comparing different groups.
Aside: Boxplots may even help you convince someone you are their outlier (If you like it when people over-explain jokes, here is why that comic is funny.).
6.5 Considerations
6.5.1 Flipping orientation
Often you want boxplots to be horizontal. Super easy to do in ggplot2: just tack on + coord_flip() and remove the - from the reordering so that the factor level with the highest median will be on top:
ggplot(tidyattitude, aes(reorder(question, rating, median), rating)) +
  geom_boxplot() +
  coord_flip() +
  xlab("question short name") +
  theme_grey(16)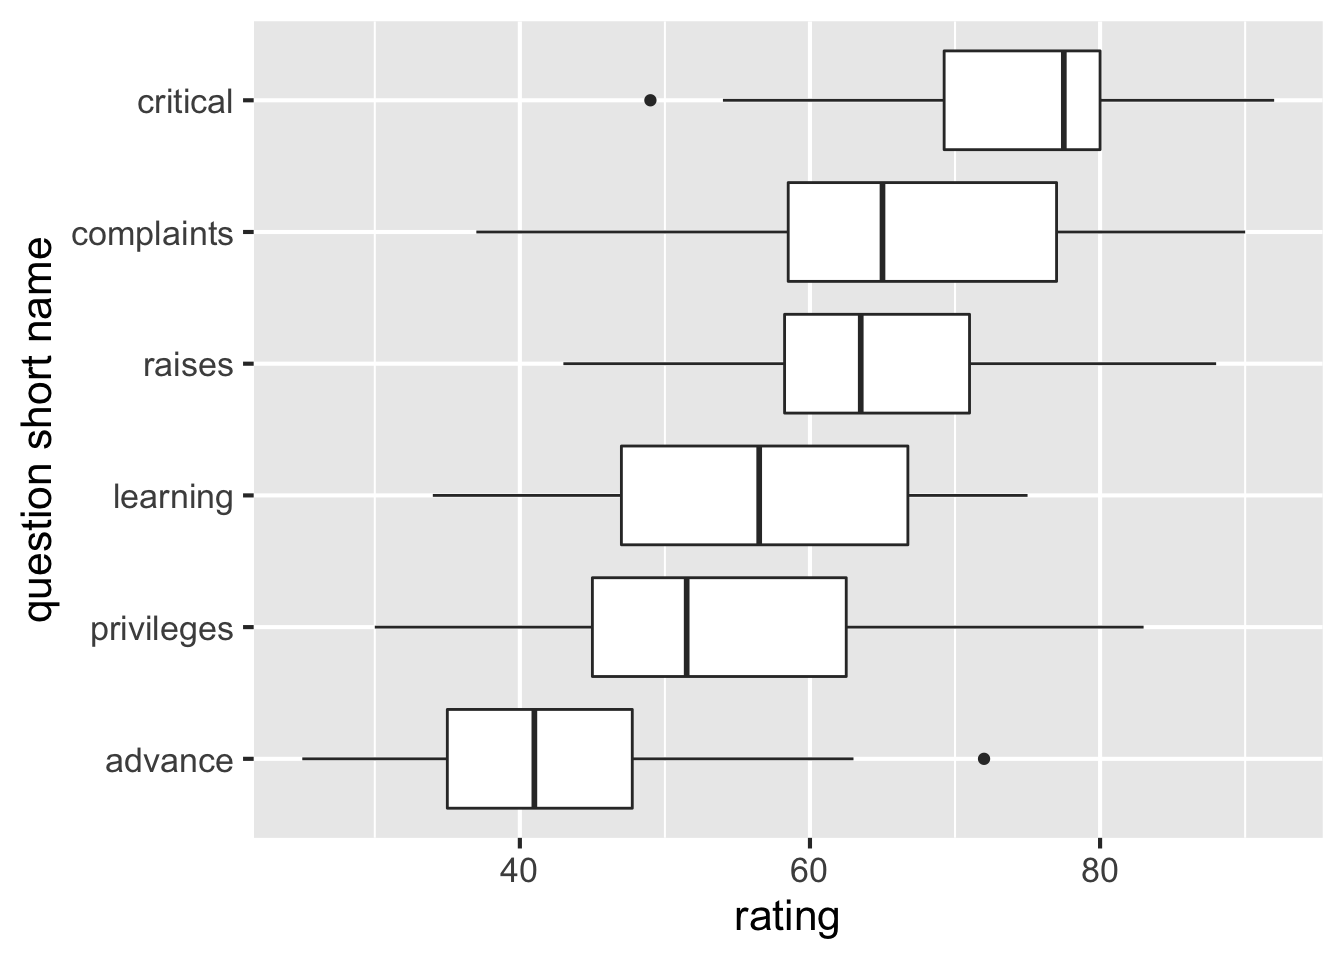
Note that switching x and y insteading of using coord_flip() doesn’t work!
ggplot(tidyattitude, aes(rating, reorder(question, rating, median))) +
  geom_boxplot() +
  ggtitle("This is not what we wanted!") +
  ylab("question short name") +
  theme_grey(16)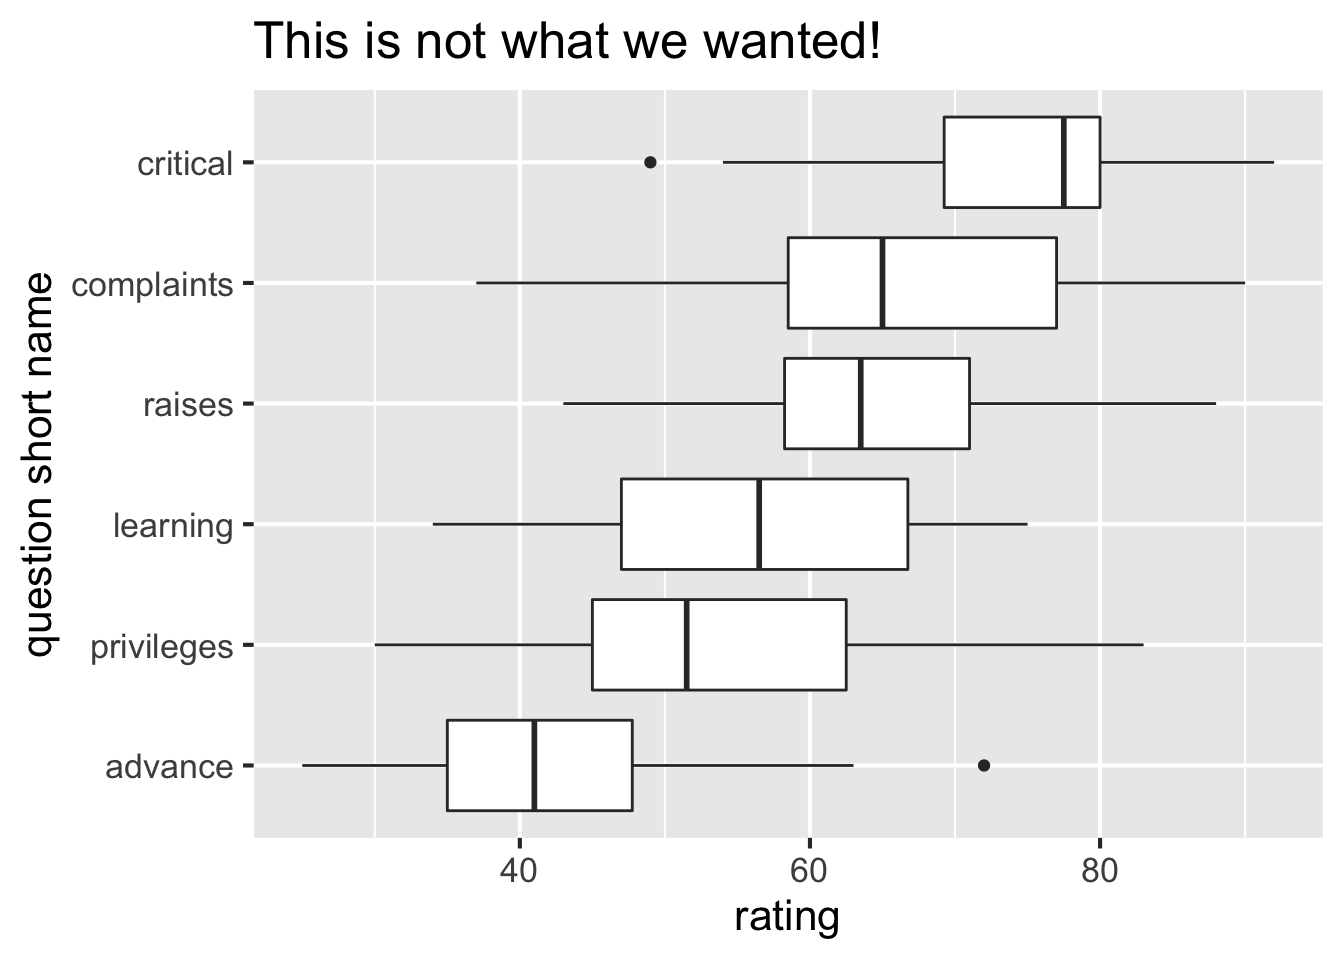
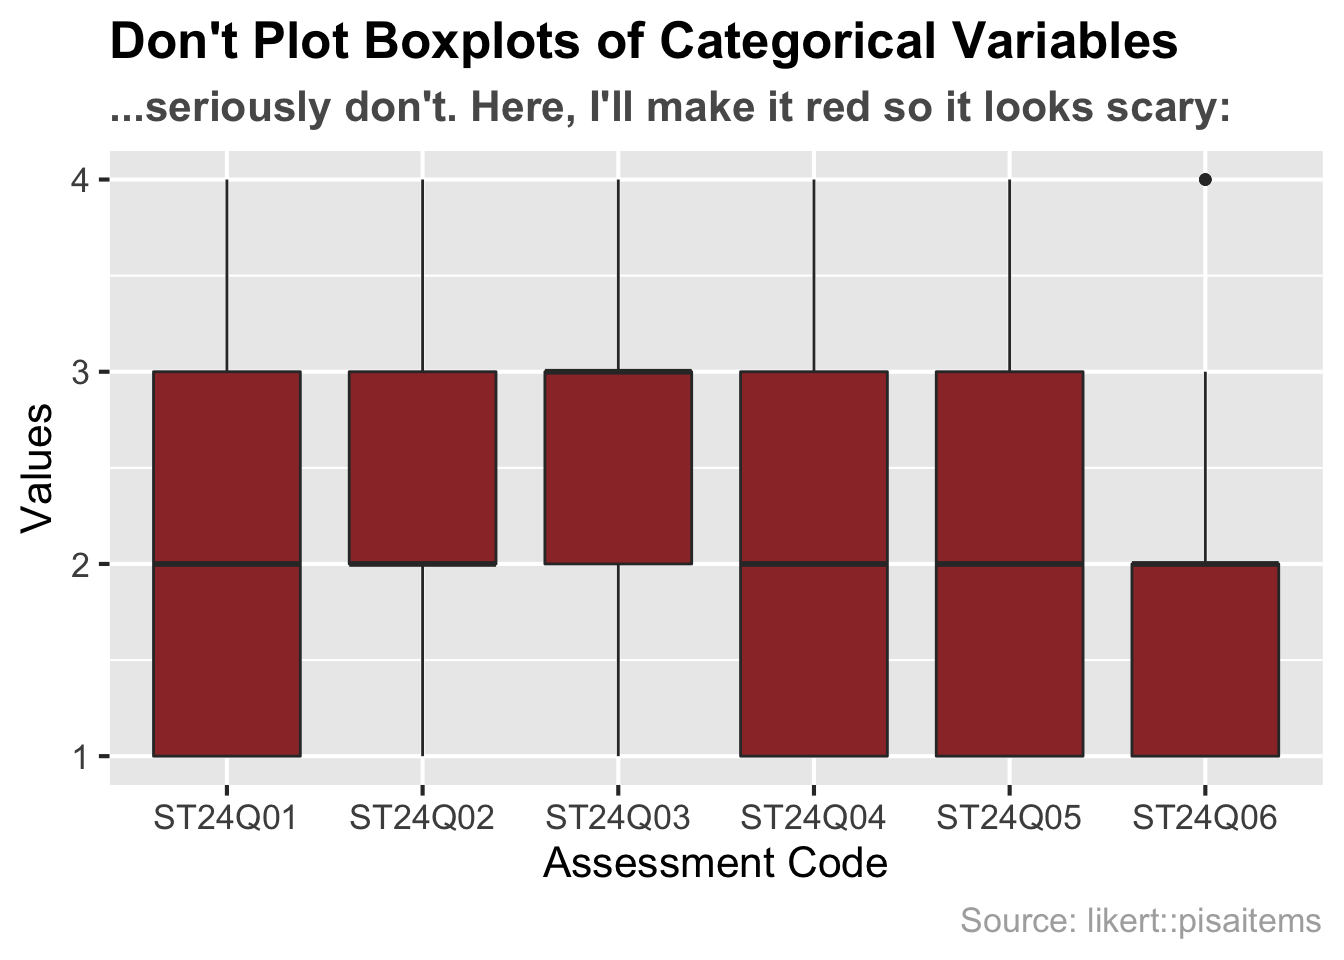
6.5.2 NOT for categorical data
Boxplots are great, but they do NOT work with categorical data. Make sure your variable is continuous before using boxplots.
The data in this example are variables from the pisaitems dataset in the likert package with ratings of 1, 2, 3 or 4:
head(pisa, 4)## ST24Q01 ST24Q02 ST24Q03 ST24Q04 ST24Q05 ST24Q06
## 1 2 4 4 1 4 1
## 2 3 1 1 4 1 3
## 3 4 1 1 3 1 4
## 4 2 2 3 1 2 2Creating a boxplot from this data is a good example of what not to do:
6.6 External resources
- Tukey, John W. 1977. Exploratory Data Analysis. Addison-Wesley. (Chapter 2): the primary source in which boxplots are first presented.
- Article on boxplots with ggplot2: An excellent collection of code examples on how to make boxplots with
ggplot2. Covers layering, working with legends, faceting, formatting, and more. If you want a boxplot to look a certain way, this article will help. - Boxplots with plotly package: boxplot examples using the
plotlypackage. These allow for a little interactivity on hover, which might better explain the underlying statistics of your plot. - ggplot2 Boxplot: Quick Start Guide: Article from STHDA on making boxplots using ggplot2. Excellent starting point for getting immediate results and custom formatting.
- ggplot2 cheatsheet: Always good to have close by.
- Hadley Wickhan and Lisa Stryjewski on boxplots: good for understanding basics of more complex boxplots and some of the history behind them.
with