20 Stock data with tidyquant
 This chapter originated as a community contribution created by naotominakawa
This page is a work in progress. We appreciate any input you may have. If you would like to help improve this page, consider contributing to our repo.
20.1 Overview
This section covers how to use the tidyquant package to conduct timeseries analysis.
20.2 What is tidyquant?
tidyquant is an one-stop shop for financial analysis. It is suitable for analyzing timeseries data, such as financial and economic data. tidyquant connects to various data sources such as Yahoo! Finance, Morning Star, Bloomberg market data, etc. It also behaves well with other Tidyverse packages.
20.3 Installing tidyquant
You can install tidyquant from CRAN:
install.packages("tidyquant")If you want to see which functions are available, you can run the following:
# to see which functions are available (not run)
library(tidyquant)
tq_transmute_fun_options()
20.4 Single timeseries
Obtain historical data for single stock (for example, Google):
# get historical data for single stock. e.g. google
library(tidyquant)
tq_get("GOOGL", get="stock.prices")
## # A tibble: 2,536 × 8
## symbol date open high low close volume adjusted
## <chr> <date> <dbl> <dbl> <dbl> <dbl> <dbl> <dbl>
## 1 GOOGL 2012-01-03 327. 334. 327. 333. 7345647 333.
## 2 GOOGL 2012-01-04 333. 335. 331. 334. 5722272 334.
## 3 GOOGL 2012-01-05 331. 332. 328. 330. 6559234 330.
## 4 GOOGL 2012-01-06 330. 330. 325. 325. 5380414 325.
## 5 GOOGL 2012-01-09 324. 324. 311. 312. 11633555 312.
## 6 GOOGL 2012-01-10 315. 317. 309. 312. 8782409 312.
## 7 GOOGL 2012-01-11 312. 315. 311. 313. 4795200 313.
## 8 GOOGL 2012-01-12 316. 317. 314. 315. 3746650 315.
## 9 GOOGL 2012-01-13 313. 314. 311. 313. 4609985 313.
## 10 GOOGL 2012-01-17 316. 316. 313. 315. 3814781 315.
## # … with 2,526 more rowsCalculate monthly return of single stock:
library(dplyr)
# calculate monthly return of single stock
tq_get(c("GOOGL"), get="stock.prices") %>%
  tq_transmute(select=adjusted,
               mutate_fun=periodReturn,
               period="monthly",
               col_rename = "monthly_return")
## # A tibble: 121 × 2
## date monthly_return
## <date> <dbl>
## 1 2012-01-31 -0.128
## 2 2012-02-29 0.0657
## 3 2012-03-30 0.0372
## 4 2012-04-30 -0.0567
## 5 2012-05-31 -0.0397
## 6 2012-06-29 -0.00136
## 7 2012-07-31 0.0912
## 8 2012-08-31 0.0823
## 9 2012-09-28 0.101
## 10 2012-10-31 -0.0983
## # … with 111 more rowsCreate a line chart of the closing price for single stock:
# showing closing price for single stock
library(ggplot2)
tq_get(c("GOOGL"), get="stock.prices") %>%
  ggplot(aes(date, close)) +
  geom_line()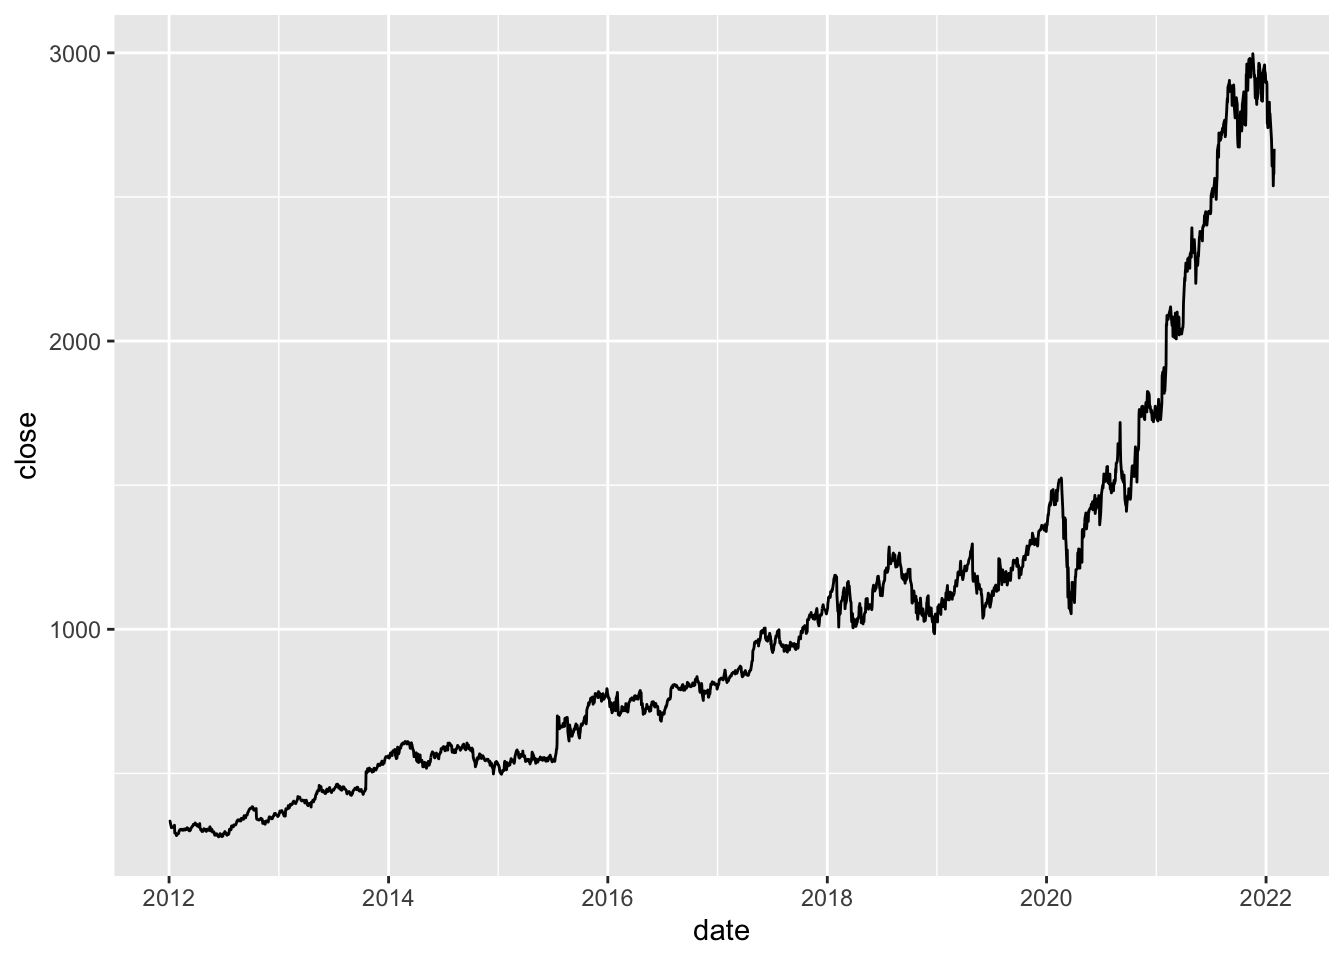
Create a line chart of the monthly return for single stock:
# showing monthly return for single stock
tq_get(c("GOOGL"), get="stock.prices") %>%
  tq_transmute(select=adjusted,
               mutate_fun=periodReturn,
               period="monthly",
               col_rename = "monthly_return") %>%
  ggplot(aes(date, monthly_return)) +
  geom_line()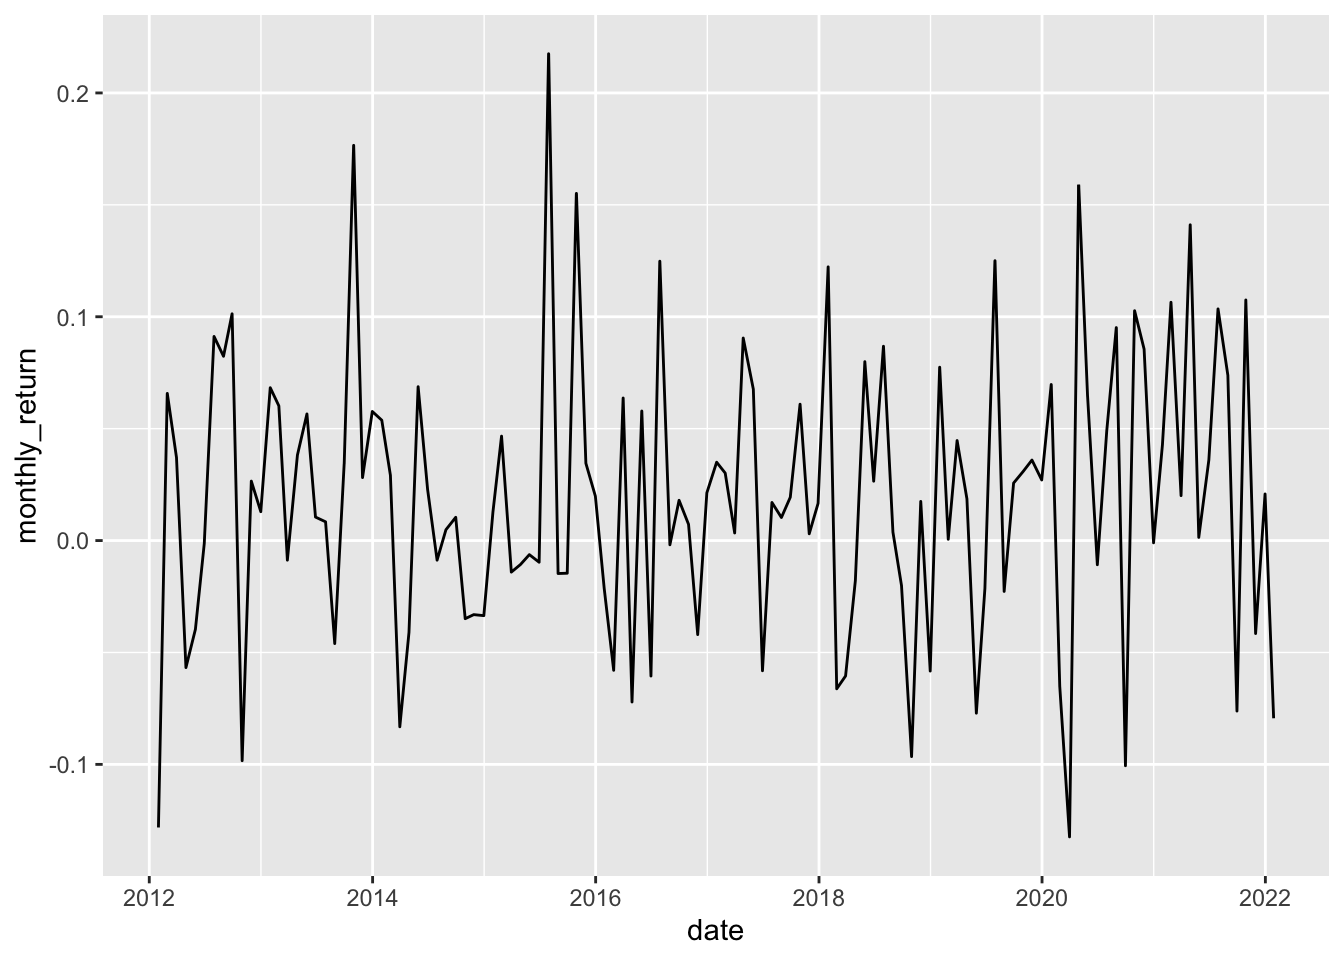
20.5 Multiple timeseries
Obtain historical data for multiple stocks (for example, GAFA):
# get historical data for multiple stocks. e.g. GAFA
tq_get(c("GOOGL","AMZN","FB","AAPL"), get="stock.prices")
## # A tibble: 10,049 × 8
## symbol date open high low close volume adjusted
## <chr> <date> <dbl> <dbl> <dbl> <dbl> <dbl> <dbl>
## 1 GOOGL 2012-01-03 327. 334. 327. 333. 7345647 333.
## 2 GOOGL 2012-01-04 333. 335. 331. 334. 5722272 334.
## 3 GOOGL 2012-01-05 331. 332. 328. 330. 6559234 330.
## 4 GOOGL 2012-01-06 330. 330. 325. 325. 5380414 325.
## 5 GOOGL 2012-01-09 324. 324. 311. 312. 11633555 312.
## 6 GOOGL 2012-01-10 315. 317. 309. 312. 8782409 312.
## 7 GOOGL 2012-01-11 312. 315. 311. 313. 4795200 313.
## 8 GOOGL 2012-01-12 316. 317. 314. 315. 3746650 315.
## 9 GOOGL 2012-01-13 313. 314. 311. 313. 4609985 313.
## 10 GOOGL 2012-01-17 316. 316. 313. 315. 3814781 315.
## # … with 10,039 more rowsCreate a multiple line chart of the closing prices of multiple stocks (again, GAFA). We can show each stock in a different color on the same graph:
# Create a multiple line chart of the closing prices of the four stocks,
# showing each stock in a different color on the same graph.
tq_get(c("GOOGL","AMZN","FB","AAPL"), get="stock.prices") %>%
  ggplot(aes(date, close, color=symbol)) +
  geom_line()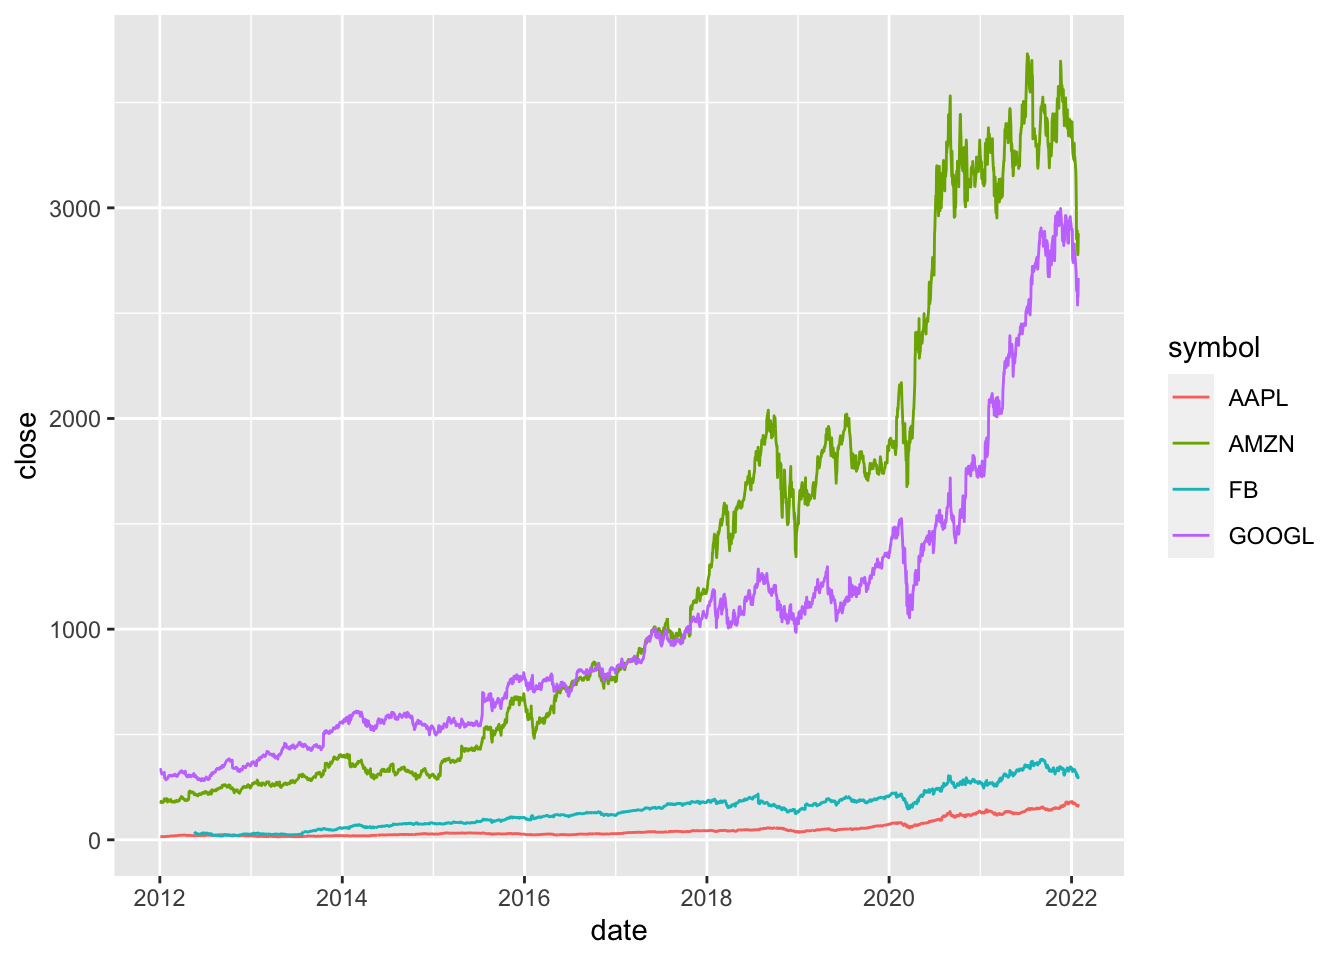
Transform the data so each stock begins at 100 and replot (Standardize the data so that we can compare timeseries):
# Create a multiple line chart of the closing prices of the four stocks,
# showing each stock in a different color on the same graph.
# Transform the data so each stock begins at 100 and replot.
tq_get(c("GOOGL","AMZN","FB","AAPL"), get="stock.prices") %>%
  group_by(symbol) %>%
  mutate(close = 100*close/first(close)) %>%
  ggplot(aes(date, close, color=symbol)) +
  geom_line()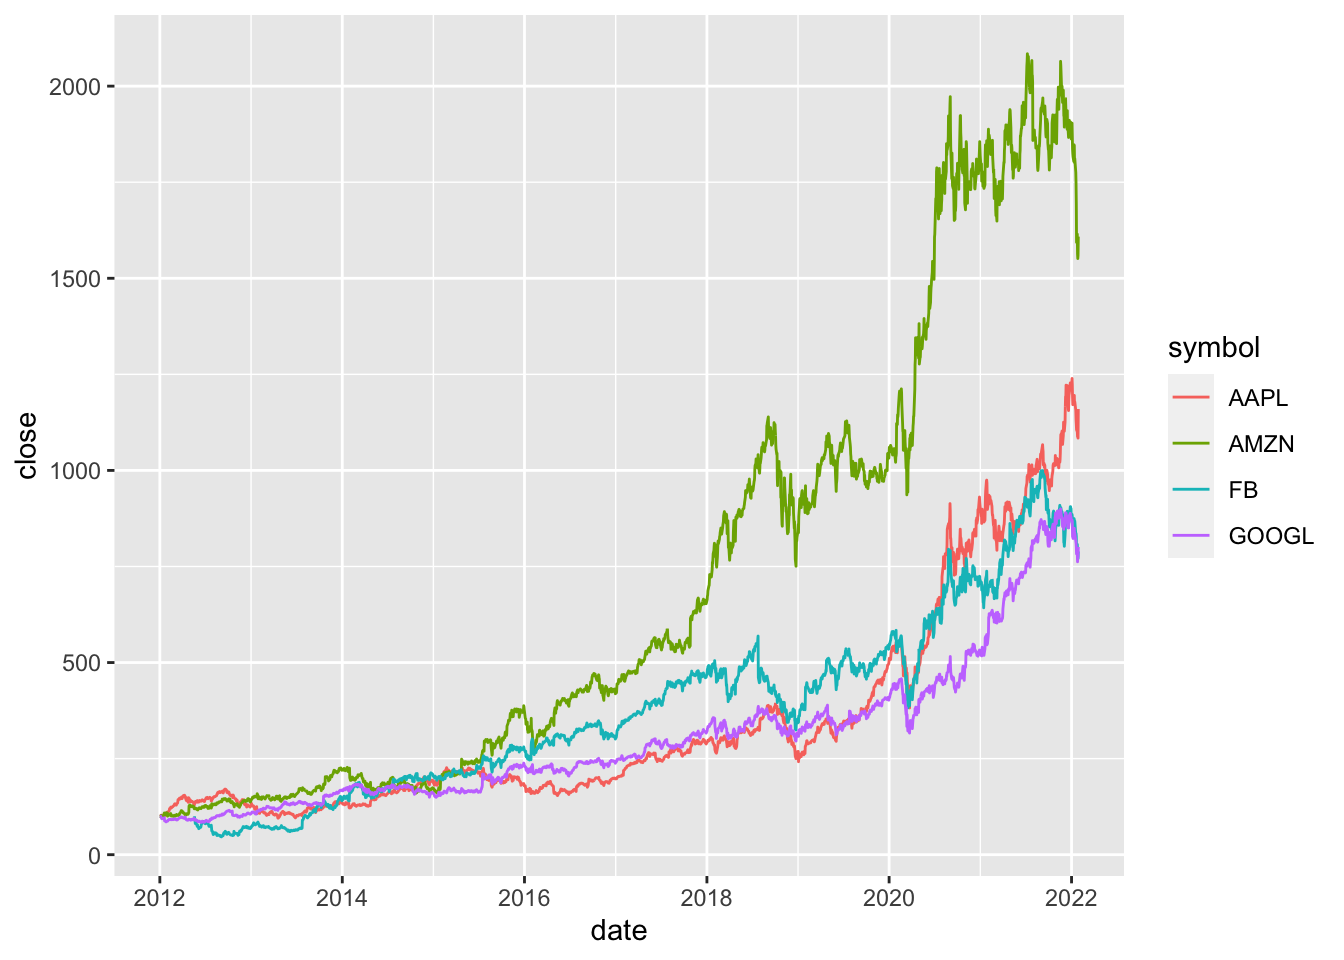
Calculate monthly return of multiple stocks (again, GAFA):
# calculate monthly return of multiple stocks
tq_get(c("GOOGL","AMZN","FB","AAPL"), get="stock.prices") %>%
  group_by(symbol) %>%
  tq_transmute(select=adjusted,
               mutate_fun=periodReturn,
               period="monthly",
               col_rename = "monthly_return")
## # A tibble: 480 × 3
## # Groups: symbol [4]
## symbol date monthly_return
## <chr> <date> <dbl>
## 1 GOOGL 2012-01-31 -0.128
## 2 GOOGL 2012-02-29 0.0657
## 3 GOOGL 2012-03-30 0.0372
## 4 GOOGL 2012-04-30 -0.0567
## 5 GOOGL 2012-05-31 -0.0397
## 6 GOOGL 2012-06-29 -0.00136
## 7 GOOGL 2012-07-31 0.0912
## 8 GOOGL 2012-08-31 0.0823
## 9 GOOGL 2012-09-28 0.101
## 10 GOOGL 2012-10-31 -0.0983
## # … with 470 more rowsCreate a multiple line chart of monthly return of the four stocks. Again, we can show each stock in a different color on the same graph:
# Create a multiple line chart of monthly return of the four stocks,
# showing each stock in a different color on the same graph
tq_get(c("GOOGL","AMZN","FB","AAPL"), get="stock.prices") %>%
  group_by(symbol) %>%
  tq_transmute(select=adjusted,
               mutate_fun=periodReturn,
               period="monthly",
               col_rename = "monthly_return") %>%
  ggplot(aes(date, monthly_return, color=symbol)) +
  geom_line()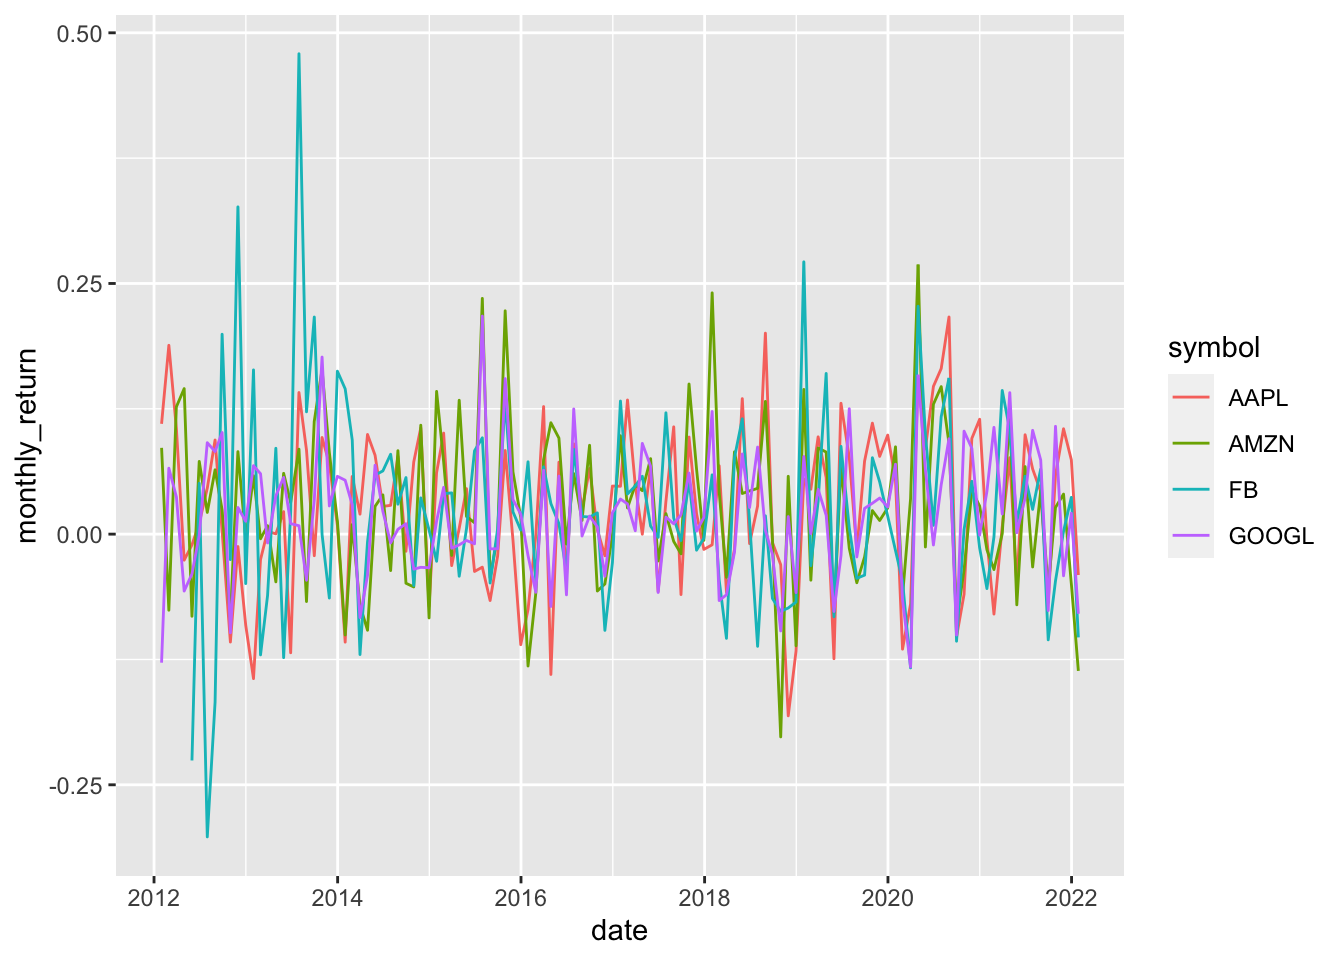
20.6 External Resources
- tidyquant CRAN doc: formal documentation on the package
- tidyquant Github repo: Github repository for the
tidyquantpackage with a great README
with