43 Extract data from scatterplot
Xuan Lian
There was a time in another class in Columbia University, one of the assignments is to perform KNN algorithms. The professor asked us to draw the boundary lines on the given data, which was showed on a scatter plot. However, as no data form is provided, we can not get the details of the data. So instead of solving it quantitatively by coding, we have to draw some ugly thresholds manually.
Then it comes to me that as many of the scatter plots as well as other plots are drawn by ggplot in R, which basically have a standard format. Can we develop a package to extract data from the Image like .png or .jpeg file generated by ggplot package?
So in this assignment, I created an R package, which included several functions, to extract data from standard scatter plot generated by ggplot. I was planned to use some computer vision method to detect the axis as well as the labels on that. However, the workload is much heavier than I thought and I just finished the part of detect label position and the point position. You need to input 4 parameters ymax,ymin,xmin and xmax, together with the plot_file into the function scatter2data to get the data extracted from the scatter plot image.
There are still many problems with this function, firstly it only works with scatter plot but not applicable for other kinds of plot generated by ggplot yet. Secondly the accuracy is not 100%, meaning that it can still make progress on the point detect process.
Here is the command to install the package:
# remotes::install_github("Shawn-Lian/image2data")
library(image2data)
The core function in the package is scatter2data, by calling this function you can extract dataset from a standard scatter plot generated by ggplot.
Here is an example how to use it.
We firstly generated several data points and get the scatter plot using geom_point and save the plot in a .png format.
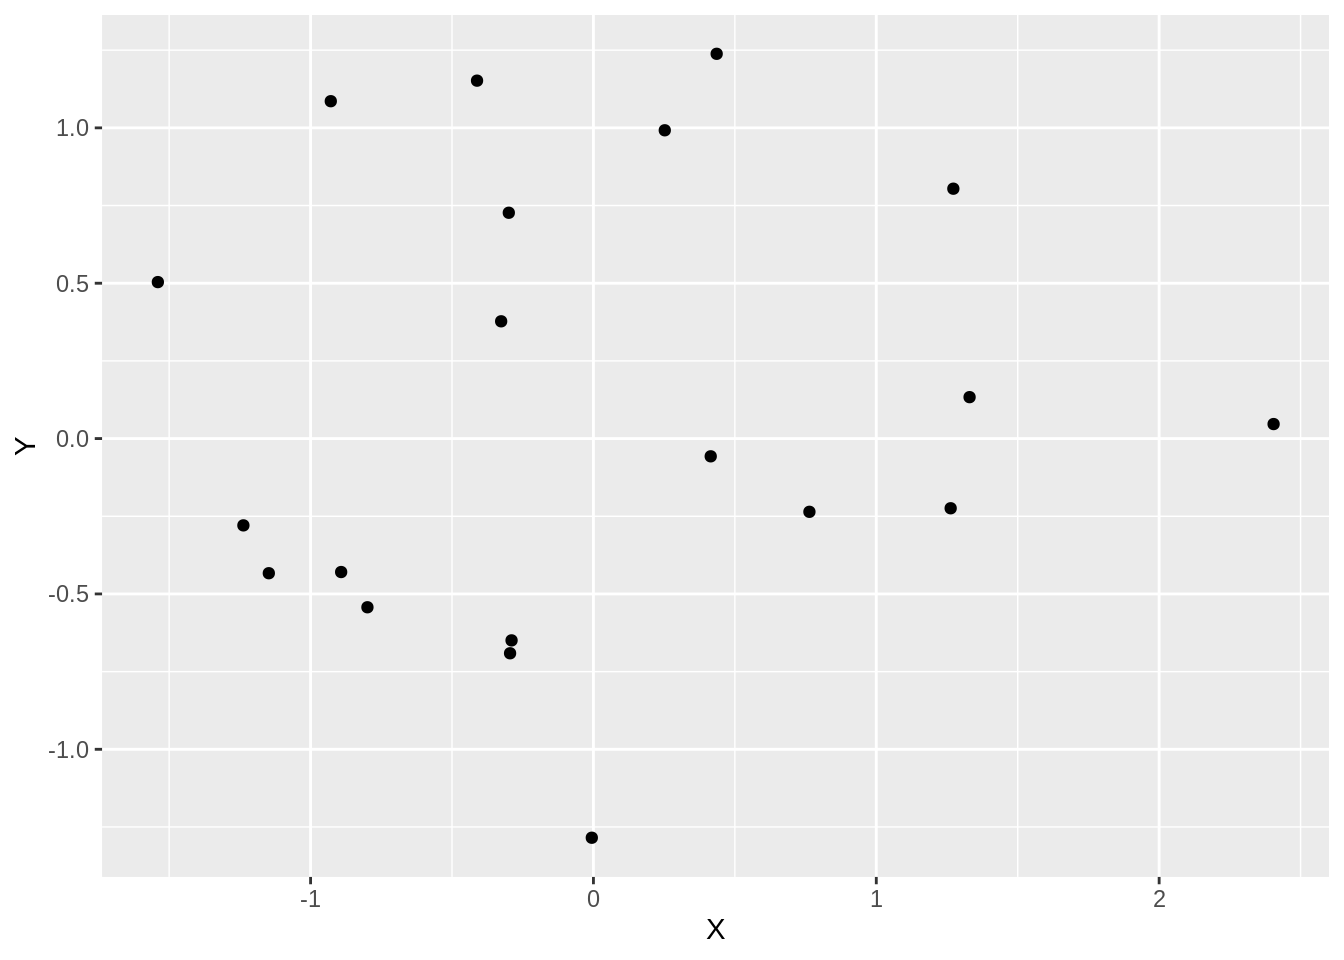
ggsave('resources/image2data/test_plot.png',dpi = 100)There are five parameters used in scatter2data function, first is the address of the plot that you want to extracted data from. Other four parameters are ymax, ymin, xmin, xmax, which is the maximum or minimum value of the y and x axis separately.
In this example, ymax=1, ymin=-1, xmin=-1, xmax=2, and after imputing these parameters we can get the result of the function.
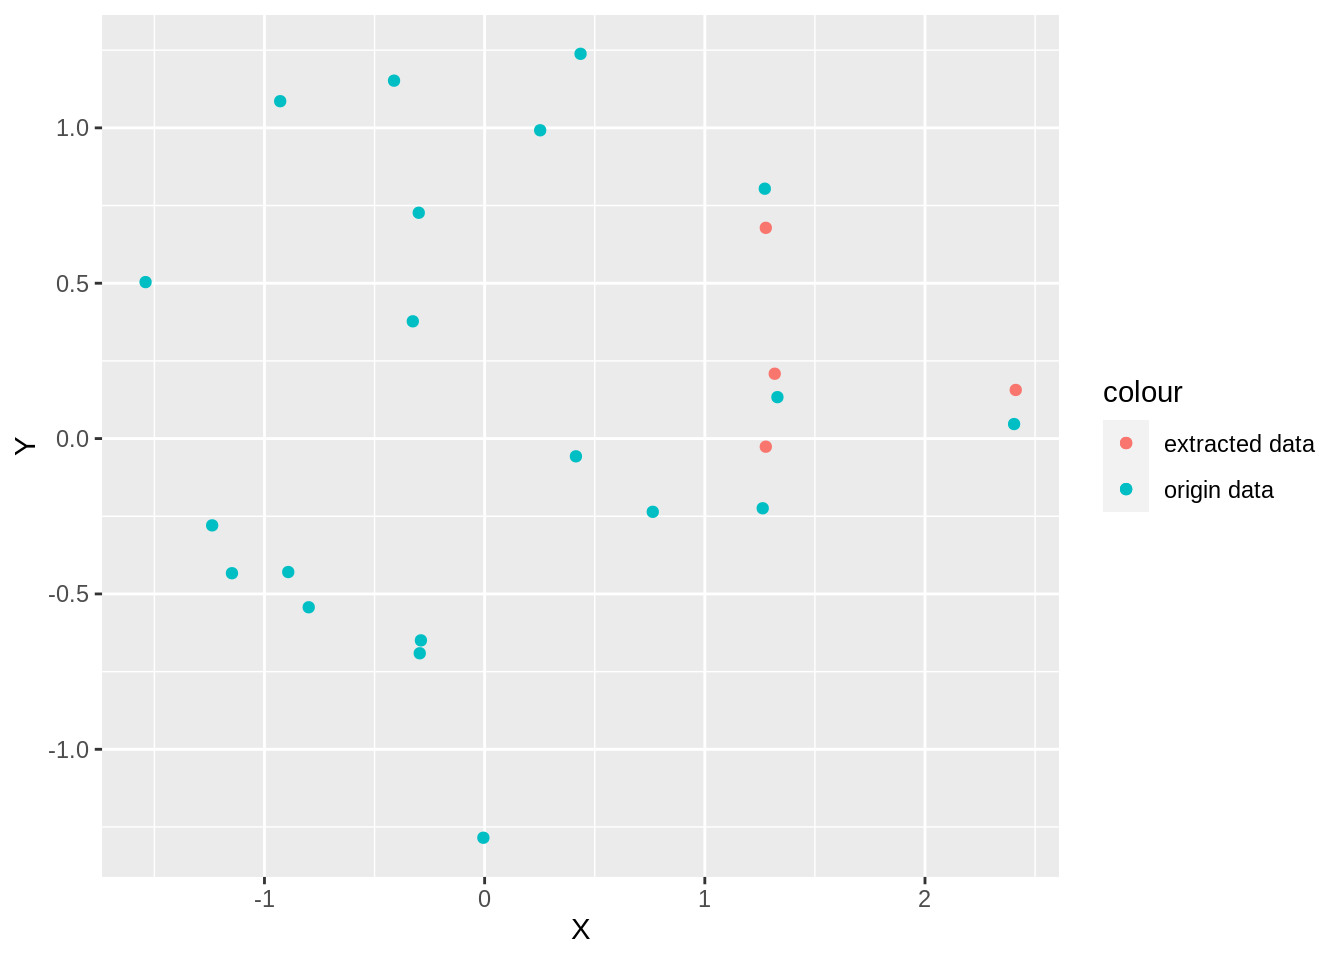
data = image2data:: scatter2data('resources/image2data/test_plot.png',1,-1,-1,2)To check the result, we plot the extracted data and origin data on the same scatter plot.
ggplot()+
  geom_point(aes(x=X,y=Y,color = 'origin data')) +
  geom_point(aes(y= data[,2],x = data[,1], color = 'extracted data'))