109 Plotting theme for Columbia
Jonathan Huynh
# install.packages("showtext", dependencies = TRUE)
library(openintro)
library(ggplot2)
library(forcats)
library(showtext)
theme_columbia_u <- function(x_lab_rot = 0) {
  font_add_google("Cinzel", "Cinzel") # Similar to Trajan
  font_add_google("Montserrat", "Montserrat") # Similar to Gotham
  showtext_auto()
  title_font <- "Cinzel"
  font <- "Montserrat"

  theme_classic() %+replace%

    theme(
      axis.ticks = element_blank(),

      plot.title = element_text(
                   family = title_font,
                   size = 20,
                   face = "bold",
                   hjust = 0,
                   vjust = 1),

      plot.subtitle = element_text(
                   family = font,
                   size = 14),

      plot.caption = element_text(
                   family = font,
                   size = 8,
                   hjust = 1,
                   vjust = 1),

      axis.title = element_text(
                   family = font,
                   size = 10),

      axis.text = element_text(
                   family = font,
                   size = 8),

      axis.text.x = element_text(angle = x_lab_rot,
                                 hjust = 1,
                                 margin=margin(5, b = 15)),

      legend.text = element_text(
                   family = font,
                   size = 8),

      legend.margin = margin(5)

    )
}

columbia_colors <- c(
  `primaryBlue` = "#1D4F91",
  `secondaryGray` = "#53565A",
  `secondaryBlue` = "#0077C8",
  `accentGreen` = "#228848",
  `accentMagenta` = "#AE2573",
  `accentOrange` = "#FC4C02",
  `accentYellow` = "#FFA300",
  `accentGray` = "#75787B")

columbia_cols <- function(...) {
  cols <- c(...)

  if (is.null(cols))
    return (columbia_colors)

  columbia_colors[cols]
}

columbia_palettes <- list(
  `main` = columbia_cols("primaryBlue", "secondaryBlue", "secondaryGray"),
  `secondary` = columbia_cols("secondaryGray", "secondaryBlue"),
  `coolAccent` = columbia_cols("accentGreen", "secondaryBlue"),
  `warmAccent` = columbia_cols("accentMagenta", "accentOrange", "accentYellow"),
  `accents` = columbia_cols("accentGreen", "accentMagenta", "accentOrange", "accentYellow", "accentGray")
)

columbia_pal <- function(palette = "main", reverse = FALSE, ...) {
  pal <- columbia_palettes[[palette]]

  if (reverse) pal <- rev(pal)

  colorRampPalette(pal, ...)
}

scale_color_columbia <- function(palette = "main", discrete = TRUE, reverse = FALSE, ...) {
  pal <- columbia_pal(palette = palette, reverse = reverse)

  if (discrete) {
    discrete_scale("colour", paste0("columbia_", palette), palette = pal, ...)
  } else {
    scale_color_gradientn(colours = pal(256), ...)
    print("error")
  }
}

scale_fill_columbia <- function(palette = "main", discrete = TRUE, reverse = FALSE, ...) {
  pal <- columbia_pal(palette = palette, reverse = reverse)

  if (discrete) {
    discrete_scale("fill", paste0("columbia_", palette), palette = pal, ...)
  } else {
    scale_fill_gradientn(colours = pal(256), ...)
  }
}
iris <- iris

ggplot(iris, aes(Sepal.Width, Sepal.Length, color = Species)) +
  geom_point(size = 4) +
  labs(x = "Sepal Width",
       y = "Sepal Length",
       title = "Sepal Length vs. Sepal Width",
       caption = "Source: Anderson, Edgar  \nBulletin of the American Iris Society,\n1935 | Anderson, Edgar") +
  scale_color_columbia() +
  theme_columbia_u()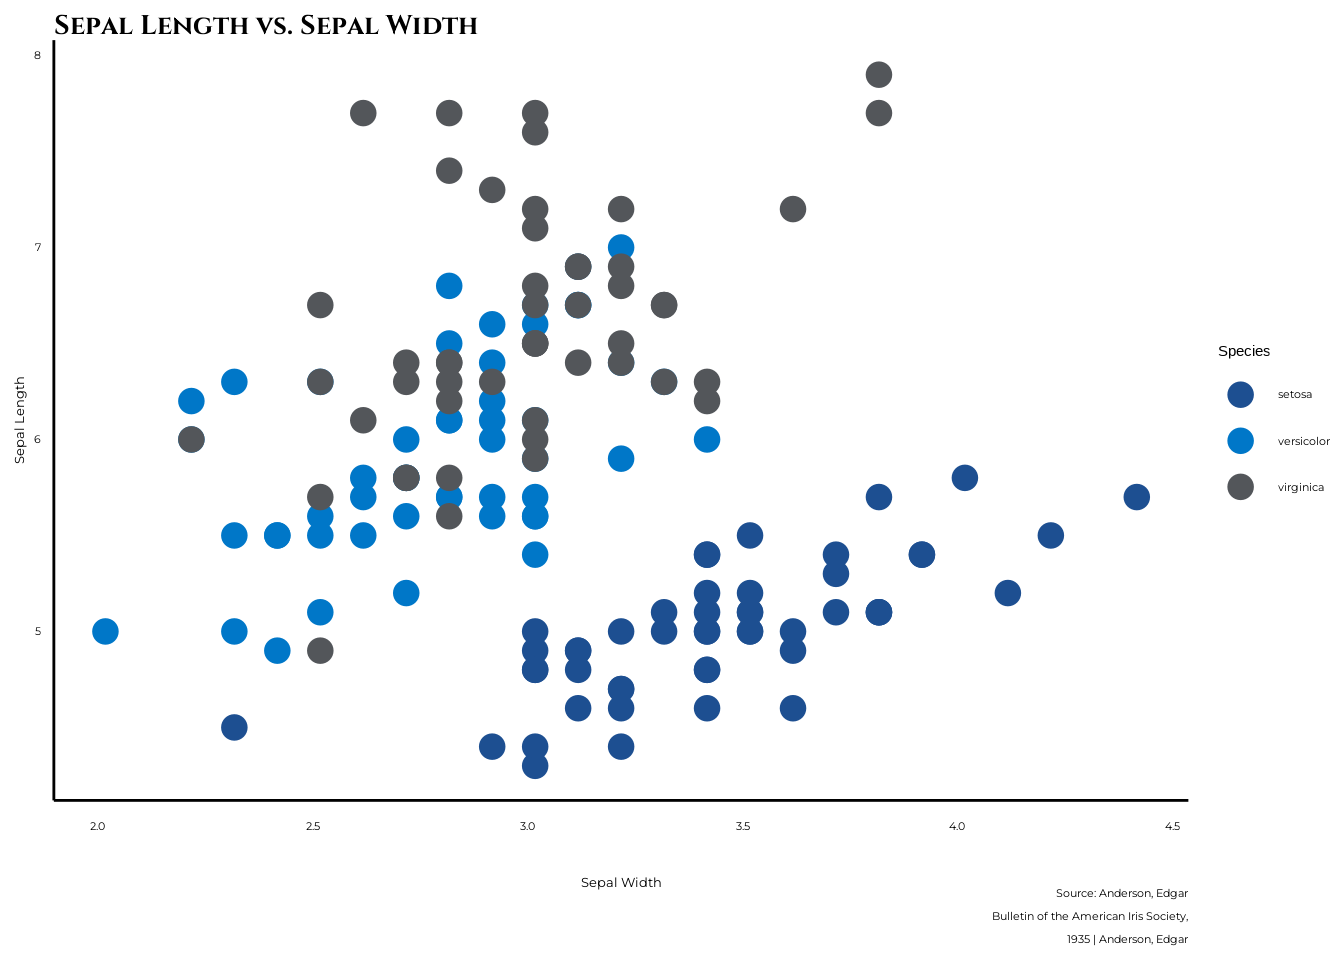
# Index Columbia colors to pass into fill
ggplot(ames, aes(fct_infreq(Roof.Style))) +
    geom_bar(fill = columbia_colors["primaryBlue"]) +
    ggtitle("Number of Roof Styles") +
    xlab("Roof Style") +
    theme_bw(16) +
    theme(panel.grid.major.x = element_blank()) +
    scale_color_columbia() +
    theme_columbia_u()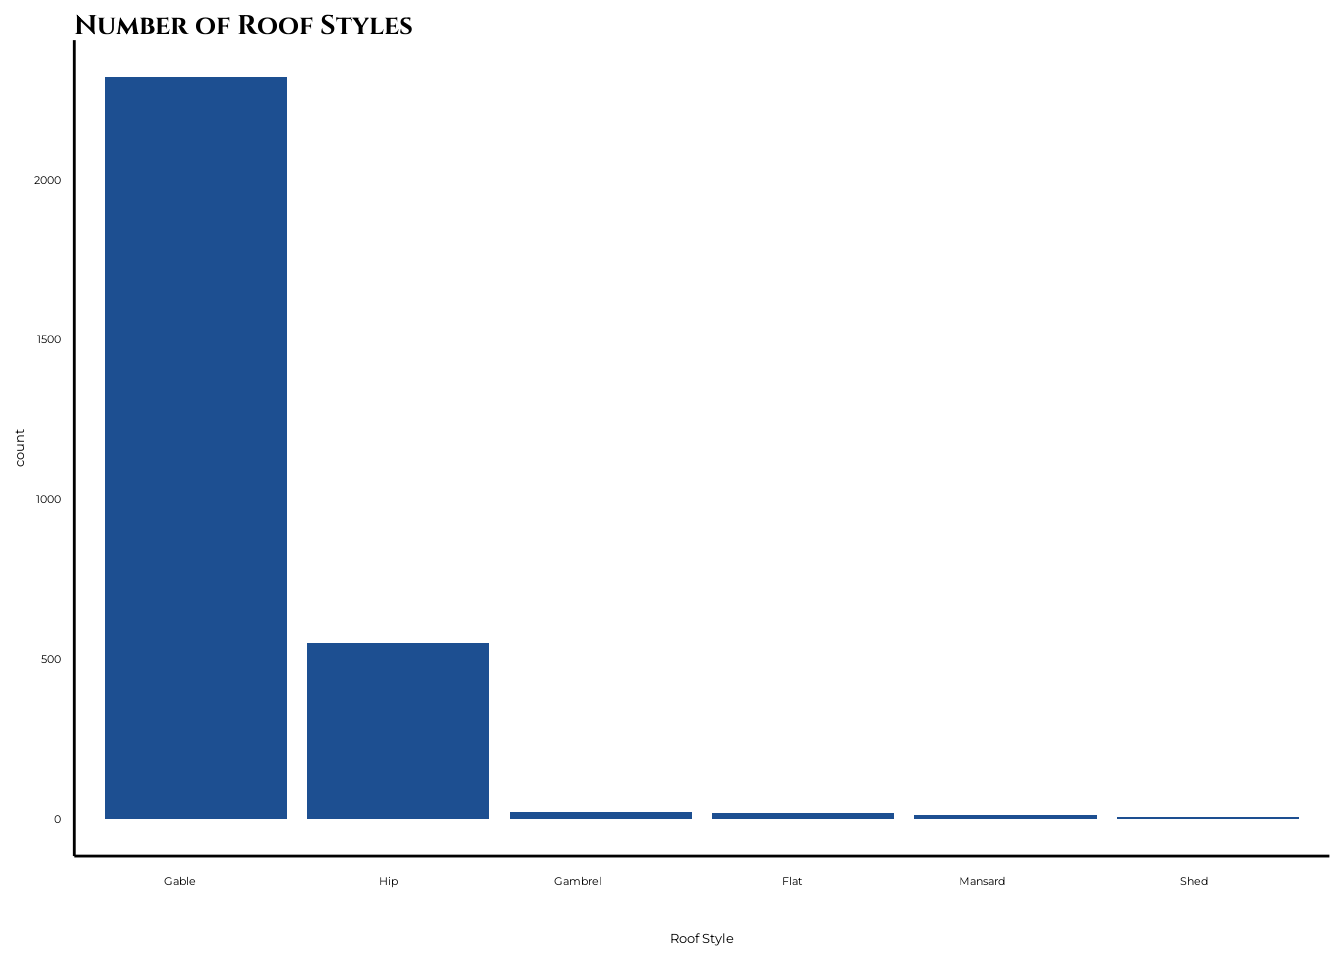
# Packages if you want to import the DSI logo!
if (!require("RCurl", character.only = TRUE)) {
    install.packages("RCurl", dependencies = TRUE)
}
if (!require("png", character.only = TRUE)) {
    install.packages("png", dependencies = TRUE)
}
library(RCurl)
library(png)
dsi_logo <- readPNG(getURLContent("https://datascience.columbia.edu/wp-content/uploads/2021/02/DSI-Vertical_000d74_RGB_Blue_091720.png"))

ggplot(iris, aes(Sepal.Width, Sepal.Length, color = Species)) +
  geom_point(size = 4) +
  labs(x = "Sepal Width",
       y = "Sepal Length",
       title = "Sepal Length vs. Sepal Width",
       caption = "Source: Anderson, Edgar  \nBulletin of the American Iris Society,\n1935 | Anderson, Edgar") +
  scale_color_columbia(palette = "secondary") +
  theme_columbia_u()
# Use you want to add in the DSI logo or some other logo image
grid::grid.raster(dsi_logo, x = 0, y = 0, just = c('left', 'bottom'), width = unit(0.5, 'inches'), height = unit(0.5, 'inches'))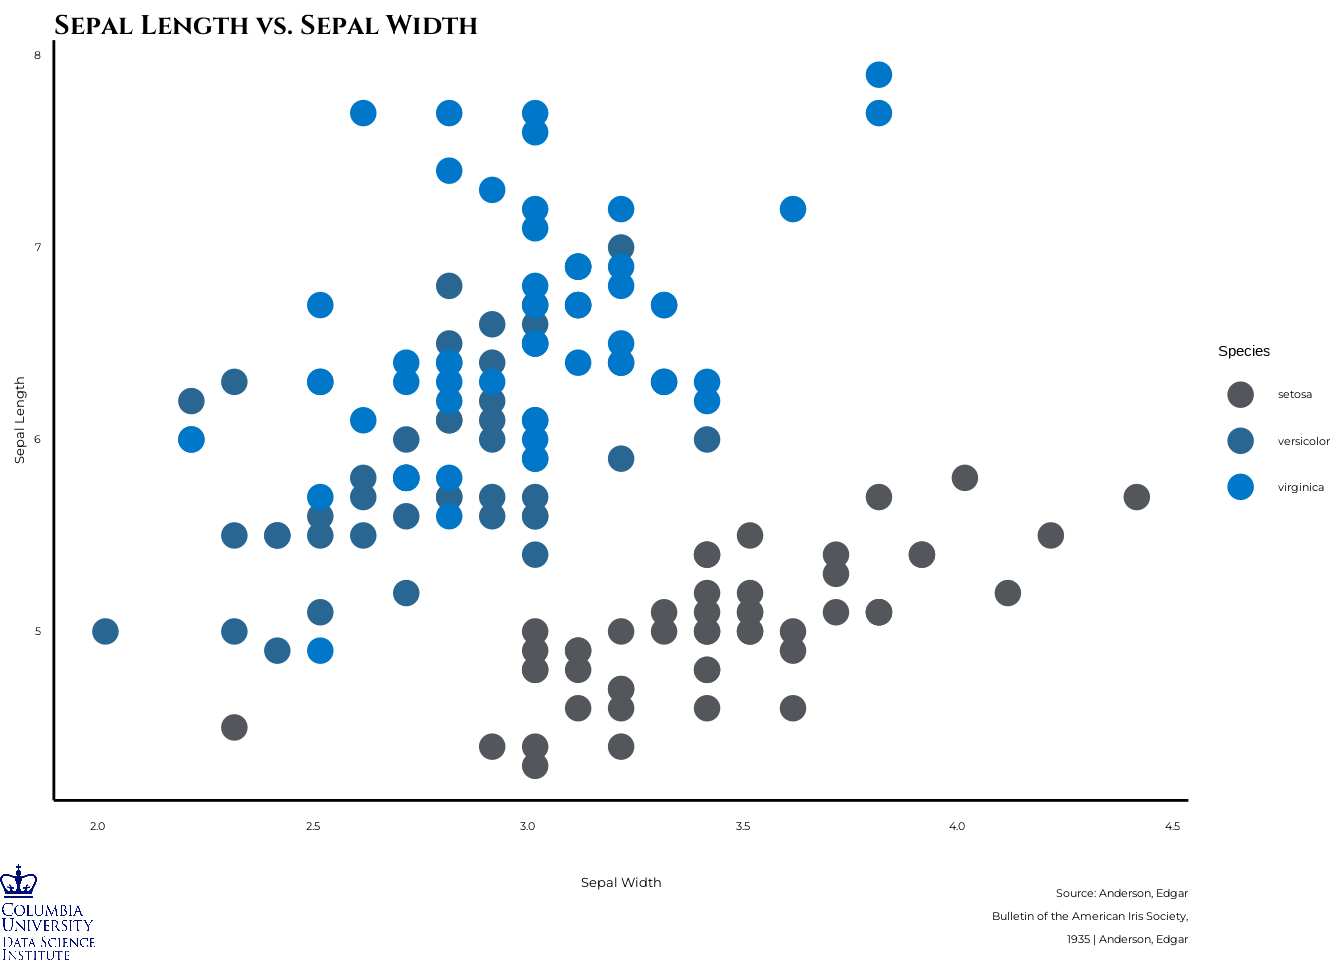
ggplot(iris, aes(Sepal.Width, Sepal.Length)) +
  geom_tile(aes(fill = Species)) +
  scale_fill_columbia(palette = "coolAccent") +
  theme_columbia_u()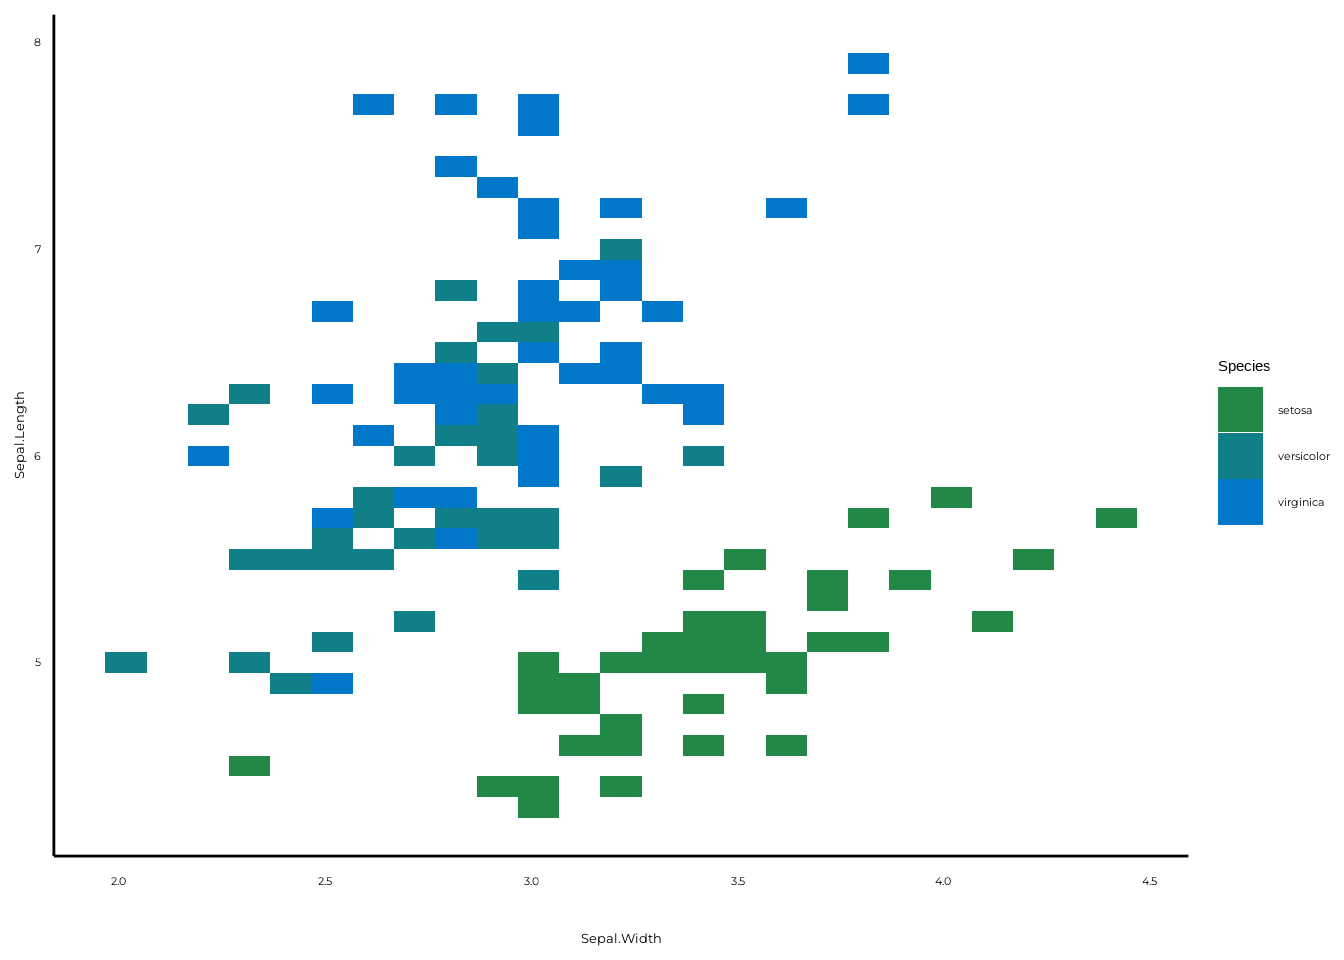
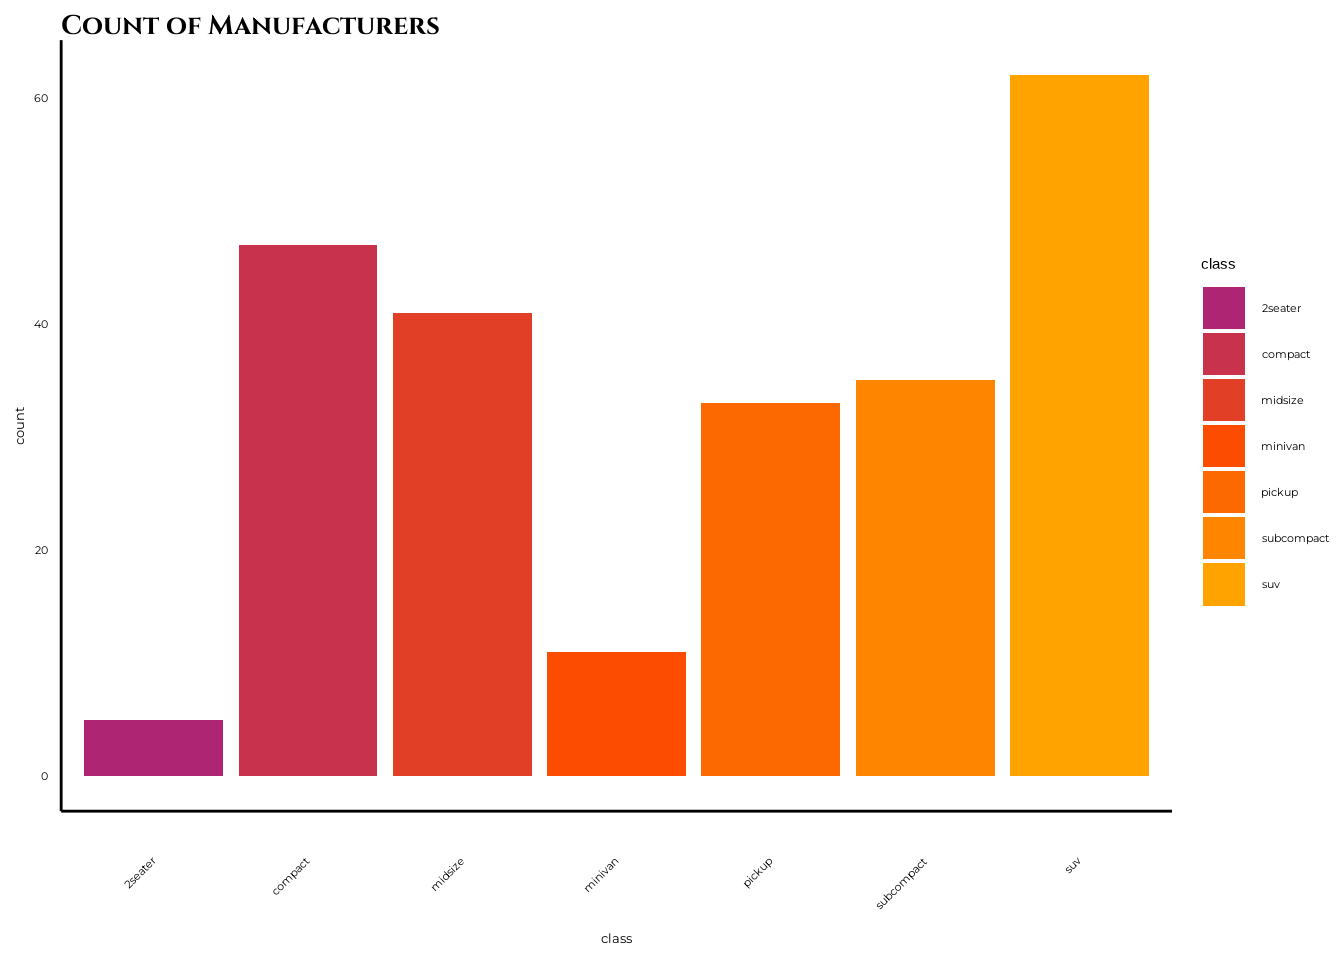
ggplot(mpg, aes(class, fill = class)) +
  geom_bar() +
  labs(title = "Count of Manufacturers") +
  scale_fill_columbia(palette = "warmAccent") +
  theme_columbia_u(x_lab_rot = 45)