101 Tutorial on Using MongoDB with R
Yiran Shu (ys3373)
101.1 Overview
Note: to knit this Rmd file, you should first install MongoDB Compass and add data to the database. These 2 steps are described in part 3 and part 4.
This tutorial talks about how to use MongoDB database system with R. I will introduce how to install the MongoDB database system and the mongolite package, perform CRUD operations with the mongolite package and visualize the data retrieved from the MongoDB database.
101.2 Introduction
MongoDB is a very popular NoSQL database system. Different from relational database management systems, MongoDB is a document database used to build highly available and scalable internet applications [1]. MongoDB stores data in collections (similar to tables in MySQL). A collection is composed of documents (similar to records in MySQL). A document is like JSON-format, consisting of attribute-value pairs, which are real data entities. Because MongoDB has a flexible schema approach, it is very approariate to store semi-structured and unstructured data. Since data is usually semi-structured and unstrcutured in practice, MongoDB is a very popular database management system in web applications.
MongoDB CRUD operations can be learned from https://docs.mongodb.com/manual/crud/. It is very easy to learn and use. Furthermore, MongoDB Compass is very powerful desktop tool for performing operations on and visualizing a MongoDB database. Now that MongoDB is very useful in databases and data analysis, I would like to introduce how to use it with R.
101.3 Installation
Here is the link to download MongoDB Compass: https://www.mongodb.com/try/download/compass
To use MongoDb with R, we need to install the mongolite package. It is the most recent R Mongo driver while some others have been deprecated. That is why we use this package [2].
install.packages("mongolite")
101.4 Add Data to the Database
I took a video on how to do this step on Youtube: https://www.youtube.com/watch?v=BEu8rcslJv8 for reference.
To insert data into the MongoDB database system, we need to first create a database. There is a “Create Database” button in MongoDB Compass. Click it to create a database and a collection. Here I created a database called school and a collection called students.
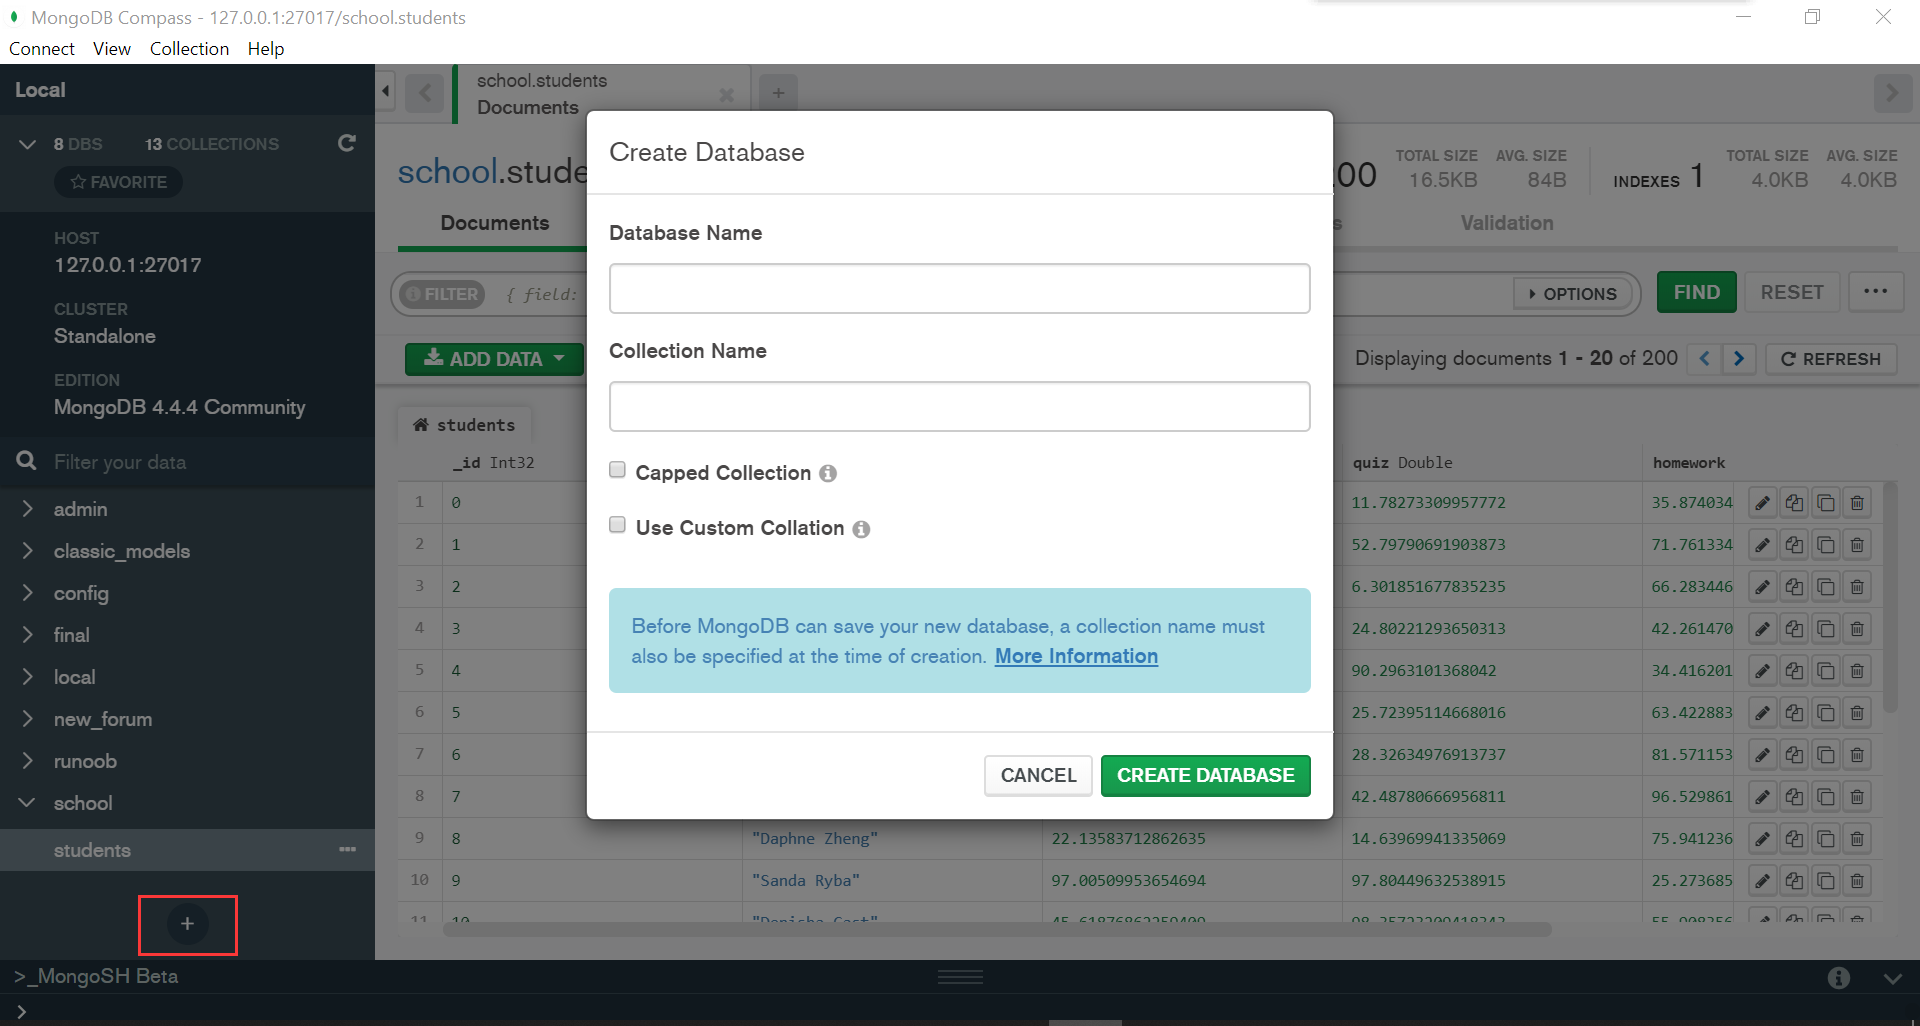
Creaste Database
I used data from https://github.com/ozlerhakan/mongodb-json-files/blob/master/datasets/students.json. I just modified the dataset a little. I have attached the dataset file to my I used data from https://github.com/ozlerhakan/mongodb-json-files/blob/master/datasets/students.json. I just modified the dataset a little. I have attached the modified dataset file to my submission, which is in resources/mongodb_and_r/dataset_editted.txt.
To insert documents to the students collection, copy all text from resources/mongodb_and_r/dataset_editted.txt and suppose it is content. Then, open the "_MongoSH Beta" console and input MongoDB commands db.students.insertMany(content) to add documents to the collection just created. Here content is documents you want to insert. That is the collection I am going to use. The insertMany commands can insert multiple documents at a time. Refer to https://docs.mongodb.com/manual/tutorial/insert-documents/ for more information about the insertMany command.
My collection looks like this after inserting the documents:
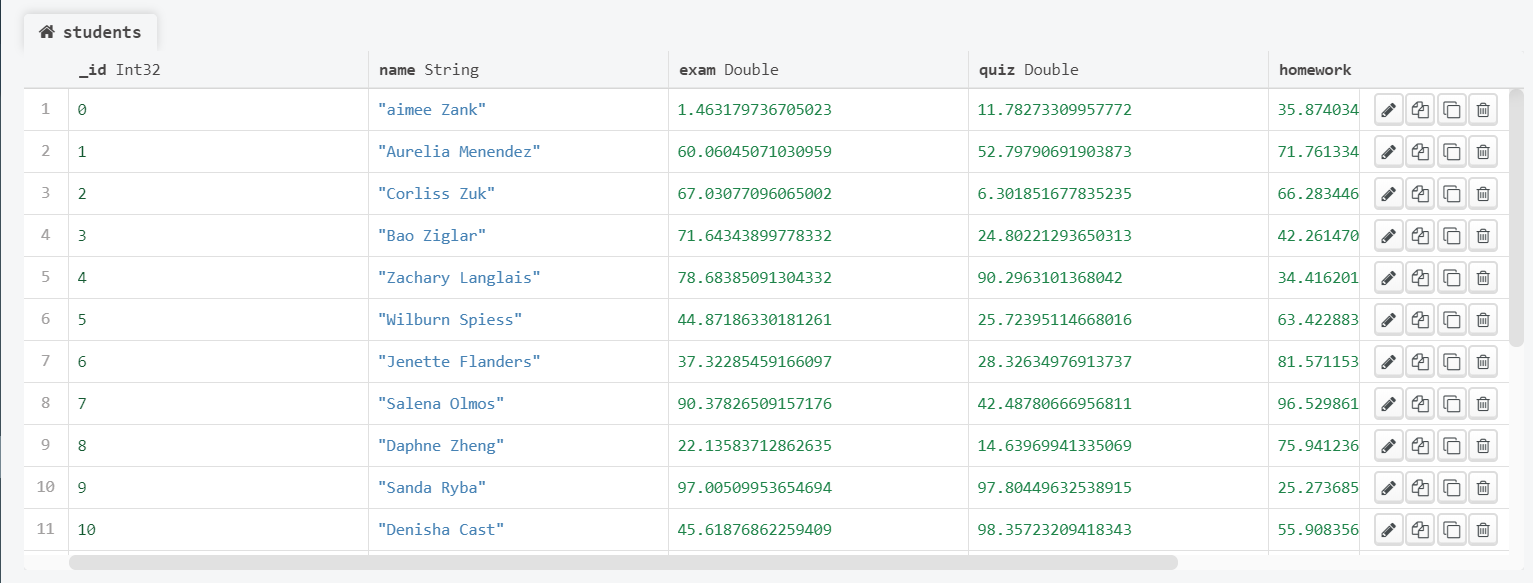
Collection Appearance
Obviously, this dataset is about the grades of each student in a class.
101.5 Connection
We absolutely need to connect to the database to perform operations on the collection. We need a connection string, which is like a url. The connection string can be copied from MongoDB Compass. Then we indicate the database name and collection name to connect.
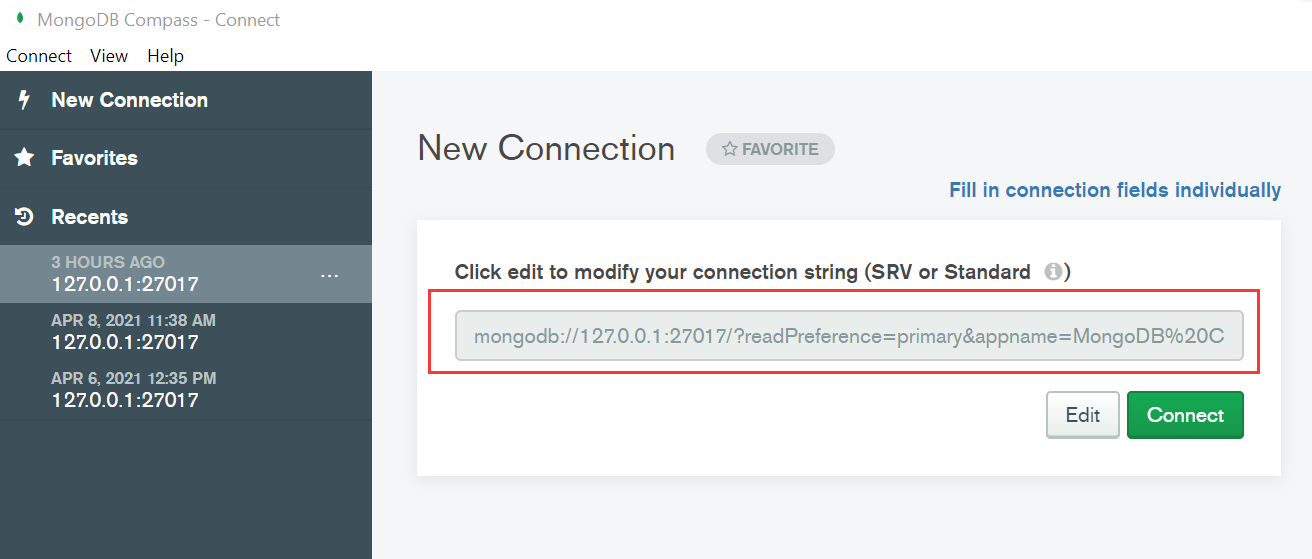
Connection String
connection_string = 'mongodb://127.0.0.1:27017/?readPreference=primary&appname=MongoDB%20Compass&ssl=false'
student_collection = mongo(collection="students", db="school", url=connection_string)
In order to check if the connection is successful, I output the number of documents in the school collection.
student_collection$count()There are 200 documents in the school collection in total, which indicates that the connection is successful.
101.6 Retrieve Data from MongoDB
Now we have connected to the MongoDB database and our collection school. we can use the find command to retrieve data from the MongoDB database. Refer to https://docs.mongodb.com/manual/reference/method/db.collection.find/ for more information about the find command.
If we want to show the first 5 students with the highest exam scores, we can use the following code
student_collection$find(sort='{"exam" : -1}', limit=5, fields='{}')If we want to show all the students whose exam score is higher than 80 and their quiz score is higher than homework score, we can use MongoDB $expr (expressions) to compare two fields in the same document [2].
student_collection$find('{"exam":{"$gt":80}, "$expr": {"$gt": ["$quiz","$homework"]}}')101.7 Other CRUD Operations with Mongolite [3]
In aaddition to retrieving data from the MongoDB database with the mongolite package, we can also use it to perform other CRUD operations.
101.7.1 Insert Command
For example, if we want to add a student named “Yiran”, whose exam score is 93.3, quiz score is 86.1 and homework score is 90.1, we can use the insertcommand. Refer to https://docs.mongodb.com/manual/reference/insert-methods/ for more information about the insert command.
student_collection$insert(c('{ "name" : "Yiran", "exam" : 93.3, "quiz" : 86.1, "homework": 90.1 }'))We can now retrieve the document we just inserted.
student_collection$find('{"name": "Yiran"}')101.7.2 Update Command
If we want to modify an attribute of a document, we can use the update command with the $set expression. Refer to https://docs.mongodb.com/manual/reference/method/db.collection.update/ for more information.
student_collection$update('{"name":"Yiran"}', '{"$set":{"exam": 92.4}}')
student_collection$find('{"name": "Yiran"}')We can see that Yiran’s exam score has been modified into 92.4.
101.7.3 Remove Command
If we want to delete a document from the database, we can use the remove command. Refer to https://docs.mongodb.com/v4.2/reference/method/db.collection.remove/ for more information about the remove command.
student_collection$remove('{"name" : "Yiran"}')
student_collection$find('{"name": "Yiran"}')Now we cannot find anything about Yiran
101.8 Visualization
It is easy to convert the data obtained from APIs of the mongolite package to a dataframe in R.
df <- as.data.frame(student_collection$find())
head(df)
After converting the data to a dataframe, we can use the ggplot2 to visualize the data.
hist1 <- ggplot(df, aes(x=exam)) + geom_histogram(color="white", fill="lightblue")
hist2 <- ggplot(df, aes(x=quiz)) + geom_histogram(color="white", fill="lightblue")
hist3 <- ggplot(df, aes(x=homework)) + geom_histogram(color="white", fill="lightblue")

plot_grid(hist1, hist2, hist3, ncol=2)
melt_df <- melt(df, measure.vars=c('homework', 'exam', 'quiz'))
ggplot(melt_df) + geom_boxplot(aes(x=variable, y=value, color=variable))
Now I want to explore the correlations between homework and quiz, homework and exam, and quiz and exam.
scatter1 <- ggplot(df, aes(x=homework, y=quiz)) + geom_point(color="lightblue")
scatter2 <- ggplot(df, aes(x=homework, y=exam)) + geom_point(color="lightblue")
scatter3 <- ggplot(df, aes(x=quiz, y=exam)) + geom_point(color="lightblue")

plot_grid(scatter1, scatter2, scatter3, ncol=2)
It looks like the 3 pairs of variables have no correlation. Next, I am going to perform chi-square tests to verify it.
Xtest_homework_quiz <- chisq.test(table(df$homework, df$quiz), simulate.p.value=TRUE, correct=FALSE)
Xtest_homework_quiz$p.value
Xtest_homework_exam <- chisq.test(table(df$homework, df$exam), simulate.p.value=TRUE, correct=FALSE)
Xtest_homework_exam$p.value
Xtest_quiz_exam <- chisq.test(table(df$quiz, df$exam), simulate.p.value=TRUE, correct=FALSE)
Xtest_quiz_exam$p.value
All these 3 p-values are much smaller than 0.01. So all the 3 pairs of variables are independent at the 1% significance level.